Communications and Network
Vol.5 No.4(2013), Article ID:39588,5 pages DOI:10.4236/cn.2013.54040
Direction of Arrival Estimation under Spread Spectrum Reference Signal Assisted Radio
Department of Physics, Aristotle University, Thessaloniki, Greece
Email: tkaif@physics.auth.gr
Copyright © 2013 Theodoros N. Kaifas. This is an open access article distributed under the Creative Commons Attribution License, which permits unrestricted use, distribution, and reproduction in any medium, provided the original work is properly cited.
Received September 25, 2013; revised October 22, 2013; accepted October 30, 2013
Keywords: DOA Estimator; Spread Spectrum; Smart Antenna System
ABSTRACT
In the present work, a direction of arrival estimator, under spread spectrum reference of signal-assisted radio operating in a Rayleigh fading channel, is proposed. The analysis, which is applied to general receiver antenna array configurations, demonstrates the high performance of the estimator which is due to the double dispreading (code word and reference signal). The probability distribution function of the estimator is extracted and the system’s robustness in regard to large number of interferers is demonstrated.
1. Introduction
Under the pressure of the telecommunications requirements, in 4G and much more in 5G [1], radios must be equipped with high performance systems that could acquire and use all available information about the channel [2]. Here we focus on Direction of Arrival (DOA), estimation. The system is assumed to be implemented in every carrier of the multicarrier spread spectrum system [1]. Both spread spectrum technology and the information of the reference/pilot bits are employed. Indeed, after the code word dispreading of the array’s output vector, the pilot signal is used to perform the second dispreading. The resulted vector is used as the weight vector of the array. The produced power in the far field is written in quadratic form and its average is computed. The maximum of the produced beam is the DOAs estimate. In the current work, the functionality of the proposed system is addressed and its performance is, both analytically and numerically, verified. In fact, after the Probability Distribution Function (PDF) of the estimator is extracted, its potential to cope with very large number of interferers exhibiting fine resolution is demonstrated.
The paper is organized as follows: First, in Section 2, the signal and system models are given for an uplink scenario of a spread spectrum system. Then, in Section 3, the double dispreading function is studied and in Section 4 the proper convergence of the far-field is demonstrated. The PDF of the estimator is extracted in Section 6 where its statistical properties are presented. Numerical evaluation of the proposed system’s performance follows and last, conclusions are stated.
2. Signal and System Model
Consider an uplink scenario in an asynchronous spread spectrum system with P mobile users. Let
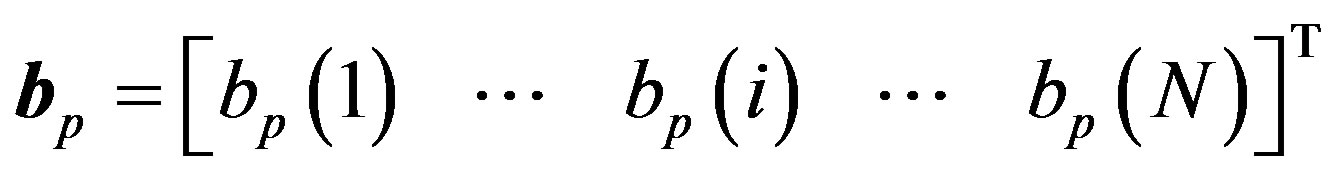 (1)
(1)
be an N-bit sequence for the p-th user with the i-th bit equal to . Subscript T denotes the transpose operation. Also, let
 (2)
(2)
be an  -chip sequence for the p-th user with the i-th chip equal to
 .
.  is spread by
 . Thus, the respective transmitted signal can be represented by a
  vector:
 (3)
(3)
where  is the kronecker product.
Since, the uplink operates asynchronously the orthogonal property of the code vectors breaks down and their elements should be modeled as independent identically distributed (i.i.d.), binary RVs with zero mean. The same mathematical modeling is given to the data bits from the different incoming signals.
To represent the received signal one has to consider a receiver with an antenna array. So, we assume that the array consists of M elements and receives signals from P users that arrive at the array from different directions . The direction—response vector associated with the p-th user is given by
 . The respective signal can be given in the form of a
  matrix with elements:
 (4)
(4)
 is the received complex signal amplitude. The
  random variable (RV), has a Rayleigh PDF and the phase of
  is uniformly distributed in the domain (-π, +π). At this point we make the usual and practical assumption that the fading process is constant for a time period of a block of Ν successive bits.
The received base-band signal across the receiving antenna array can be expressed as:
 (5)
(5)
where  is an
is an  matrix with elements representing spatially and temporally white complex Gaussian noise with zero mean and variance
 .
.
3. Double Dispreading Function
In order to pick out the signal of the  -th user, a codematched filter containing the specified, and properly time aligned, PN sequence,
  , is applied to
  performing the first dispreading function:
 (6)
(6)
where we have defined:
 (7)
(7)
It is easy to prove that:
 (8)
(8)
Thus, using the Central Limit Theorem, that holds for big PG, the RV  is a Gaussian random variable with zero mean and variance equal to PG.
Also for the term  it is:
 (9)
(9)
where  is the M×M unit matrix. The Central Limit Theorem holds for this case also.
Now, assuming that there exist a reference signal,  , which is highly correlated with
 , we can perform the second dispreading forming the inner-product of
  and
and :
:
 (10)
(10)
In (10), using , we have defined:
 (11)
(11)
The average value of the  vector, using Equations (8), (9) and (11), reads:
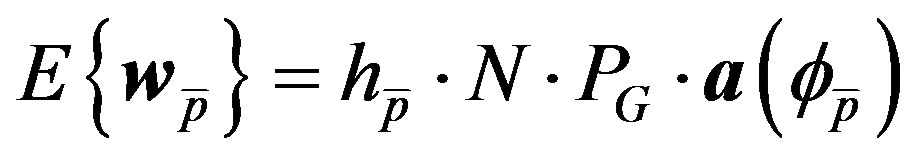 (12)
(12)
The previous equation can be used to give the array’s response vector for the signal of interest (SOI). This can form the basis for the development of a robust DOA estimation algorithm.
Using (12), the angle of arrival  can be computed using various techniques. Here we use
  to find the array’s power pattern. The DOA estimate is given by the angle of the pattern’s maximum. Details are given next.
4. Convergence of the Produced Average Far-Field Pattern
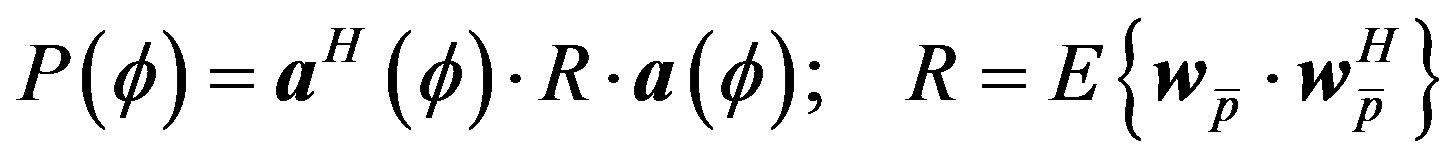
Using  for the array’s weight vector, the produced power pattern is given by:
 (13)
(13)
This pattern can be farther improved by using the average value:
 (14)
(14)
So, we define the average power pattern by using the following:
 (15)
(15)
Finally we have:
 (16)
(16)
Equation (16) is produced due to the fact that the various terms of the summation are mutually uncorrelated. Also, it is easy to prove:
 (17)
(17)
Using (17) and (18) in (16) and inserting the result in (15) gives:
 (18)
(18)
where
 (19)
(19)
is the array’s power pattern when the maximum is towards the p-th incoming signal.
To study the pattern’s convergence we can write (18) as:

(20)
Now it is obvious that increasing ΝPG, which means, increasing the Processing Gain and increasing the number of pilot bits, under the assumption that fading and DOAs remain constant, (20) comes to the limit:
 (21)
(21)
which results that DOA estimation gets more accurate. This limit does not depend on the number P of the incoming signals. Thus, the method can give the correct result assuming that Ν can get an adequate value.
In the following we study the statistical properties of the proposed estimator.
5. Statistical Properties of the DOA Estimator
In the literature, there are methods addressing the statistical properties of DOA estimators. We proceed as in [3] and we assume that the signal to interference plus noise ratio (SINR), is sufficiently high so that the zeros of
 are within one Newton iteration step of the true
 :
:
 (22)
(22)
 and
and  denote the first and second derivatives of the power pattern with respect to
  calculated at
 . Using (20), (22) becomes:
 (23)
(23)
By definition we have that:
 (24)
(24)
Also, for the denominator of (23), approximately (increasing the  product), the next holds:
 (25)
(25)
Using (23)-(25) after rearranging the various terms, (22) becomes:
 (26)
(26)
The extraction of the PDF of the RV given in (26) is not an easy task since the summation terms can take negative values [4]. We start from (26) which is written as:
 (27)
(27)
The  variable can take the following form:
 (28)
(28)
where  are the terms with
 .
.
So, there are  positive variables that constitute the
  RV and
  negative variables that their absolute values are summed to form the
  variable. Now, the RV
  is distributed like:
 (29)
(29)
 is the unit step function. Equation (29) comes from the fact that
  is Rayleigh distributed with the expected value of the square amplitude equal to
 . The conditioning of
  on the angle of arrival of the desired user
  is expressed through the
 .
.
After this, it can be easily shown that the RVs  of (28) are distributed like:
 (30)
(30)
where
 (31)
(31)
Now let us define the variable:
 (32)
(32)
The random variable  is distributed like:

(33)
The RV λ is distributed like:
 (34)
(34)
Let us now proceed to the RV ρ. The PDF of ρ is given by the following:
 (35)
(35)
Before closing the section devoted to the statistical properties of the estimator a note is in order. The PDF of the estimator is conditioned on the DOAs of the signals not of interest and the SOI. Nevertheless, it can be easily proved that the averaging over the DOAs still gives  and
and .
.
6. Numerical Performance Evaluation
In the current section a verification of the extracted PDF of the DOA estimator is given. A computer code was written to simulate the receiver and the signal models. The statistical sampling (Monte Carlo), simulation parameters are as follows: The signal to noise ratio, in the case of a single receiver, is the same for every user. All users have the same power. The average fading power is set equal to 1 while the fading is assumed to be Rayleigh. A Uniform Linear Array (ULA), having seven omnidirectional elements with λ/2 interelement distance is used. The number of interfering signals is set equal to 30. The DOA of the SOI is set equal to 30˚. The DOAs of the P users are uniformly distributed between . The processing gain is set equal to 16. The PDF of the estimated DOA is given in Figure 1.
The continuous curve is produced from Equation (21) while the histogram presents the Monte Carlo extracted PDF after using 103 realizations of the spatial signature. The horizontal axis is the estimation angle in degrees , while in the vertical axis, the absolute occurrence of the events is represented. For example nearly 300 (287), times out of a total of 103 the estimator produced an outcome between 30˚ ± 0.025˚. If we characterize as accurate an estimate in the area 30˚ ± 0.5˚ then the estimator produces an accurate estimate approximately 90% of the trials.
7. Conclusions
A double dispreading based DOA estimator is proposed for a spread spectrum reference of signal-assisted radio. A closed form relation for the PDF of the estimator is extracted to assess its performance. Instead of following the usual path, assuming DOA estimates corrupted by simple additive white noise, the realistic scenario of Rayleigh fading is addressed.
From the theoretical derivation, the estimator’s ability to provide accurate estimates, even in the case of large

Figure 1. The PDF verification of the estimator.
number of interferers, is demonstrated.
The proposed DOA method is readily integrable in the Multicarrier spread spectrum systems [1].
REFERENCES
- K. Fazel and S. Kaiser, “Multi-Carrier and Spread Spectrum Systems: From OFDM and MC-CDMA to LTE and WiMAX,” 2nd Edition, John Wiley & Sons, London, 2008.
- L. C. Godara, “Smart Antennas,” CRC Press, New York, 2004.
- F. Li, H. Liu and R. J. Vaccaro, “Performance Analysis for DOA Estimation Algorithms: Unification, Simplification and Observation,” IEEE Transactions on Aerospace and Electronic Systems, Vol. 29, No. 10, 1993, pp. 1170- 1184.
- M. K. Simon and M.-S. Alouini, “On the Difference of Two Chi-square Variates with Application to Outage Probability Computation,” IEEE Transactions on Communications, Vol. 49, No. 11, 2001, pp. 1946-1954.