Paper Menu >>
Journal Menu >>
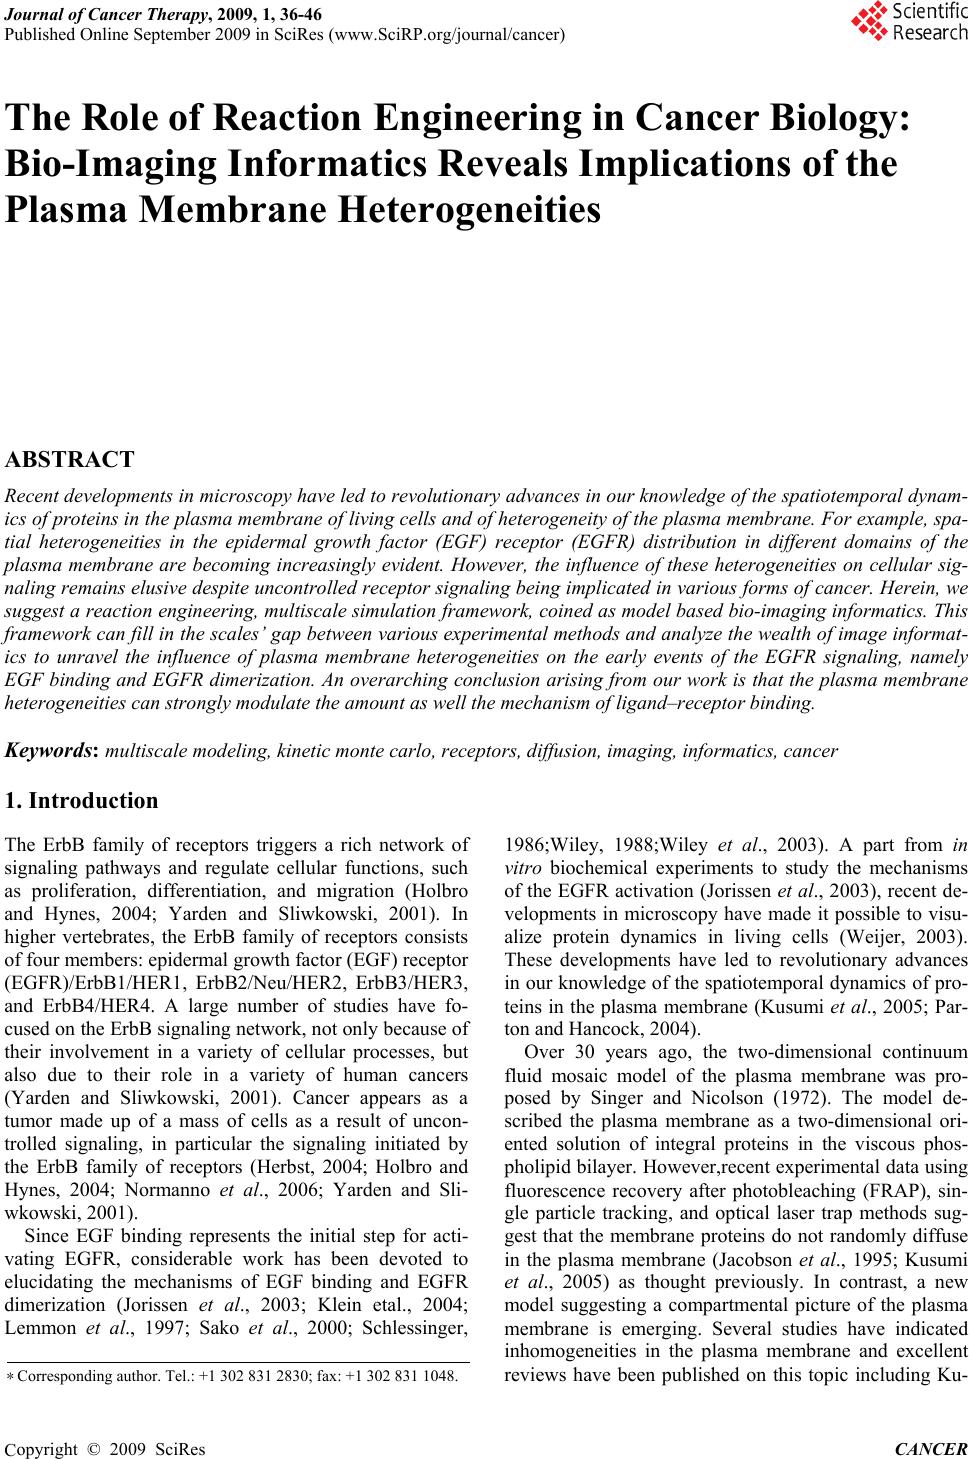 Journal of Cancer Therapy, 2009, 1, 36-46 Published Online September 2009 in SciRes (www.SciRP.org/journal/cancer) The Role of Reaction Engineering in Cancer Biology: Bio-Imaging Informatics Reveals Implications of the Plasma Membrane Heterogeneities ABSTRACT Recent developments in microscopy have led to revolutionary advances in our knowledge of the spatiotemporal dynam- ics of proteins in the plasma membrane of living cells and of heterogeneity of the plasma membrane. For example, spa- tial heterogeneities in the epidermal growth factor (EGF) receptor (EGFR) distribution in different domains of the plasma membrane are becoming increasingly evident. However, the influence of these heterogeneities on cellular sig- naling remains elusive despite uncontrolled receptor signaling being implicated in various forms of cancer. Herein, we suggest a reaction engineering, multiscale simulation framework, coined as model based bio-imaging informatics. This framework can fill in the scales’ gap between various experimental methods and analyze the wealth of image informat- ics to unravel the influence of plasma membrane heterogeneities on the early events of the EGFR signaling, namely EGF binding and EGFR dimerization. An overarching conclusion arising from our work is that the plasma membrane heterogeneities can strongly modulate the amount as well the mechanism of ligand–receptor binding. Keywords: multiscale modeling, kinetic monte carlo, receptors, diffusion, imaging, informatics, cancer 1. Introduction The ErbB family of receptors triggers a rich network of signaling pathways and regulate cellular functions, such as proliferation, differentiation, and migration (Holbro and Hynes, 2004; Yarden and Sliwkowski, 2001). In higher vertebrates, the ErbB family of receptors consists of four members: epidermal growth factor (EGF) receptor (EGFR)/ErbB1/HER1, ErbB2/Neu/HER2, ErbB3/HER3, and ErbB4/HER4. A large number of studies have fo- cused on the ErbB signaling network, not only because of their involvement in a variety of cellular processes, but also due to their role in a variety of human cancers (Yarden and Sliwkowski, 2001). Cancer appears as a tumor made up of a mass of cells as a result of uncon- trolled signaling, in particular the signaling initiated by the ErbB family of receptors (Herbst, 2004; Holbro and Hynes, 2004; Normanno et al., 2006; Yarden and Sli- wkowski, 2001). Since EGF binding represents the initial step for acti- vating EGFR, considerable work has been devoted to elucidating the mechanisms of EGF binding and EGFR dimerization (Jorissen et al., 2003; Klein etal., 2004; Lemmon et al., 1997; Sako et al., 2000; Schlessinger, 1986;Wiley, 1988;Wiley et al., 2003). A part from in vitro biochemical experiments to study the mechanisms of the EGFR activation (Jorissen et al., 2003), recent de- velopments in microscopy have made it possible to visu- alize protein dynamics in living cells (Weijer, 2003). These developments have led to revolutionary advances in our knowledge of the spatiotemporal dynamics of pro- teins in the plasma membrane (Kusumi et al., 2005; Par- ton and Hancock, 2004). Over 30 years ago, the two-dimensional continuum fluid mosaic model of the plasma membrane was pro- posed by Singer and Nicolson (1972). The model de- scribed the plasma membrane as a two-dimensional ori- ented solution of integral proteins in the viscous phos- pholipid bilayer. However,recent experimental data using fluorescence recovery after photobleaching (FRAP), sin- gle particle tracking, and optical laser trap methods sug- gest that the membrane proteins do not randomly diffuse in the plasma membrane (Jacobson et al., 1995; Kusumi et al., 2005) as thought previously. In contrast, a new model suggesting a compartmental picture of the plasma membrane is emerging. Several studies have indicated inhomogeneities in the plasma membrane and excellent reviews have been published on this topic including Ku- ∗ Corresponding author. Tel.: +1 302 831 2830; fax: +1 302 831 1048. Copyright © 2009 SciRes CANCER 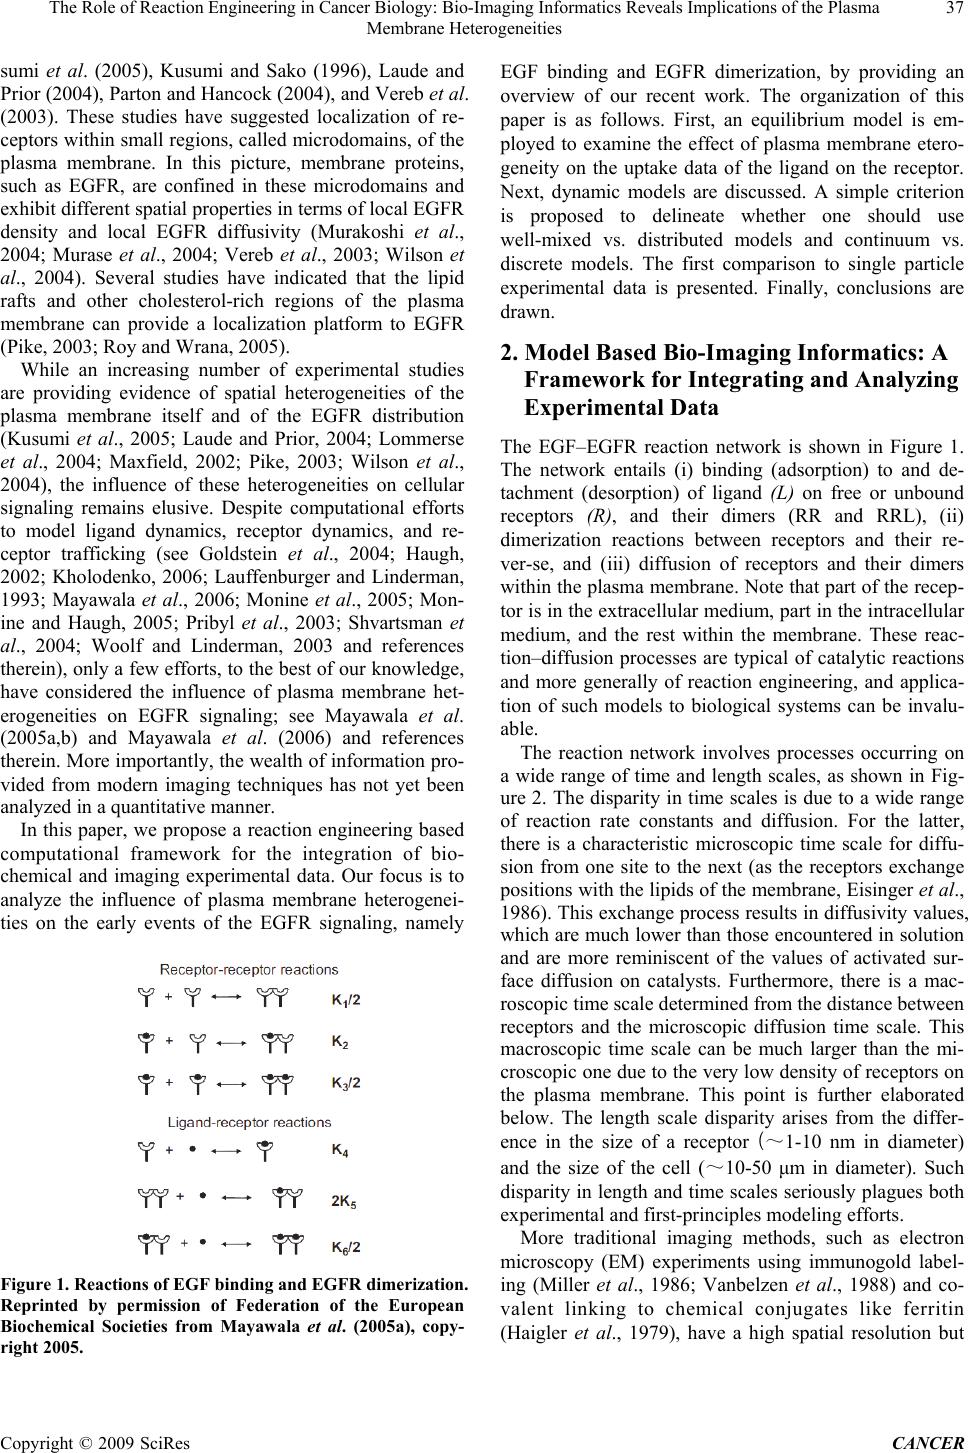 The Role of Reaction Engineering in Cancer Biology: Bio-Imaging Informatics Reveals Implications of the Plasma 37 Membrane Heterogeneities sumi et al. (2005), Kusumi and Sako (1996), Laude and Prior (2004), Parton and Hancock (2004), and Vereb et al. (2003). These studies have suggested localization of re- ceptors within small regions, called microdomains, of the plasma membrane. In this picture, membrane proteins, such as EGFR, are confined in these microdomains and exhibit different spatial properties in terms of local EGFR density and local EGFR diffusivity (Murakoshi et al., 2004; Murase et al., 2004; Vereb et al., 2003; Wilson et al., 2004). Several studies have indicated that the lipid rafts and other cholesterol-rich regions of the plasma membrane can provide a localization platform to EGFR (Pike, 2003; Roy and Wrana, 2005). While an increasing number of experimental studies are providing evidence of spatial heterogeneities of the plasma membrane itself and of the EGFR distribution (Kusumi et al., 2005; Laude and Prior, 2004; Lommerse et al., 2004; Maxfield, 2002; Pike, 2003; Wilson et al., 2004), the influence of these heterogeneities on cellular signaling remains elusive. Despite computational efforts to model ligand dynamics, receptor dynamics, and re- ceptor trafficking (see Goldstein et al., 2004; Haugh, 2002; Kholodenko, 2006; Lauffenburger and Linderman, 1993; Mayawala et al., 2006; Monine et al., 2005; Mon- ine and Haugh, 2005; Pribyl et al., 2003; Shvartsman et al., 2004; Woolf and Linderman, 2003 and references therein), only a few efforts, to the best of our knowledge, have considered the influence of plasma membrane het- erogeneities on EGFR signaling; see Mayawala et al. (2005a,b) and Mayawala et al. (2006) and references therein. More importantly, the wealth of information pro- vided from modern imaging techniques has not yet been analyzed in a quantitative manner. In this paper, we propose a reaction engineering based computational framework for the integration of bio- chemical and imaging experimental data. Our focus is to analyze the influence of plasma membrane heterogenei- ties on the early events of the EGFR signaling, namely Figure 1. Reactions of EGF binding and EGFR dimerization. Reprinted by permission of Federation of the European Biochemical Societies from Mayawala et al. (2005a), copy- right 2005. EGF binding and EGFR dimerization, by providing an overview of our recent work. The organization of this paper is as follows. First, an equilibrium model is em- ployed to examine the effect of plasma membrane etero- geneity on the uptake data of the ligand on the receptor. Next, dynamic models are discussed. A simple criterion is proposed to delineate whether one should use well-mixed vs. distributed models and continuum vs. discrete models. The first comparison to single particle experimental data is presented. Finally, conclusions are drawn. 2. Model Based Bio-Imaging Informatics: A Framework for Integrating and Analyzing Experimental Data The EGF–EGFR reaction network is shown in Figure 1. The network entails (i) binding (adsorption) to and de- tachment (desorption) of ligand (L) on free or unbound receptors (R), and their dimers (RR and RRL), (ii) dimerization reactions between receptors and their re- ver-se, and (iii) diffusion of receptors and their dimers within the plasma membrane. Note that part of the recep- tor is in the extracellular medium, part in the intracellular medium, and the rest within the membrane. These reac- tion–diffusion processes are typical of catalytic reactions and more generally of reaction engineering, and applica- tion of such models to biological systems can be invalu- able. The reaction network involves processes occurring on a wide range of time and length scales, as shown in Fig- ure 2. The disparity in time scales is due to a wide range of reaction rate constants and diffusion. For the latter, there is a characteristic microscopic time scale for diffu- sion from one site to the next (as the receptors exchange positions with the lipids of the membrane, Eisinger et al., 1986). This exchange process results in diffusivity values, which are much lower than those encountered in solution and are more reminiscent of the values of activated sur- face diffusion on catalysts. Furthermore, there is a mac- roscopic time scale determined from the distance between receptors and the microscopic diffusion time scale. This macroscopic time scale can be much larger than the mi- croscopic one due to the very low density of receptors on the plasma membrane. This point is further elaborated below. The length scale disparity arises from the differ- ence in the size of a receptor (~1-10 nm in diameter) and the size of the cell (~10-50 μm in diameter). Such disparity in length and time scales seriously plagues both experimental and first-principles modeling efforts. More traditional imaging methods, such as electron microscopy (EM) experiments using immunogold label- ing (Miller et al., 1986; Vanbelzen et al., 1988) and co- valent linking to chemical conjugates like ferritin (Haigler et al., 1979), have a high spatial resolution but Copyright © 2009 SciRes CANCER 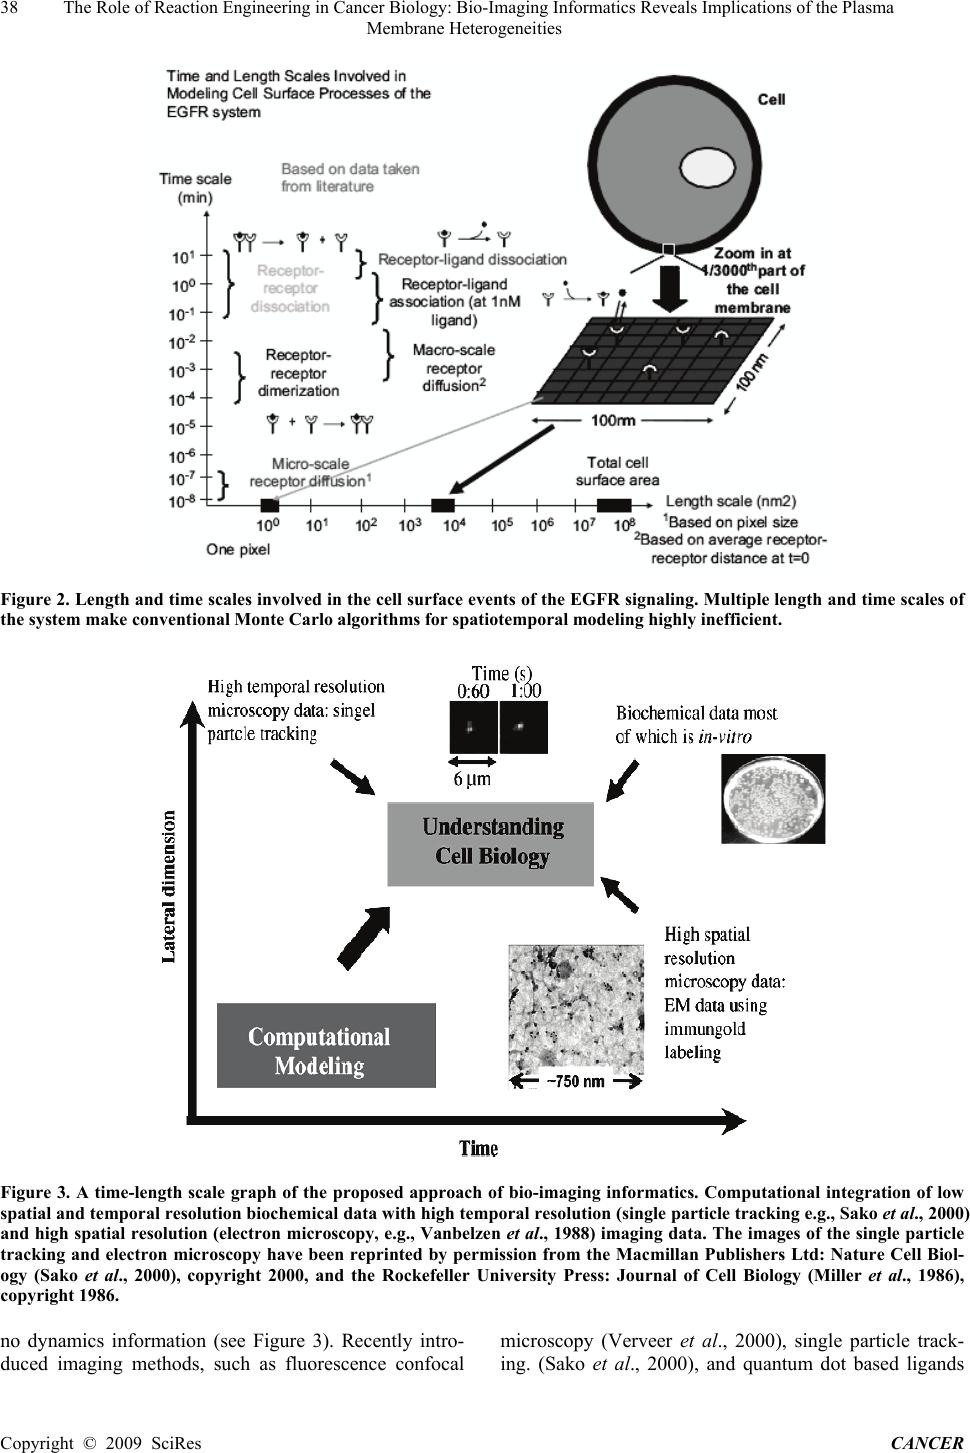 38 The Role of Reaction Engineering in Cancer Biology: Bio-Imaging Informatics Reveals Implications of the Plasma Membrane Heterogeneities Figure 2. Length and time scales involved in the cell surface events of the EGFR signaling. Multiple length and time scales of the system make conventional Monte Carlo algorithms for spatiotemporal modeling highly inefficient. Figure 3. A time-length scale graph of the proposed approach of bio-imaging informatics. Computational integration of low spatial and temporal resolution biochemical data with high temporal resolution (single particle tracking e.g., Sako et al., 2000) and high spatial resolution (electron microscopy, e.g., Vanbelzen et al., 1988) imaging data. The images of the single particle tracking and electron microscopy have been reprinted by permission from the Macmillan Publishers Ltd: Nature Cell Biol- ogy (Sako et al., 2000), copyright 2000, and the Rockefeller University Press: Journal of Cell Biology (Miller et al., 1986), copyright 1986. no dynamics information (see Figure 3). Recently intro- duced imaging methods, such as fluorescence confocal microscopy (Verveer et al., 2000), single particle track- ing. (Sako et al., 2000), and quantum dot based ligands Copyright © 2009 SciRes CANCER  The Role of Reaction Engineering in Cancer Biology: Bio-Imaging Informatics Reveals Implications of the Plasma 39 Membrane Heterogeneities (Lidke et al., 2004), have high temporal resolution but a relatively low spatial resolution (of the order of ~ 0.2- 0.5μm), as shown in Figure 3, due to their optical nature. These methods exhibit high sensitivity, i.e., one can vi- sualize individual proteins in a spot, but it is not unam- biguously clear when many proteins are nearby. As a result, available imaging technologies do not allow si- multaneous high temporal and spatial resolution of mul- tiple receptors. Traditional in vitro experimental tech- niques (see Figure 3) provide no spatial information (they typically give spatial average and often population aver- age, i.e., over multiple cells, coarse-grained data). At the same time, such experiments are relatively easy to con- duct, and have been and will continue to be the backbone of biochemical experimentation. The above comments underscore the fact that currently there is not a single experimental technique that simulta- neously spans all length and time scales. Yet, imaging provides a wealth of spatial and/or temporal informatics at intermediate or mesoscopic length and time scales. Unfortunately, all this information is difficult to interpret using Qualitative models. The application of chemical engineering principles can be invaluable in extracting quantitative information to better elucidate the mecha- nisms by which plasma membranes behave. While further advances in experimentation should be expected in the future, the aforementioned experimental limitation creates a true opportunity for the emerging field of multiscale modeling that links models at various scales (Vlachos, 2005). To integrate these imaging data along with biochemical data, we propose an approach, coined as model based bio-imaging informatics, which is depicted in Figure 3. We propose that multiscale models could be used to fill in the scales’ gap between the vari- ous experimental methods and integrate multiple experi- mental data with the objective of understanding signaling, reconciling various experimental data, and eventually proposing experiments and increasing our understanding of cancer. Some of these efforts of our group are re- viewed below. A natural question raised is which are the suitable scales and corresponding models of the multiscale ladder for studying plasma membrane phenomena. In vivo mi- croscopy emphasizes the need for computational tools that at least consider spatial heterogeneity. A patch model (reminiscent of adsorption in heterogeneous adsorbates and catalysts) is the simplest approach that can account for spatial heterogeneity and is discussed in the next sec- tion. Single molecule imaging points to the need for dis- crete rather than the traditional continuum and often well-mixed representation. Furthermore, the spatial het- erogeneity of the plasma membrane and of the proteins (e.g., cluster formation at longer times, uphill diffusion, etc., which are not further discussed here) underscores the possible inability of continuum spatial models, such as reaction–diffusion models, for quantitative modeling of these phenomena. Therefore, the most suitable ap- proach for modeling mesoscopic scale phenomena in the plasma membrane is a kinetic Monte Carlo (KMC) tool (Chatterjee et al., 2004). This method has successfully been used in catalysis since the 1980s (Ziff et al., 1986) and provided insights into spatial correlations, fluctua- tions, and phase transitions. However, direct application of KMC simulation to biological systems is impractical. We elaborate on this important issue next. We return to the suitability of various kinetics-transport models later. Extension of mesoscale models to smaller and larger scales is obviously very important and should be consid- ered in future work. 2.1. Spatial KMC Mesoscopic Simulation Stochastic simulation of reaction–diffusion systems is one of the most detailed but also most expensive mesoscopic tools for studying surface phenomena (Chat- terjee et al., 2004). It can be computationally prohibitive with biologically relevant parameters, as indicated in Figure 2, due to the large disparity in length and time scales. As a result, most biological simulations have em- ployed only a very small number of reactions (this is in contrast to the combinatorial explosion of actual prob- lems) and parameters of comparable magnitude only. One of the major factors contributing to the high compu- tational cost arises from the low density of receptors making the macroscopic time scale for diffusion long (this is a relatively unique feature of biological systems). Furthermore, the separation of reaction time scales, a phenomenon known as stiffness, plagues traditional KMC simulation. The execution of one event at a time (instead of simultaneously advancing all species) is an- other obstacle of KMC. Finally, efficient implementation (search and update) strategies can substantially affect computational speed and programming ease. Recent ap- proaches on acceleratedKMC methods hold promise for overcoming these challenges. These efforts, by our group and others, are reviewed in Chatterjee and Vlachos (2007) and Vlachos (2005) and will not be repeated here. Some comments regarding algorithmic implementation are worth discussing briefly. Two main approaches for spatial KMC implementation are the null-event and the rejection-free algorithms (Chatterjee and Vlachos, 2007; Reese et al., 2001). In this work, we selected the null-event KMC algorithm mainly due to its implementa- tion ease, and devised an improvement to handle the low density of receptors (a hybrid null-event algorithm). In the traditional null-event algorithm (e.g., Reese et al., 2001; Ziff et al., 1986), a site is randomly picked. If the selected site is occupied, then the transition rates of all the microprocesses that can occur on the selected site are computed. The transition rates are normalized with a predefined maximum transition rate to calculate prob- abilities. Based on these probabilities, a microprocess may or may not (null-event) be selected to occur. At low receptor densities, the null-event algorithm is computa- tionally intensive because low density implies a large Copyright © 2009 SciRes CANCER  The Role of Reaction Engineering in Cancer Biology: Bio-Imaging Informatics Reveals Implications of the Plasma 40 Membrane Heterogeneities probability of null events by mostly picking empty sites of the lattice. In our hybrid null-event algorithm, instead of ran- domly picking lattice sites, we randomly pick only among the occupied sites by simply tracking the occupied sites. This is then a hybrid approach that combines the ease of implementation of a null-event algorithm with the success rate of a rejection-free algorithm. Corresponding to typical densities encountered for receptors in the plasma membrane, Figure 4 shows that this modification can lead to over four orders of magnitude speed up,depending on receptor density, over the conventional null-event KMC method. This point illustrates that even small algorithmic improvements can have a tremendous impact on our ability to model biological systems. 3. An Equilibrium Model to Integrate Bio- chemical and Electron Microscopy Data Recently, we analyzed the influence of the plasma mem- brane heterogeneities on the EGF binding to EGFR by a loose integration of electron microscopy data and bio- chemical data using a very simple equilibrium model (Mayawala et al., 2005a). The Scatchard method (briefly mentioned in Appendix A) has extensively been used to analyze the experimental data of equilibrium EGF bind- ing to EGFR (Klein et al., 2004;Wofsy and Goldstein, 1992; Wofsy et al., 1992; Zidovetzki et al., 1991). In a simplistic way, the Scatchard equation, similar to the well-known Langmuir isotherm for adsorption of species on solid catalysts, describes the isotherm of ligand bind- ing to receptors by appropriately linearizing the equation. The data show a concaveup shape, as shown in Figure 5, in contrast to the concave-down shape predicted using typical equilibrium constants (Wofsy et al., 1992). While several studies have provided arguments to explain the concave-up shape, the mechanism responsible for the concave-up nature has been a controversial issue for over a decade (Chamberlin and Davies, 1998; Holbrook et al., 2000; Klein et al., 2004; Wofsy and Goldstein, 1992). Motivated by electron microscopy and biochemical data, we hypothesized that heterogeneity in the local density of the EGFR, due to localization in certain regions of the plasma membrane, can lead to a concave-up Scatchard plot of the EGF/EGFR system. In general, there can be multiple domains with multiple receptor densities. Our model assumed a simplified representation of the receptor density heterogeneity by dividing the plasma membrane into two domains of different receptor densities (a simple two patch model). The total binding was calculated as the binding in low- and high-density regions. We compared the heterogeneous receptor density model with the experimental data of EGF binding to EGFR in A-431 cells. Figure 5 compares the fitted het erogeneous receptor density model with the experimental data of Zidovetzki et al. (1991). Fairly good agreement is seen. At low EGF concentrations, binding takes place predominantly in the high EGFR density regions because Figure 4. The Scatchard plot: comparison of the heteroge- neous receptor density model against experimental data (Zidovetzki et al., 1991). The equilibrium parameters are: K1 = 2.19M−1, K2 =1.02×10³ M−1,K3 =4.77×10⁵ M−1,K4 =6×10⁶ M−1,K5 =K6 = 2.8 × 10⁹ M−1. Reprinted by permis- sion of Federation of the European Biochemical Societies from Mayawala et al. (2005a), copyright 2005. Figure 5. Comparison of CPU (min) of null-event KMC and hybrid null-event KMC algorithms on a 600 × 600 lattice at five different low densities for executing 4×10⁵ collisions. Density indicates the surface coverage. The values for null-event KMC were calculated for 400 collisions and then scaled for 4×10⁵ collisions. The top curve shows that simu- lation of low receptor density systems is impractical using the conventional null-event KMC algorithm. The curves show CPU savings of ~ 30, 000 (at the lowest density of 0.004%) to 800 (at the highest density shown of 0.11%). For each data point, 10 simulations with different seeds of the random number generator were used to collect statistics. Simulations were performed on an AMD_ 2000+ MP proc- essor. of the presence of more predimerized EGFR. As the concentration of the EGF increases, the high-density re- Copyright © 2009 SciRes CANCER  The Role of Reaction Engineering in Cancer Biology: Bio-Imaging Informatics Reveals Implications of the Plasma 41 Membrane Heterogeneities gions get saturated and binding takes place in low-density regions, containing mainly EGFR monomers. The data were fitted assuming a localization of ~14% of the EGFR in 0.17% of the plasma membrane. These numbers are not unique and depend on the equilibrium constants (which have not been determined based on a heterogeneous model). The suggested extent of localiza- tion lies, at least qualitatively, in the range suggested by biochemical and electron microscopy studies. More im- portant than the specific numbers is that it was found that the concave-up shape is preserved over a wide range of localization as well as equilibrium parameters (Mayawala et al., 2005a). In future work, we propose obtaining mi- croscopy data to characterize the effect of heterogeneity of the plasma membrane and receptor density in micro- domains and extract equilibrium constants from the Scatchard plot, i.e., to carry out the analysis in the reverse way from what we have done so far to obtain intrinsic equilibrium constants. This first computational analysis highlights the influe- nce of the plasma membrane heterogeneity on EGFR signaling, and serves as a motivation for further kinet- ics-transport analysis discussed next. 4. Dynamic Modeling 4.1. Choosing a Suitable Mesoscopic Model As alluded to above and further discussed in Chatterjee et al. (2004) and Vlachos (2007), at each scale there is a hierarchy of models, which vary in complexity, computa- tional cost, and accuracy. It is therefore important to de- velop simple criteria that can guide model selection within a scale to strike a balance between accuracy and computational cost. With this as a motivation, in this sec- tion first we assess the importance of spatial phenomena and then we evaluate the accuracy of partial differential equations (PDEs) in transient situations (e.g., upon an extracellular stimulation via exposure of cells to ligand) when spatial effects are important. In order to evaluate the importance of spatial effects on overall kinetics in two-dimensional bimolecular reactions a priori (i.e., without performing spatial simulations), we have assessed the applicability of the second Damkohler number (D a), defined here as the ratio of time scales of collision between receptors and reaction. For a bimol- ecular (dimerization) reaction A + B → AB, using the mean-field approximation, the Da number can be defined as (Mayawala et al., 2006) f AB k sD eventreactionofscaletime eventcollisionofscaletime Da /1 /4/1 2 = AB Arealf D k 4 , (1) Figure 6. (a) ABA / VS. BA for Da numbers in the range of 0.025–25 and an initial receptor coverage of 02.0 00 BA (subscript 0 denotes initial conditions). ABA / =BA follows the diagonal. (b) Comparison of effective rate constant vs. time, obtained using the spatial KMC and two simple PDE models, for three different initial coverages and Da = 2.5. Curves represent the mean of 30 concentration profiles obtained using different random number seeds. Reprinted with permission from Elsevier from Biophysical Chemistry (Mayawala et al., 2006). where DAB = DA + DB, DA and DB are the diffusivities of A and B, respectively, kf and kf,Areal are the intrinsic reaction rate constants for a bimolecular reaction between A and B in units of (receptors/site)-1 s-1 and (receptors/area)-1 s-1, a- nd s is the encounter radius. kf and kf , Areal are related usi- ng the encounter radius, as follows: 2 kskAreal (2) To test the Da number criterion and ensure the lack of Copyright © 2009 SciRes CANCER 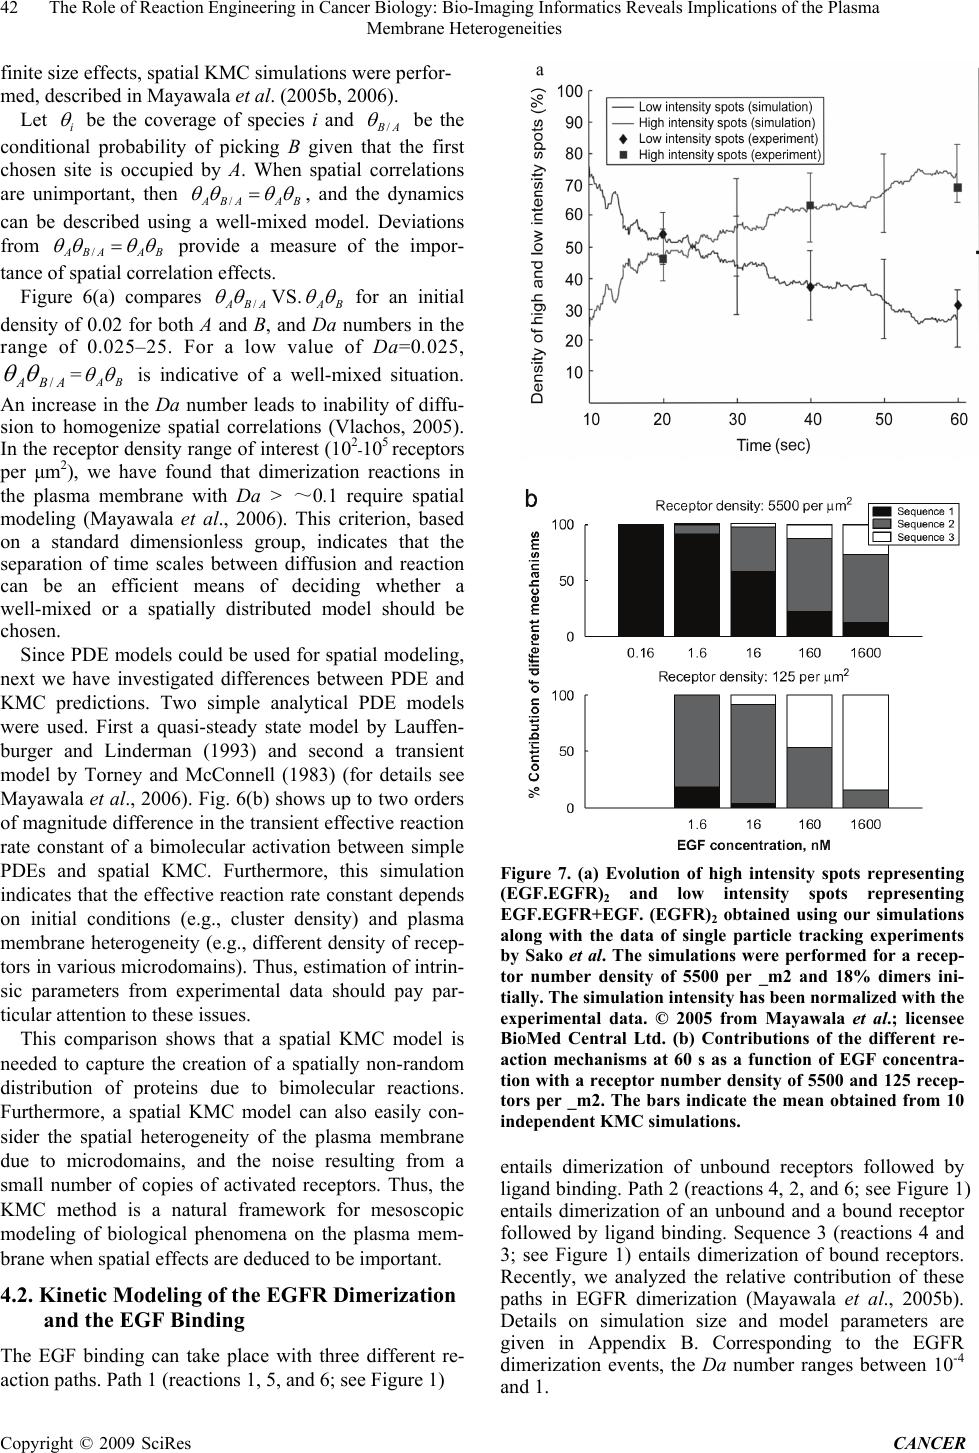 The Role of Reaction Engineering in Cancer Biology: Bio-Imaging Informatics Reveals Implications of the Plasma 42 Membrane Heterogeneities finite size effects, spatial KMC simulations were perfor- med, described in Mayawala et al. (2005b, 2006). Let i be the coverage of species i and AB / be the conditional probability of picking B given that the first chosen site is occupied by A. When spatial correlations are unimportant, then BAABA /, and the dynamics can be described using a well-mixed model. Deviations from BAABA / provide a measure of the impor- tance of spatial correlation effects. Figure 6(a) compares ABA / VS. BA for an initial density of 0.02 for both A and B, and Da numbers in the range of 0.025–25. For a low value of Da=0.025, ABA / =BA is indicative of a well-mixed situation. An increase in the Da number leads to inability of diffu- sion to homogenize spatial correlations (Vlachos, 2005). In the receptor density range of interest (102-105 receptors per μm2), we have found that dimerization reactions in the plasma membrane with Da > ~0.1 require spatial modeling (Mayawala et al., 2006). This criterion, based on a standard dimensionless group, indicates that the separation of time scales between diffusion and reaction can be an efficient means of deciding whether a well-mixed or a spatially distributed model should be chosen. Since PDE models could be used for spatial modeling, next we have investigated differences between PDE and KMC predictions. Two simple analytical PDE models were used. First a quasi-steady state model by Lauffen- burger and Linderman (1993) and second a transient model by Torney and McConnell (1983) (for details see Mayawala et al., 2006). Fig. 6(b) shows up to two orders of magnitude difference in the transient effective reaction rate constant of a bimolecular activation between simple PDEs and spatial KMC. Furthermore, this simulation indicates that the effective reaction rate constant depends on initial conditions (e.g., cluster density) and plasma membrane heterogeneity (e.g., different density of recep- tors in various microdomains). Thus, estimation of intrin- sic parameters from experimental data should pay par- ticular attention to these issues. This comparison shows that a spatial KMC model is needed to capture the creation of a spatially non-random distribution of proteins due to bimolecular reactions. Furthermore, a spatial KMC model can also easily con- sider the spatial heterogeneity of the plasma membrane due to microdomains, and the noise resulting from a small number of copies of activated receptors. Thus, the KMC method is a natural framework for mesoscopic modeling of biological phenomena on the plasma mem- brane when spatial effects are deduced to be important. 4.2. Kinetic Modeling of the EGFR Dimerization and the EGF Binding The EGF binding can take place with three different re- action paths. Path 1 (reactions 1, 5, and 6; see Figure 1) Figure 7. (a) Evolution of high intensity spots representing (EGF.EGFR)2 and low intensity spots representing EGF.EGFR+EGF. (EGFR)2 obtained using our simulations along with the data of single particle tracking experiments by Sako et al. The simulations were performed for a recep- tor number density of 5500 per _m2 and 18% dimers ini- tially. The simulation intensity has been normalized with the experimental data. © 2005 from Mayawala et al.; licensee BioMed Central Ltd. (b) Contributions of the different re- action mechanisms at 60 s as a function of EGF concentra- tion with a receptor number density of 5500 and 125 recep- tors per _m2. The bars indicate the mean obtained from 10 independent KMC simulations. entails dimerization of unbound receptors followed by ligand binding. Path 2 (reactions 4, 2, and 6; see Figure 1) entails dimerization of an unbound and a bound receptor followed by ligand binding. Sequence 3 (reactions 4 and 3; see Figure 1) entails dimerization of bound receptors. Recently, we analyzed the relative contribution of these paths in EGFR dimerization (Mayawala et al., 2005b). Details on simulation size and model parameters are given in Appendix B. Corresponding to the EGFR dimerization events, the Da number ranges between 10-4 and 1. Copyright © 2009 SciRes CANCER  The Role of Reaction Engineering in Cancer Biology: Bio-Imaging Informatics Reveals Implications of the Plasma 43 Membrane Heterogeneities The dynamics of the ligand binding events were com- pared with the single particle tracking experiment of Sako et al. (2000) at a low EGF concentration of 0.16nM in the 0.60 s time interval as shown in Figure 7(a). The predicted increase of low intensity spots, representing monomers plus dimers having one EGF bound, and high intensity spots, representing EGFR dimer with two EGF molecules, is qualitatively consistent with the experi- mental data. In agreement with the experiments of Sako et al. (2000), path 1 was found to be dominant, contrib- uting 95–100% in the formation of the bound–unbound receptor (EGF.EGFR)2. This comparison serves as a model validation step. Single particle tracking experiments are typically lim- ited to low ligand concentrations (Sako et al., 2000). High concentration of ligand would lead to fluorescence of a large number of EGFRs making it impossible to visualize individual particles. However, simulations can be used to overcome the limitation. Our simulations in dicate that the relative contributions of paths 1–3 at 60 s change with ligand concentration (see Figure 7(b)). At low ligand concentration, path 1 dominates, whereas at higher ligand concentration, a significant fraction of dimers form via path 2 as well as path 3. At low ligand concentration, most of the ligand binds to predimerized receptors with higher affinity; however, the extent to which free EGFR dimerization can occur is limited due to the low affinity of free EGFR dimerization. At higher ligand concentration, at least one of the dimerization partners is ligand bound. The receptor density can also significantly influence the mechanism of EGF binding as shown in Figure 7(b). For a low receptor density of 125 receptors per μm2, at lower EGF concentration path 2 is dominant, whereas at higher EGF concentration, path 3 is dominant. Path 1 is not important at low receptor density because of the low or negligible amount of predimerized EGFR. Next, we analyzed the influence of spatial inhomoge- neitiesn on the dynamics of receptor dimerization as de- scribed in Mayawala et al. (2006) using a reversible dimerization reaction A + B → AB. This reaction can represent EGFR dimerization between bound and un- bound receptors or heterodimerization between two members of the ErBb family. We considered changes in EGFR density, due to different cell lines as well as due to localization, and in EGFR diffusivity. The variations in Da number in Figure 8 capture different reaction rate constants of different dimerization reactions shown in Figure 1, and different diffusivities, e.g., the highest Da number corresponds to fast dimerization of ligand bound monomer EGFR in the plasma membrane microdomains with reduced mobility. Figure 8 shows that the diffusion limitation can sig- nificantly lower the dimerization rate in cell lines with a normal density as well as higher density (e.g., human A-431 epidermoid carcinoma cells) of EGFR. For normal cells, even a 100-fold higher density results in only ~ 2.3-fold increase in the diffusion limited dimerization rates (compare bottom and middle curves in Figure 8). This indicates that localization is unlikely to cause a sig- nificant increase in diffusion limited EGFR dimerization rates in normal cells. However, comparison of the middle and top curves in Figure 8 shows that in A-431 cells, only a 10-fold higher density leads to 1–2 orders of magnitude increase in the dimerization rate, suggesting that the dimerization rate is greatly enhanced due to localization. Obviously, this is a simple reaction network but illus- trates the potential effect of spatial heterogeneity on sig- naling; more work is needed to exploit these effects in the full reaction–diffusion network of EGF–EGFR and other receptors. Future study is also needed to explicitly link these observations to their effect on intracellular signal- ing events. 5. Conclusions This work proposes that multiscale modeling can be in- dispensable in filling the gap between various imaging and biochemical methods. Multiscale modeling can capi- talize on the imaging informatics and provide unprece- dented quantitative understanding of biological phenom- ena. Our initial work, reviewed in this paper, has al- readyunderscored the importance of plasma membrane hetero geneities on the EGF binding and the EGFR dimerization. Our work serves as a proof of concept of the feasibility of such simulations despite the disparity in scales and toreconcile apparent discrepancies between in vitro and in vivo experiments (e.g., on the cooperativity of the ligand binding). Obviously, the success of our model does not prove its correctness. Rather, the conclu- sions of this paper serve as hypotheses for future experi- ments. Such iterative approaches have been discussed in Aldridge et al. (2006) and Ma’ayan et al. (2005). For example, based on our equilibrium calculations, a future experiment could entail change of the cholesterol levels in the plasma membrane to observe its effect on the Scatchard plot. Experimental protocols for changing cholesterol levels have previously been developed (Pike, 2003). If the plasma membrane heterogeneities influence the EGF binding, then changing the cholesterol levels should change the distribution of the EGFR, leading to a possible shape change of the Scatchard plot. It is typi- cally from a disagreement between model predictions and ex perimental data where one learns the most. Work along these lines is in progress. 6. Acknowledgments This work was supported by grants from the US Depart- ment of Energy (DE-FG02-05ER25702) and the National Science Foundation (CTS-0343757).We are than- kful to Bridget S. Wilson (Department of Pathology, University of New Mexico, Albuquerque, NM, USA) for providing us the unpublished electron microscopy image. Copyright © 2009 SciRes CANCER  The Role of Reaction Engineering in Cancer Biology: Bio-Imaging Informatics Reveals Implications of the Plasma 44 Membrane Heterogeneities Figure 8. Effectiveness factor as a function of Da number calculated at 33% of the equilibrium concentration of the dimer produced from the reversible dimerization reaction between EGFR. Different dimerization events shown in Figure 1(a) are described by different Da number. Different diffusivities in different microdomains on the plasma mem- brane also contribute to Da number variation. The densities reported on the plot are the initial densities. The bottom curve is representative of an average EGF receptor density in typical normal cells, the middle curve of localization in normal cells and of an average EGF receptor density in cancer cells, and the top curve of localization in cancer cells. The points represent the mean of 30 concentration profiles obtained using different random number seeds and the lines just connect the points. Reprinted with permission from Elsevier from Biophysical Chemistry (Mayawala et al., 2006). 7. Appendix A. The Scatchard Method The Scatchard method involves a transformation of ligand–receptor binding data (an isotherm) such that the ratio of bound receptor (B) to free ligand (L) concentrate- ion when plotted as a function of bound ligand concent- ration gives a linear relation with a slope of .Ka (associa- tion constant) and an intercept as the total density of sites RT (in the same units as B) (Scatchard, 1949), Taa RKBK L B (A.1) 8. Appendix B. Simulation Size and Model Parameters for KMC Simulations The cell surface was represented using a two-d imen- sional square lattice with each pixel of 2 nm × 2 nm in size. The number density of receptors ranges from ~102 receptors per μm2 on normal cells (Benveniste et al., 1988) to ~103 receptors per μm2 on A-431 cells which over- express EGFR (Wiley, 1988). However, the local density of receptors can be much higher in vivo because of the localization of receptors in certain regions of the plasma membrane, such as in lipid rafts (Laude and Prior, 2004; Pike, 2003; Simons and Toomre, 2000). To represent normal cells with 125 receptors per μm2, we simulated a low density of 31 receptors on a 500 nm × 500 nm mesh, and to represent A-431 cells with 5500 receptors per μm2, 55 receptors were randomly placed on a 100 nm×100 nm mesh. The diffusivity of monomer EGFR has been re- ported to be around 2 × 10-14 m2 s-1 (Kusumi et al., 1993; Rees et al., 1984). The model parameters are summarized in Mayawala et al. (2005b). We assumed two types of EGF binding on the cell surface: low affinity binding on monomer EGFR and high affinity binding on dimerized EGFR. Based on experimental studies (Gadella and Jovin, 1995; Martin-Fernandez et al., 2002; Moriki et al., 2001; Vanbelzen et al., 1988; Yu et al., 2002), a fraction (~ 18%) of receptors was initially placed at random loca- tions as dimers on simulated A-431 cells. Corresponding to the dimerization equilibrium constant for these data, there is a negligible number of dimers in the absence of ligand at a density of 125 receptors per μm2. The receptor dimerization constants vary with ligand occupancy. Sev- eral experimental studies have shown that dimerization occurs with higher affinity if at least one of the receptors is ligand bound. Finally, the highest affinity has been suggested for dimerization between two ligand bounded receptors (Lemmon et al., 1997; Sherrill and Kyte, 1996). REFERENCES [1] Aldridge, B.B., Burke, J.M., Lauffenburger, D.A., Sorger, P.K., 2006. Physicochemical modelling of cell signalling pathways. Nature Cell Biology 8, 1195–1203. [2] Benveniste, M., Livneh, E., Schlessinger, J., Kam, Z., 1988. Overexpression of epidermal growth factor receptor in NIH-3T3-transfected cells slows its lateral diffusion and rate of endocytosis. Journal of Cell Biology 106 (6), 1903–1909. [3] Chamberlin, S.G., Davies, D.E., 1998. A unified model of c-erbB receptor homo- and heterodimerisation. Bio- chimica et Biophysica Acta (BBA)—Protein Structure and molecular Enzymology 1384 (2), 223–232. [4] Chatterjee, A., Vlachos, D.G. 2007. A review of spatial microscopic and accelerated kinetic Monte Carlo methods for materials’ simulation. Journal of Computer-Aided Materials Design, invited, in press. [5] Chatterjee, A., Snyder, M.A., Vlachos, D.G., 2004. Mesoscopic modeling of chemical reactivity (invited). Chemical Engineering Science 59, 5559–5567. [6] Eisinger, J., Flores, J., Petersen, W., 1986. A milling crowd model for local and long-range obstructed lateral diffusion. Mobility of excimeric probes in the membrane of intact erythrocytes. Biophysical Journal 49 (5), 987–1001. [7] Gadella Jr., T., Jovin, T., 1995. Oligomerization of epi- dermal growth factor receptors on A431 cells studied by time-resolved fluorescence imaging microscopy.A stereochemical model for tyrosine kinase receptor activa- tion. Journal of Cell Biology 129 (6), 1543–1558. [8] Goldstein, B., Faeder, J.R., Hlavacek, W.S., 2004. Copyright © 2009 SciRes CANCER  The Role of Reaction Engineering in Cancer Biology: Bio-Imaging Informatics Reveals Implications of the Plasma 45 Membrane Heterogeneities Mathematical and computational models of im- mune-receptor signalling. Nature Reviews Immunology 4 (6), 445–456. [9] Haigler, H., McKanna, J., Cohen, S., 1979. Direct visu- alization of the binding and internalization of a ferritin conjugate of epidermal growth factor in human carcinoma cells A-431. Journal of Cell Biology 81 (2), 382–395. [10] Haugh, J.M., 2002. A unified model for signal transduc- tion reactions in cellular membranes. Biophysical Journal 82, 591–604. [11] Herbst, R.S., 2004. Review of epidermal growth factor receptor biology. International Journal of Radiation On- cology Biology Physics 59 (2), 21–26. [12] Holbro, T., Hynes, N.E., 2004. ErbB receptors: directing key signaling networks throughout life. Annual Review of Pharmacology and Toxicology 44, 195–217. [13] Holbrook, M.R., Slakey, L.L., Gross, D.J., 2000. Ther- modynamic mixing of molecular states of the epidermal growth factor receptor modulates macroscopic ligand binding affinity. Biochemical Journal 352, 99–108. [14] Jacobson, K., Sheets, E.D., Simson, R., 1995. Revisiting the fluid mosaic model of membranes. Science 268, 1441–1442. [15] Jorissen, R.N., Walker, F., Pouliot, N., Garrett, T.P.J., Ward, C.W., Burgess, A.W., 2003. Epidermal growth factor receptor: mechanisms of activation and signalling. Experimental Cell Research 284 (1), 31–53. [16] Kholodenko, B.N., 2006. Cell-signalling dynamics in time and space. Nature Reviews Molecular Cell Biology 7 (3), 165–176. [17] Klein, P., Mattoon, D., Lemmon, M.A., Schlessinger, J., 2004. A structurebased model for ligand binding and dimerization of EGF receptors. Proceedings of the Na- tional Academy of Sciences of the USA 101 (4), 929–934. [18] Kusumi, A., Sako, Y., 1996. Cell surface organization by the membrane skeleton. Current Opinion in Cell Biology 8 (4), 566–574. [19] Kusumi, A., Sako, Y., Yamamoto, M., 1993. Confined lateral diffusion of membrane receptors as studied by sin- gle particle tracking (nanovid microscopy). Effects of cal- cium-induced differentiation in cultured epithelial cells. Biophysical Journal 65 (5), 2021–2040. [20] Kusumi, A., Nakada, C., Ritchie, K., Murase, K., Suzuki, K., Murakoshi, H., Kasai, R.S., Kondo, J., Fujiwara, T., 2005. Paradigm shift of the plasma membrane concept from the two-dimensional continuum fluid to the parti- tioned fluid: high-speed single-molecule tracking of membrane molecules. Annual Review of Biophysics and Biomolecular Structure 34 (1), 351–378. [21] Laude, A.J., Prior, I.A., 2004. Plasma membrane micro- domains: organization, function and trafficking (review). Molecular Membrane Biology 21, 193–205. [22] Lauffenburger, D. A., Linderman, J. J., 1993. Receptors Models for Binding, Trafficking, and Signaling. Oxford University Press, New York. [23] Lemmon, M. A., Bu, Z., Ladbury, J. E., Zhou, M., Pin- chasi, D., Lax, I., Engelman, D. M., Schlessinger, J., 1997. Two EGF molecules contribute additively to stabilization of the EGF dimer. The EMBO Journal 16, 281–294. [24] Lidke, D.S., Nagy, P., Heintzmann, R., Arndt-Jovin, D.J., Post, J.N., Grecco, H.E., Jares-Erijman, E.A., Jovin, T.M., 2004. Quantum dot ligands provide new insights into erbB/HER receptor-mediated signal transduction. Nature Biotechnology 22, 198–203. [25] Lommerse, P.H.M., Spaink, H.P., Schmidt, T., 2004. In vivo plasma membrane organization: results of biophysi- cal approaches. Biochimica et Biophysica Acta (BBA)—Biomembranes 1664 (2), 119–131. [26] Ma’ayan, A., Blitzer, R.D., Iyengar, R., 2005. Toward predictive models of mammalian cells. Annual Review of Biophysics and Biomolecular Structure 34 (1), 319–349. [27] Martin-Fernandez, M., Clarke, D. T., Tobin, M. J., Jones, S. V., Jones, G. R., 2002. Preformed oligomeric epider- mal growth factor receptors undergo an ectodomain structure change during signaling. Biophysical Journal 82 (5), 2415–2427. [28] Maxfield, F. R., 2002. Plasma membrane microdomains. Current Opinion in Cell Biology 14 (4), 483–487. [29] Mayawala, K., Vlachos, D. G., Edwards, J. S., 2005a. Heterogeneities in EGF receptor density at the cell surface can lead to concave up Scatchard plot of EGF binding. FEBS Letters 579 (14), 3043–3047. [30] Mayawala, K., Vlachos, D. G., Edwards, J. S., 2005b. Computational modeling reveals molecular details of epi- dermal growth factor binding. BMC Cell Biology 6, 41. [31] Mayawala, K., Vlachos, D. G., Edwards, J. S., 2006. Spa- tial modeling of dimerization reaction dynamics in the plasma membrane: Monte Carlo vs. continuum differen- tial equations. Biophysical Chemistry 121 (3), 194–208. [32] Miller, K., Beardmore, J., Kanety, H., Schlessinger, J., Hopkins, C., 1986. Localization of the epidermal growth factor (EGF) receptor within the endosome of EGF-stimulated epidermoid carcinoma (A431) cells. Journal of Cell Biology 102 (2), 500–509. [33] Monine, M. I., Haugh, J. M., 2005. Reactions on cell membranes: comparison of continuum theory and Brownian dynamics simulations. The Journal of Chemical Physics 123, 074908. [34] Monine, M. I., Berezhkovskii, A. M., Joslin, E. J., Wiley, H. S., Lauffenburger, D. A., Shvartsman, S. Y., 2005. Ligand accumulation in autocrine cell cultures. Biophysi- cal Journal 88 (4), 2384–2390. [35] Moriki, T., Maruyama, H., Maruyama, I. N., 2001. Acti- vation of preformed EGf receptor dimers by ligand-induced rotation of the transmembrane domain1. Journal of Molecular Biology 311 (5), 1011–1026. [36] Murakoshi, H., Iino, R., Kobayashi, T., Fujiwara, T., Oh- shima, C., Yoshimura, A., Kusumi, A., 2004. Sin- gle-molecule imaging analysis of Ras activation in living cells. Proceedings of the National Academy Sciences of the USA 101 (19), 7317–7322. [37] Murase, K., Fujiwara, T., Umemura, Y., Suzuki, K., Iino, R., Yamashita, H., Saito, M., Murakoshi, H., Ritchie, K., Kusumi, A., 2004. Ultrafine membrane compartments for molecular diffusion as revealed by single molecule tech- niques. Biophysical Journal 86 (6), 4075–4093. [38] Normanno, N., De Luca, A., Bianco, C., Strizzi, L., Mancino, M., Maiello, M. R., Carotenuto, A., De Feo, G., Caponigro, F., Salomon, D.S., 2006. Epidermal growth factor receptor (EGFR) signaling in cancer. Gene 366(1), 2–16. [39] Parton, R.G., Hancock, J.F., 2004. Lipid rafts and plasma membrane microorganization: insights from Ras. Trends in Cell Biology 14 (3), 141–147. [40] Pike, L.J., 2003. Lipid rafts: bringing order to chaos. Journal of Lipid Research 44 (4), 655–667. [41] Pribyl, M., Muratov, C.B., Shvartsman, S.Y., 2003. Long-range signal transmission in autocrine relays. Bio- Copyright © 2009 SciRes CANCER  The Role of Reaction Engineering in Cancer Biology: Bio-Imaging Informatics Reveals Implications of the Plasma Membrane Heterogeneities Copyright © 2009 SciRes CANCER 46 physical Journal 84 (2), 883–896. [42] Rees, A. R., Gregoriou, M., Johnson, P., Garland, P. B., 1984. High affinity epidermal growth factor receptors on the surface of A431 cells have restricted lateral diffusion. The EMBO Journal 3, 1843–1847. [43] Reese, J. S., Raimondeau, S., Vlachos, D.G., 2001. Monte Carlo algorithms for complex surface reaction mecha- nisms: efficiency and accuracy. Journal of Computational Physics 173, 302–321. [44] Roy, C. L., Wrana, J. L., 2005. Clathrin- and non-clathrin-mediated endocytic regulation of cell signal- ling. Nature Reviews Molecular Cell Biology 6, 112–126. [45] Sako, Y., Minoghchi, S., Yanagida, T., 2000. Sin- gle-molecule imaging of EGFR signalling on the surface of living cells. Nature Cell Biology 2 (3), 168–172. [46] Scatchard, G., 1949. The attractions of proteins for small molecules and ions. Annals of the New York Academy of Sciences 51 (4), 660–672. [47] Schlessinger, J., 1986. Allosteric regulation of the epi- dermal growth factor receptor kinase. Journal of Cell Bi- ology 103 (6), 2067–2072. [48] Sherrill, J. M., Kyte, J., 1996. Activation of epidermal growth factor receptor by epidermal growth factor. Bio- chemistry 35, 5705–5718. [49] Shvartsman, S. Y., Wiley, H. S., Lauffenburger, D. A., 2004. Epidermal growth factor receptor signaling in tis- sues. IEEE Control Systems Magazine 24 (4), 53–61. [50] Simons, K., Toomre, D., 2000. Lipid rafts and signal transduction. Nature Reviews Molecular Cell Biology 1, 31–39. [51] Singer, S. J., Nicolson, G. L., 1972. Fluid mosaic model of structure of cellmembranes. Science 175 (4023), 720–731. [52] Torney, D. C., McConnell, H. M., 1983. Diffusion-limited reaction theory for two-dimensional systems. Proceedings of the Royal Society of London Series A. 387, 147–170. [53] Vanbelzen, N., Rijken, P. J., Hage, W. J., Delaat, S. W., Verkleij, A. J., Boonstra, J., 1988. Direct visualization and quantitative-analysis of epidermal growth fac- tor-induced receptor clustering. Journal of Cellular Physi- ology 134, 413–420. [54] Vereb, G., Szollosi, J., Matko, J., Nagy, P., Farkas, T., Vigh, L., Matyus, L., Waldmann, T.A., Damjanovich, S., 2003. Dynamic, yet structured: the cell membrane three decades after the Singer–Nicolson model. Proceedings of the National Academy of Sciences of the USA 100 (14), 8053–8058. [55] Verveer, P. J., Wouters, F. S., Reynolds, A. R., Bastiaens, P. I. H., 2000. Quantitative imaging of lateral ErbB1 re- ceptor signal propagation in the plasma membrane. Sci- ence 290 (5496), 1567–1570. [56] Vlachos, D.G., 2005. A review of multiscale analysis: examples from systems biology, materials engineering, and other fluid–surface interacting systems. Advances in Chemical Engineering 30, 1–61. [57] Vlachos, D.G. 2007. Temporal coarse-graining of micro- scopic lattice kinetic Monte Carlo simulations via -leaping, in prepration. [58] Weijer, C.J., 2003. Visualizing signals moving in cells. Science 300, 96–100. [59] Wiley, H.S., 1988. Anomalous binding of epidermal growth factor to A431 cells is due to the effect of high re- ceptor densities and a saturable endocytic system. Journal of Cell Biology 107 (2), 801–810. [60] Wiley, H. S., Shvartsman, S. Y., Lauffenburger, D. A., 2003. Computational modeling of the EGF-receptor sys- tem: a paradigm for systems biology. Trends in Cell Bi- ology 13 (1), 43–50. [61] Wilson, B. S., Steinberg, S. L., Liederman, K., Pfeiffer, J. R., Surviladze, Z., Zhang, J., Samelson, L. E., Yang, L.-h., Kotula, P. G., Oliver, J. M., 2004. Markers for deter- gent-resistant lipid rafts occupy distinct and dynamic do- mains in native membranes. Molecular Biology Cell 15 (6), 2580–2592. [62] Wofsy, C., Goldstein, B., 1992. Interpretation of Scatchard plots for aggregating receptor systems. Mathe- matical Biosciences 112 (1), 115–154. [63] Wofsy, C., Goldstein, B., Lund, K.,Wiley, H., 1992. Im- plications of epidermal growth factor (EGF) induced EGF receptor aggregation. Biophysical Journal 63 (1), 98–110. [64] Woolf, P.J., Linderman, J. J., 2003. Untangling ligand induced activation and desensitization of G-protein-coupled receptors. Biophysical Journal 84 (1), 3–13. [65] Yarden, Y., Sliwkowski, M. X., 2001. Untangling the ErbB signalling network. Nature Reviews Molecular Cell Biology 2, 127–137. [66] Yu, X., Sharma, K. D., Takahashi, T., Iwamoto, R., Mekada, E., 2002. Ligandindependent dimer formation of epidermal growth factor receptor (EGFR) is a step sepa- rable from ligand-induced EGFR signaling. Molecular Biology of the Cell 13 (7), 2547–2557. [67] Zidovetzki, R., Johnson, D. A., Arndt-Jovin, D. J., Jovin, T. M., 1991. Rotational mobility of high-affinity epider- mal growth factor receptors on the surface of living A431 cells. Biochemistry 30, 6162–6166. [68] Ziff, R. M., Gulari, E., Barshad, Y., 1986. Kinetic phase transitions in an irreversible surface-reaction model. Physical Review Letters 56, 2553–2556. |