Paper Menu >>
Journal Menu >>
 Journal of Cancer Therapy, 2009, 1, 28-35 Published Online September 2009 in SciRes (www.SciRP.org/journal/cancer) Regulatory Network Motifs and Hotspots of Cancer Genes in a Mammalian Cellular Signaling Network ABSTRACT Mutations or overexpression of signaling genes can result in cancer development and metastasis. In this study, we manually assembled a human cellular Signaling network and developed a robust bioinformatics strategy for extracting cancer-associated single nucleotide polymorphisms (SNPs) using expressed sequence tags (ESTs). We then investigated the relationshipsof cancer-associated genes [cancer-associated SNP genes, known as cancer genes (CG) and cell mo- bility genes (CMGs)] in a signaling network context. Through a graph-theory-based analysis, we found that CGs are significantly enriched in network hub proteins and cancer-associated genes are significantly enriched or depleted in some particular network motif types. Furthermore, we identified a substantial number of hotspots, the three- and four-node network motifs in which all nodes are either CGs or CMGs. More importantly, we uncovered that CGs are enriched in the convergent target nodes of most network motifs, although CMGs are enriched in the source nodes of most motifs. These results have implications for the foundations of the regulatory mechanisms of cancer development and metastasis. Keywords: background contrast, breast, conformal mesh, microwave imaging. 1. Introduction Cancer cells are characterised by uncontrolled cell grow- th, invasion of surrounding tissues and finally metastasis to distant regions of the human body. Accumulation of genetic mutations in part triggers tumour development and progression. Gene mutation or deregulation also pro- motes cell mobility that is highly correlated with tissue invasion and distant metastasis. A set of gene mutations or overexpressions are closely linked to patient clinical outcomes, suggesting that these genes could be cancer biomarkers for diagnostics. Cells use sophisticated communication between pro- teins to perform a series of tasks such as growth, mainte- nance of cell survival, proliferation and development. Signaling pathways, which are used to transmit biological signals, perform the communication between proteins. Signaling pathways are crucial in maintaining cellular homeostasis and determine cell behaviour. Thus, altera- tions of expression of the genes in cellular signaling pathways could lead to tumour development or promote cell migration. Indeed, alterations to genes that encode signaling proteins are commonly observed in many types of cancers [1–3]. Therefore, recent systematic screenings of mutations have focused on gene families involved in signaling pathways, such as kinases and phosphatases in breast and other cancers [4,5]. These efforts have identified mutations in a variety of genes, including PIK3CA, one of the most commonly mutated oncogenes in human cancers [6–9]. Systematic identification of gene mutations that are involved in signaling pathways and associated with cancer progression and cell mobility has been proven to be useful in finding cancer biomarkers and therapeutic targets [1,10–12]. With the development of automatic DNA sequencing technology, large-scale genome sequencing projects have generated a vast amount of DNA sequence information. Expressed se- quence tag (EST) collections represent partial descrip- tions of transcribed portions of genomes. So far, more than two million high- quality ESTs from human cancer tissues have been posted in the cancer genome anatomy project (CGAP, http:// cgap.nci.nih.gov/) at National Cancer Institute. Bioinformatics analysis of ESTs from normal and cancerous tissues could identify genetic variations associated to cancer. Single nucleotide poly- morphisms (SNPs) are the most common genetic varia- tions in the human genome. More and more experimental evidence shows that some SNPs are closely linked to cancer and treated as genotypic markers [13]. Therefore developing a robust bioinformatics method to identify cancer-associated SNPs and studying them in a cellular context such as cellular signaling would help not only in pinpointing cancer biomarkers but also in providing new Copyright © 2009 SciRes CANCER  Regulatory Network Motifs and Hotspots of Cancer Genes in a Mammalian Cellular Signaling Network Copyright © 2009 SciRes CANCER 29 insights into molecular mechanisms of carcinogenic and metastatic processes. To elucidate the underlying molecular mechanisms of how Signaling gene mutations or overexpression act on tumour development and metastasis, it is necessary to dissect Signaling events that are related to the can- cer-associated genes. Traditionally scientists treat cellular Signaling events in view of biological pathways, study one pathway at a time and then try to gather information from a few pathways together to understand what is go- ing oninside cells. However the proteins, which make up one individual pathway, rarely operate in isolation but ‘cross-talk’ with another pathway’s proteins to process signal information. A network-level view of Signaling events emerges as an important concept. In this study, we first developed a robust bioinformatics strategy to find cancer-associated SNPs by extracting human ESTs of normal and cancer tissues. At the same time, we manu- ally assembled a human cellular Signaling network. We then mapped the integrated cancer-associated genes, which include the SNP genes we identified, known as cancer genes (CGs) and cancer cell mobility genes (CMGs), onto the Signaling network to study their rela- tionships in a Signaling network context. 2. Materials and Methods 2.1 Datasets Used in This Study Human ESTs of normal (1.89 million) and cancer (2.24 million) tissues were downloaded from NCBI dbEST (http://www.ncbi.nlm.nih.gov/dbEST) and CGAP, resp- ectively. As of May 2005, CGAP had 1870 and 3298 normal and cancerous EST libraries, respectively (sup- plementary Table 1, supplementary materials are at htt- p://www.bri. nrc.ca/wang/snp1.html). Protein and mRNA sequences of human genome were downloaded from ftp://ftp.ncbi.nlm. nih.gov/genomes/H_sapiens/pro- tein/ and ftp://ftp.ncbi.nlm. nih.gov/genomes/H_sapiens/RNA/, respectively. We took tumour CMGs from a high-throu- ghput, small RNA-interfering screening of a few cancer cell lines including ovarian carcinoma cell line, SKOV-3 and breast cancer cell line, MDA-231 [14]. The screening identified 532 potential tumour CMGs and a few of these genes were further validated using other experimental analyses such as RT-PCR, additional RNA-interfering and cell invasion assays. We collected known CGs from NCBI Online Mendelian Inheritance in Man database (http://www.ncbi.nlm.nih.gov/entrez/quer-y.fcg i?db=OM IM). 2.2 Signaling Network Construction and Net- work Motif Detection To construct the human cellular Signaling network, we manually curated Signaling pathways from literature. The Signaling data source for our pathways is the BioCarta database (http://www.biocarta.com/genes/allpath- ways.asp), which, so far, is the most comprehensive data- Figure 1 Signaling network motifs for cancer-associated genes base for human cellular signaling pathways. Our curated pathway database recorded gene names and functions, cellular locations of each gene and relationships between genes such as activation, inhibition, translocation, en- zyme digestion, gene transcription and translation, signal stimulation and so on. To ensure the accuracy and the consistency of the database, each referenced pathway was cross-checked by different researchers and finally all the documented pathways were checked by one researcher. In total, 164 Signaling pathways were documented (sup- plementary Table 2).Furthermore, we merged the curated data with another literature-mined human cellular signal- ing network [15]. As a result, the merged network con- tains nearly 1100 proteins (SupplementaryNetworkFile). To construct a Signaling network, we considered rela- tionships of proteins as links (activation or inactivation as directed links and physical interactions in protein com- plexes as neutral links) and proteins as nodes. To detect and extract network motifs, we used mfinder [16]. To obtain statistically significant inference of distributions of the cancer-associated genes in network motifs, re-sampling statistical procedures were used. Briefly, we randomly assigned the same number of the can- cer-associated genes as they are in the real network, re- calculated the distributions of the cancerassociated genes and compared them to the real distributions of the can- cer-associated genes of the network. We repeated the simulation 5000 times and then calculated P values. A detailed description of the network re-sampling proce- dures was described previously [17]. 2.3 SNP Data Mining Strategy To assign ESTs to human genes, we used ESTs to per- form non-gap blast on human mRNA and protein se- quences using BLASTN and BLASTX programs [18]. E-score cutoff was 1 10220. In each blast, the matched ESTs to genes and proteins were obtained. If an EST has the best match to a certain gene and also to the gene’s coding protein, we assigned the EST to the gene. Other- wise we discarded the EST. We picked up the ESTs that were aligned and assigned to the genes in the network. We observed that some sequencing errors occurred within 100–150 bps of the end-sequence region of the ESTs; thus, we removed 200 bps from the end-sequence 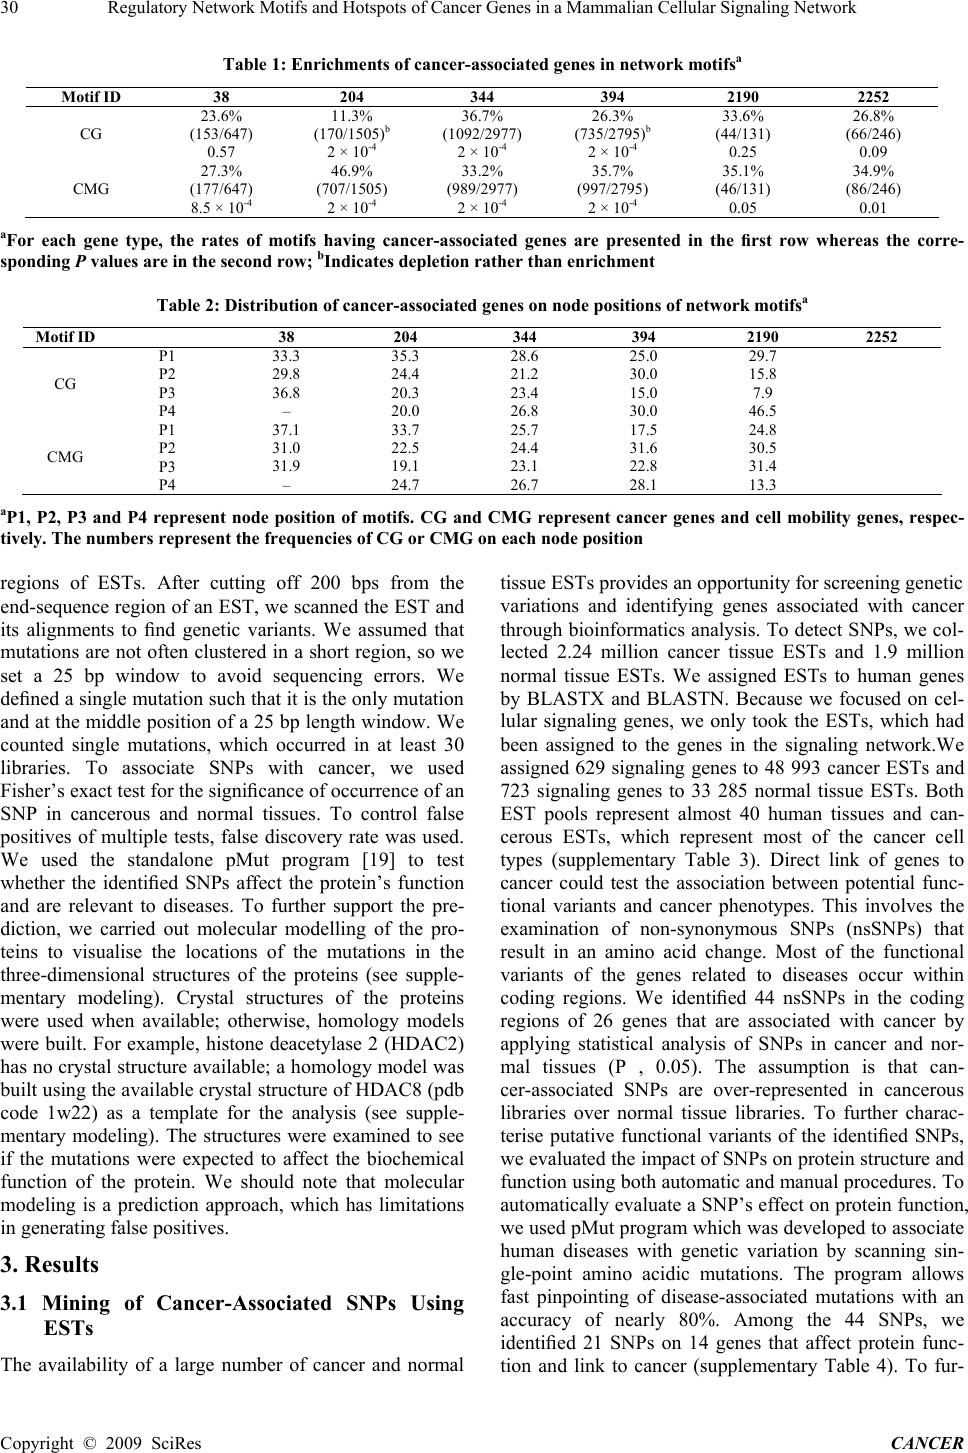 Regulatory Network Motifs and Hotspots of Cancer Genes in a Mammalian Cellular Signaling Network 30 Table 1: Enrichments of cancer-associated genes in network motifsa Motif ID 38 204 344 394 2190 2252 CG 23.6% (153/647) 0.57 11.3% (170/1505)b 2 × 10⁻⁴ 36.7% (1092/2977) 2 × 10⁻⁴ 26.3% (735/2795)b 2 × 10⁻⁴ 33.6% (44/131) 0.25 26.8% (66/246) 0.09 CMG 27.3% (177/647) 8.5 × 10⁻⁴ 46.9% (707/1505) 2 × 10⁻⁴ 33.2% (989/2977) 2 × 10⁻⁴ 35.7% (997/2795) 2 × 10⁻⁴ 35.1% (46/131) 0.05 34.9% (86/246) 0.01 aFor each gene type, the rates of motifs having cancer-associated genes are presented in the first row whereas the corre- sponding P values are in the second row; bIndicates depletion rather than enrichment Table 2: Distribution of cancer-associated genes on node positions of network motifsa Motif ID 38 204 344 394 2190 2252 CG P1 P2 P3 P4 33.3 29.8 36.8 – 35.3 24.4 20.3 20.0 28.6 21.2 23.4 26.8 25.0 30.0 15.0 30.0 29.7 15.8 7.9 46.5 CMG P1 P2 P3 P4 37.1 31.0 31.9 – 33.7 22.5 19.1 24.7 25.7 24.4 23.1 26.7 17.5 31.6 22.8 28.1 24.8 30.5 31.4 13.3 aP1, P2, P3 and P4 represent node position of motifs. CG and CMG represent cancer genes and cell mobility genes, respec- tively. The numbers represent the frequencies of CG or CMG on each node position regions of ESTs. After cutting off 200 bps from the end-sequence region of an EST, we scanned the EST and its alignments to find genetic variants. We assumed that mutations are not often clustered in a short region, so we set a 25 bp window to avoid sequencing errors. We defined a single mutation such that it is the only mutation and at the middle position of a 25 bp length window. We counted single mutations, which occurred in at least 30 libraries. To associate SNPs with cancer, we used Fisher’s exact test for the significance of occurrence of an SNP in cancerous and normal tissues. To control false positives of multiple tests, false discovery rate was used. We used the standalone pMut program [19] to test whether the identified SNPs affect the protein’s function and are relevant to diseases. To further support the pre- diction, we carried out molecular modelling of the pro- teins to visualise the locations of the mutations in the three-dimensional structures of the proteins (see supple- mentary modeling). Crystal structures of the proteins were used when available; otherwise, homology models were built. For example, histone deacetylase 2 (HDAC2) has no crystal structure available; a homology model was built using the available crystal structure of HDAC8 (pdb code 1w22) as a template for the analysis (see supple- mentary modeling). The structures were examined to see if the mutations were expected to affect the biochemical function of the protein. We should note that molecular modeling is a prediction approach, which has limitations in generating false positives. 3. Results 3.1 Mining of Cancer-Associated SNPs Using ESTs The availability of a large number of cancer and normal tissue ESTs provides an opportunity for screening genetic variations and identifying genes associated with cancer through bioinformatics analysis. To detect SNPs, we col- lected 2.24 million cancer tissue ESTs and 1.9 million normal tissue ESTs. We assigned ESTs to human genes by BLASTX and BLASTN. Because we focused on cel- lular signaling genes, we only took the ESTs, which had been assigned to the genes in the signaling network.We assigned 629 signaling genes to 48 993 cancer ESTs and 723 signaling genes to 33 285 normal tissue ESTs. Both EST pools represent almost 40 human tissues and can- cerous ESTs, which represent most of the cancer cell types (supplementary Table 3). Direct link of genes to cancer could test the association between potential func- tional variants and cancer phenotypes. This involves the examination of non-synonymous SNPs (nsSNPs) that result in an amino acid change. Most of the functional variants of the genes related to diseases occur within coding regions. We identified 44 nsSNPs in the coding regions of 26 genes that are associated with cancer by applying statistical analysis of SNPs in cancer and nor- mal tissues (P , 0.05). The assumption is that can- cer-associated SNPs are over-represented in cancerous libraries over normal tissue libraries. To further charac- terise putative functional variants of the identified SNPs, we evaluated the impact of SNPs on protein structure and function using both automatic and manual procedures. To automatically evaluate a SNP’s effect on protein function, we used pMut program which was developed to associate human diseases with genetic variation by scanning sin- gle-point amino acidic mutations. The program allows fast pinpointing of disease-associated mutations with an accuracy of nearly 80%. Among the 44 SNPs, we identified 21 SNPs on 14 genes that affect protein func- tion and link to cancer (supplementary Table 4). To fur- Copyright © 2009 SciRes CANCER  Regulatory Network Motifs and Hotspots of Cancer Genes in a Mammalian Cellular Signaling Network 31 ther confirm pMut predictions, we manually examined the SNPs by structural study of available crystal struc- tures and generating homology models of the proteins. For example, SNPs in HDAC2 and NFkB might cause structural changes affecting biochemical function or pro- tein stability (supplementary modelling). Among the identified 14 genes which have can- cer-associated SNPs, four of them have been found to bear cancer-related mutations: the transmembrane protein tyrosine kinase ERBB2, HDAC2, histone acetyltrans- ferase (HAT) P300/CBP, the NFkB/Rel family of tran- script factor RelA and the α subunit of the stimulatory G protein (GaS) are related with different types of cancers. HDACs and HATs are enzymes that catalyse the deace- tylation and acetylation of lysine residues located in the N-terminal tails of histones and non-histone proteins. Emerging evidence demonstrates that perturbation of this balance is often observed in human cancers, and inhibi- tion of HDACs is considered to be among the most promising novel therapeutic strategies against cancer. The role of P300 as a tumour suppressor was first dem- onstrated as it was identified as an adenoviral E1A-binding protein. In breast and colon cancers, P300 expression is extremely low [20,21]. The discovery of SNPs of these proteins in this study indicates that ex- tracting from EST datasets is a powerful tool for finding gene mutations in cancer cells. 3.2 Distribution of Cancer-Associated Genes in the Network To obtain insights into the molecular mechanisms of how gene mutations or deregulations act on tumour develop- ment in a cellular Signaling network context, we studied the relationships of cancer-associated genes in a Signal- ing network. To do so, we first manually curated human cellular Signaling information from literature and then merged the data with another literature-mined human Signaling network. Most of these pathways represent central Signaling events in cells. Therefore the network could be seen as a general signal information centre in cells. The network is presented as a graph with directed and neutral links, in which, nodes represent proteins, di- rected links represent activating and inhibitory relations and neutral links represent only physical interactions be- tween proteins. To study the relationships of can- cer-as-sociated genes on the cellular Signaling network, we first combined the known CGs and the cancer SNP genes we identified into a set called CGs. We defined the CGs and the 532 genome-wide RNAi screened cancer CMGs as cancer-associated genes and then mapped these genes onto the network. Ninety-five CGs and 87 CMGs were mapped onto the network. We first asked if the CGs and the CMGs are network hub proteins which have many more links than other proteins in the network. We ranked network proteins based on their link numbers and then defined the hub pro- teins as the top 15% of highly linked proteins. We found that 22% (P = 0.02) and 17% (P = 0.23) of hub proteins are CGs and CMGs, respec- tively. These results suggest that CGs but not CMGs are enriched in hub proteins. Hub proteins are the function- ally important nodes shared by many signaling pathways. Therefore mutations or deregulations of these hub genes may lead to cancer. To discover the distribution of can- cer-associated genes in the network, we divided the net- work proteins into three groups based on the cellular lo- cation of the proteins and signal information flow: ligand-receptor, intracellular components and nuclear proteins. We calculated the fractions of the CGs and the CMGs in each region. We found that downstream net- work regions are significantly enriched with CGs (P < 2 × 10⁻⁴ ): 7.9%, 9.2% and 18.1% in network ligand-receptor, intracellular components and nucleus, respectively, in contrast to 8.6%, the average rate of the CGs of the net- work proteins. This fact suggests that CGs are more en- riched in network downstream proteins. On the other hand, CMGs have no significant enrichment in any re- gion. 3.3 Regulatory Network Motifs of Cancer-Associated Genes Cancer-associated genes One way to study a complex system is to break down the system into sub-systems that are independently functional units. Biological networks can be decomposed into statistically over-represented subgraphs, which appear recurrently in networks and are called network motifs [22]. A network motif is a group of interacting components capable of signal processing and also known as regulatory loops in biology. Network mo- tifs have been shown to have distinct regulatory functions and are robust to resistant internal noise. Integration of commonly accessible data types such as protein interac- tion, gene expression profiles and gene ortho logues onto networks has revealed insights into network motif usages in different cellular conditions [23–25].We have inte- grated a dataset of genome-wide mRNA decay rates onto gene regulatory network motifs and revealed the design principles of gene regulatory network motifs [17]. Fur- thermore, the integrative analysis of interactions between microRNAs and a human cellular Signaling network re- vealed the microRNA regulation principles of the signal- ing network [26]. Therefore integration of cancer-assoc- iated genes onto Signaling network motifs would help to understand the regulatory mechanisms of how cancer-as- sociated genes work on cancer development and metasta- sis. To this end, we first identified all the three- and four-node motifs in the network. We are interested in cellular regulation of cancer-associated genes. Therefore we only picked up the motifs in which all the links are directed. Using this criterion, we found three- and four-node statistically significant motifs with the follow- ing motif IDs (mIDs): 38, 204, 344, 394, 2190 and 2252 (Figure 1). We identified all the members of each motif type and mapped cancer-associated genes to them. We defined a motif rate. As the number of motifs having the CGs or the CMGs of the motif type divided by the total number of the mo- Copyright © 2009 SciRes CANCER  Regulatory Network Motifs and Hotspots of Cancer Genes in a Mammalian Cellular Signaling Network 32 tifs of that type. We found that CMGs and CGs are significantly enriched in some particular motif types (Ta- ble 1), suggesting that perturbation of motif genes has more chance to lead to cancer and metastasis. Notably, CGs are not significantly enriched in mIDs 204 and 394 motifs, suggesting that these motifs may buffer gene mu- tations that prevent cancer development. These results also hint that carefully studying the relationships of can- cer-associated genes on network motifs will lead to un- cover the regulatory mechanisms of cancer-associated genes. Therefore we further examined the distribution of cancer-associated genes on node positions for each motif type (Table 2). CMGs are enriched in source nodes in most of the motif types, whereas CGs are enriched in the convergent nodes which are the target nodes receiving signals from two or more source nodes in most of motif types except the two less CG enriched motif types (Table 2). These results indicate different regulatory mecha- nisms between cancer development and metastasis. Therefore we inquired whether the CGs and the CMGs share some regulatory network motifs. If a motif contains both CGs and CMGs, we counted this motif as shared motifs. We found that only a few shared motifs, indicat- ing that CGs and CMGs avoid sharing motifs. This result is consistent with our observation that CGs and CMGs use distinct motifs and regulatory mechanisms. We fur- ther speculated about whether some cancer-associated genes are clustered in the network and become hotspots. If all the nodes of a motif are the CGs or the CMGs, we called this motif as a CG or CMG hotspot, which indi- cates the vital role of this motif in cancer development or metastasis. We identified 11 three-node and 9 four-node motifs for CGs and 2 three-node motifs and 10 four-node motifs for CMGs. Statistical analyses showed that all these hotspots are not expected by chance ( P < 2 × 10⁻⁴ ). These results suggest that some network regions or regu- latory network motifs are critical to induce cancer or me- tastasis and these genes may work together to govern cell behaviours. These hotspots are potentially biomarker clusters or drug target clusters for curing cancer. 4. Discussion Cells use Signaling networks to communicate between and within cells to control many cellular processes. Bio- chemical Signaling events, such as phosphorylation, ace- tylation, ubiquitylation, proteolytic cleavage and so on, are known to have mechanisms of activating or inacti- vating Signaling proteins. The relationships among Sig- naling proteins are thought to determine cell behaviour; therefore mutations or overexpression of Signaling genes will affect Signaling relationships of proteins [1,3]. Map- ping the cancer-associated genes onto a Signaling net- work could uncover mechanisms of initiation, prolifera- tion, survival, mobility and invasion of cancer cells. In this study, we mapped the cancer-associated genes onto the Signaling network and found that CGs are enriched in hub proteins and cancer-associated genes are enriched or less enriched in some particular network motifs; further- more, CGs and CMGs are enriched in the target and source nodes, respectively. In addition, we manually cu- rated a human cellular signaling network, which, thus far, is the largest constructed cellular signaling network, and developed a strategy to extract cancer-associated SNPs from ESTs of normal and cancer tissues. 4.1 Mining of Cancer-Associated SNPs Genome sequence data including cancerous ESTs in- crease as novel and cheaper DNA sequencing techniques are rapidly developing. We developed a more robust method to extract cancer-associated SNPs using ESTs. Compared to other reports [27], we paid more attention on controlling false positives and sequencing errors.We assigned the ESTs to genes by performing BLASTX and BLASTN to not only gene sequences but also the protein sequences. If an EST matches both a gene and its protein sequences, we assigned that EST to the gene. This could reduce the chance of wrong gene assignment of ESTs. ESTs are known as one-pass, partial sequences of cDNAs; therefore more sequencing errors appear in the end-se- quencing regions. To control sequencing errors, we cut off 200 bps from the end sequencing region of ESTs; furthermore, we defined a single mutation such that it is the only mutation and at the middle position of a 25 bp length window. We also used automatic (pMut program) and protein molecular modeling techniques to examine the potential impacts of SNPs on protein structure and function. By doing so, we could remove almost half of the insignificant SNPs that could not relate to cancer. Literature validation of the identified cancer-associated SNPs showed that almost 30% of known CG mutations are included in our list. For example, among the can- cer-associated SNP genes we discovered, four of them have been found to bear cancer-related mutations: ERBB2, HDAC2, P300/CBP and RelA. Our method hel- ps reducing false positives; however, it also loses true cancer-associated SNPs. Furthermore, by combining SNP discovery, protein structural studies and molecular mod- eling would help finding out cancer-associated SNPs. Nevertheless, our major goal here is to find can- cer-associated SNP genes and integrate them with other types of data onto a signaling network. 4.2 Network Motifs of Cancer-Associated Genes Cellular signal information flow initiates from extracel- lular space, a ligand binds to a cellular membrane recep- tor to start the signal, which is then transmitted by intra- cellular Signaling components in cytosol and finally reaches the Signaling components in the nucleus. In the process of signal transduction, mutated genes may result in tumourgenesis and increased cell mobility and inva- sion. We found that CGs are enriched in hub proteins which are the information processing centres for different Signaling pathways. A few examples of such cancer hub genes can be found in the network: P53, PIK3CA, Ras, who have many regulatory partners in the network and have potentials in integrating multiple upstream signals Copyright © 2009 SciRes CANCER  Regulatory Network Motifs and Hotspots of Cancer Genes in a Mammalian Cellular Signaling Network 33 and diverge many downstream signals [28–30]. This re- sult suggests that mutation or deregulation of hub pro- teins in Signaling networks could leadcells to a wrong state and promote cancer development. Furthermore, we found that CGs are enriched in down-stream regions of the Signaling network, especially in the nucleus. This finding supports the notion that downstream network components determine cell behaviour and evoke biologi- cal responses whereas upstream network components maintain homeostasis. Previously we showed that mi- croRNA, a small, non-coding RNA also predominately regulates downstream components of the human singling network [26]. A substantial amount of microRNAs has been reported to be associated with cancer [31]. Taken together, one of the mechanisms of cancer development and progression might be associated with microRNA’s regulation of Signaling network downstream proteins. Errors in signal transduction lead to wrong develop- ment and behavioural decisions and sometimes result in uncontrolled growth or cancer. Signaling gene mutation or overexpression often results in signal transduction errors. To understand how mutations and overexpression of cancer-associated genes induce cancer and metastasis in complex cellular Signaling networks, it is useful to identify the simplest units of commonly used network architecture. These simple units, or network motifs, such as switches [32], gates [33], positive or negative feedback loops [34] provide specific regulatory capacities and de- code signal strength and process information. Both theo- retical and experimental studies have shown that network motifs bear particular kinetic properties that determine the temporal program of gene expression [35]. These motifs can be self-assembled into networks that help ex- plaining how a complex regulatory network program is regulated [17]. Therefore the frequencies and types of network motifs with which cells use reveal the regulatory strategies that are selected in different cellular conditions [17, 36]. For example, FFLs are buffers that respond only to persistent input signals [37] and are suited for en- dogenous conditions, although the motifs whose key regulator’s transcripts have fast decay rates are preferen- tially used for exogenous conditions [17]. Therefore one starting point in the study of cancer Signaling networks might be to characterise how cancer-associated genes are distributed in the regulatory network motifs of the Sig- naling network. Our results showed that can- cer-associated genes are enriched in some particular net- work motif types. This fact suggests that regulatory net- work motifs are critical for cancer development and me- tastasis. On the other hand, we found that CGs are not significantly enriched in two motif types, suggesting that these motifs provide a buffer mechanism for gene muta- tions, alternatively, suggesting that for some motif types having only one gene mutation is not sufficient to induce cancer. Indeed, we found that 11 and 2 three-node motifs (hotspots) in which all nodes are CGs and CMGs, respec- tively. We also identified nine and ten four-node motif hotspots of CGs and CMGs, respectively. These results suggest that some regulatory network motifs and network regions are important for cancer and metastasis develop- ment. The hotspots are also potentially biomarker clusters or anticancer drug target clusters. We further examined the frequencies of cancer-associated genes on node posi- tions of each motif. Interestingly, we found that CGs are enriched on the target nodes of most motifs, especially, the convergent target nodes that receive signal informa- tion consolidated from two or more source nodes. This character hints that the convergent nodes of the CG-enriched motifs are critical nodes that might be sufficient to activate other network nodes and then induce cancer development. In the CG-enriched motifs, source nodes activate the same Signaling target node. It may suggest that the source nodes could trigger the critical nodes (the convergent target nodes) for cancer develop- ment. Signaling networks govern homeostasis or promo- tion of cellular state changes. In Signaling networks, multiple information flows could be convergent to pro- duce a limited set of phenotypic responses [38]. The convergence provides redundant cellular functions and robustness. Critical signal-ling nodes fall into two cate- gories in the network: those that preserve homeostasis during perturbation and those that evoke phenotypic changes. Taken together, the convergent nodes in the CG-enriched motifs could be the key regulators for pre- serving homeostasis. Therefore perturbation of these nodes would lead to losing cellular homeostasis and in- ducing cancer. On the other hand, the source nodes of the CMG-enriched motifs are the critical nodes for evoking phenotypic changes. These data suggest that regulatory mechanisms for cancer development and metastasis are different. In conclusion, we developed an approach to study the relationships of these cancer-associated genes in a Sig- naling network context. We found that CGs are enriched in hub proteins, and that cancer-associated genes are significantly enriched or depleted in some particular net- work motif types. More importantly, we uncovered that CGs are enriched in the convergent target nodes of most motifs, although CMGs are enriched in the source nodes of motifs. These results have implications for under- standing the regulatory mechanisms of cancer develop- ment and metastasis. 5. Acknowledgments We thank H. Hogue for setting up NCBI BLAST on computer cluster environment. This work is partially supported by Genome Health Initiative, Canada. Sup- plementary materials are accessible at http://www.bri.nr- c.ca/wang/snp1.html. REFERENCES [1] Bianco, R.,Melisi, D., Ciardiello, F., and Tortora, G.: ‘Key cancer cell signal transduction pathways as thera- peutic targets’, Eur. J. Cancer, 2006, 42, (3), pp. 290–294 [2] Hanahan, D., and Weinberg, R.A.: ‘The hallmarks of Copyright © 2009 SciRes CANCER  Regulatory Network Motifs and Hotspots of Cancer Genes in a Mammalian Cellular Signaling Network 34 cancer’, Cell, 2000, 100, (1), pp. 57–70 [3] Martin, G.S.: ‘Cell Signaling and cancer’, Cancer Cell, 2003, 4, (3), pp. 167–174 [4] Bardelli, A., and Velculescu, V.E.: ‘Mutational analysis of gene families in human cancer’, Curr. Opin. Genet. Dev., 2005, 15, (1), pp. 5–12 [5] Stephens, P., Edkins, S., Davies, H., Greenman, C., Cox, C., and Hunter, C.: ‘A screen of the complete protein kinase gene family identifies diverse patterns of somatic mutations in human breast cancer’, Nat. Genet., 2005, 37, (6), pp. 590–592 [6] Bachman, K.E., Argani, P., Samuels, Y., Silliman, N., Ptak, J., and Szabo, S.: ‘The PIK3CA gene is mutated with high frequency in human breast cancers’, Cancer Biol. Ther., 2004, 3, (8), pp. 772–775 [7] Broderick, D.K., C, Di, Parrett, T.J., Samuels, Y.R., Cummins, J.M., and McLendon, R.E.: ‘Mutations of PIK3CA in anaplastic oligodendrogliomas, high-grade as- trocytomas, and medulloblastomas’, Cancer Res., 2004, 64, (15), pp. 5048–5050 [8] Samuels, Y., and Velculescu, V.E.: ‘Oncogenic mutations of PIK3CAin human cancers’, Cell Cycle, 2004, 3, (10), pp. 1221–1224 [9] Samuels, Y., Wang, Z., Bardelli, A., Silliman, N., Ptak, J., and Szabo, S.: ‘High frequency of mutations of the PIK3CA gene in human cancers’, Science, 2004, 304, (5670), p. 554 [10] Bild, A.H., Yao, G., Chang, J.T., Wang, Q., Potti, A., and Chasse, D.: ‘Oncogenic pathway signatures in human cancers as a guide to targeted therapies’, Nature, 2006, 439, (7074), pp. 353–357 [11] Huang, E., Ishida, S., Pittman, J., Dressman, H., Bild, A., and Kloos, M.: ‘Gene expression phenotypic models that predict the activity of oncogenic pathways’, Nat. Genet., 2003, 34, (2), pp. 226–230 [12] Downward, J.: ‘Cancer biology: signatures guide drug choice’,Nature, 2006, 439, (7074), pp. 274–275 [13] 13 Bond, G.L., Hu, W., and Levine, A.: ‘A single nucleo- tide polymorphism in the MDM2 gene: from a molecular and cellular explanation to clinical effect’, Cancer Res., 2005, 65, (13), pp. 5481–5484 [14] Collins, C.S., Hong, J., Sapinoso, L., Zhou, Y., Liu, Z., and Micklash, K.: ‘A small interfering RNA screen for modulators of tumor cell motility identifies MAP4K4 as a promigratory kinase’, Proc. Natl. Acad. Sci. USA, 2006, 103, (10), pp. 3775–3780 [15] Ma’ayan, A., Jenkins, S.L., Neves, S., Hasseldine, A., Grace, E., Dubin-Thaler, B., Eungdamrong, N.J., Weng, G., Ram, P.T., Rice, J.J., Kershenbaum, A., Stolovitzky, G.A., Blitzer, R.D., and Iyengar, R.: ‘Formation of regu- latory patterns during signal propagation in a mammalian cellular network’, Science, 2005, 309, pp. 1078–1083 [16] Kashtan, N., Itzkovitz, S., Milo, R., and Alon, U.: ‘Efficient sampling algorithm for estimating subgraph concentrations and detecting network motifs’, Bioinfor- matics, 2004, 20, (11), pp. 1746–1758 [17] Wang, E, and Purisima, E: ‘Network motifs are enriched with transcription factors whose transcripts have short half-lives’, Trends Genet., 2005, 21, pp. 492–495 [18] Altschul, S.F.,Madden, T.L., Schaffer, A.A., Zhang, J., Zhang, Z., and Miller, W.: ‘Gapped BLAST and PSI-BLAST: a new generation of protein database search programs’, Nucleic Acids Res., 1997, 25, [19] , pp. 3389–3402 19 Ferrer-Costa, C., Gelpi, J.L., Zama- kola, L., Parraga, I., de lC, X., and Orozco, M.: ‘PMUT: a web-based tool for the annotation of pathological muta- tions on proteins’, Bioinformatics, 2005, 21, (14), pp. 3176–3178 [20] Iyer, N.G., Ozdag, H., and Caldas, C.: ‘p300/CBP and cancer’, Oncogene, 2004, 23, (24), pp. 4225–4231 [21] Iyer, N.G., Chin, S.F., Ozdag, H., Daigo, Y., Hu, D.E., and Cariati,M.: ‘p300 regulates p53-dependent apoptosis after DNA damage in colorectal cancer cells by modula- tion of PUMA/p21 levels’, Proc. Natl. Acad. Sci. USA, 2004, 101, (19), pp. 7386–7391 [22] Milo, R., Shen-Orr, S., Itzkovitz, S., Kashtan, N., Chklovskii, D., and Alon, U.: ‘Network motifs: simple building blocks of complex networks’, Science, 2002, 298, (5594), pp. 824–827 [23] Han, J.D., Bertin, N., Hao, T., Goldberg, D.S., Berriz, G.F., Zhang, L.V., Dupuy, D., Walhout, A.J.M., Cusick, M.E., Roth, F.P., and Vidal, M.: ‘Evidence for dynami- cally organized modularity in the yeast protein-protein in- teraction network’, Nature, 2004, 430, (6995), pp. 88–93 [24] Luscombe, N.M., Madan Babu, M., Yu, H., Snyder, M., Teichmann, S.A., and Gerstein, M.: ‘Genomic analysis of regulatory network dynamics reveals large topological changes’, Nature, 2004, 431, (7006), pp. 308–312 [25] 25 Zhang, L.V., King, O.D., Wong, S.L., Goldberg, D.S., Tong, A.H.Y., Lesage, G., Andrews, B., Bussey, H., Boone, C., and Roth, F.P.:‘Motifs, themes and thematic maps of an integrated Saccharomyces cerevisiae interac- tion network’, J. Biol., 2005, 4, (2), p. 6 [26] Cui, Q., Yu, Z., Purisima, E.O., and Wang, E.: ‘Principles of microRNA regulation of a human cellular Signaling network’, Mol. Syst. Biol., 2006, 2,p.46 [27] Qiu, P., Wang, L., Kostich, M., Ding, W., Simon, J.S., and Greene, J.R.: ‘Genome wide in silico SNP-tumor as- sociation analysis’, BMC Cancer, 2004, 4,p.4 [28] Oikonomou, E., and Pintzas, A.: ‘Cancer genetics of spo- radic colorectal cancer: BRAF and PI3KCA mutations, their impact on Signaling and novel targeted therapies’, Anticancer Res., 2006, 26, (2A), pp. 1077–1084 [29] Rodriguez-Viciana, P., Tetsu, O., Oda, K., Okada, J., Rauen, K., and McCormick, F.: ‘Cancer targets in the Ras pathway’, Cold Spring Harb. Symp. Quant. Biol., 2005, 70, pp. 461–467 [30] Toledo, F., and Wahl, G.M.: ‘Regulating the p53 pathway: in vitro hypotheses, in vivo veritas’, Nat. Rev. Cancer, 2006, 6, (12),pp. 909–923 [31] Calin, G.A., and Croce, C.M.: ‘MicroRNA-cancer con- nection: the beginning of a new tale’, Cancer Res., 2006, 66, (15), pp. 7390–7394 [32] Bhalla, U.S., Ram, P.T., and Iyengar, R.: ‘MAP kinase phosphatase as a locus of flexibility in a mitogen-activated protein kinase Signaling network’, Science, 2002, 297, (5583), pp. 1018–1023 [33] Blitzer, R.D., Connor, J.H., Brown, G.P., Wong, T., Shenolikar, S., and Iyengar, R.: ‘Gating of CaMKII by cAMP-regulated proteinphosphatase activity during LTP’, Science, 1998, 280, (5371), pp. 1940–1943 [34] Angeli, D., Ferrell, Jr. J.E., and Sontag, E.D.: ‘Detection of multistability, bifurcations, and hysteresis in a large class of biological positive-feedback systems’, Proc. Natl. Acad. Sci. USA, 2004, 101, (7), pp. 1822–1827 [35] Mangan, S., Zaslaver, A., and Alon, U.: ‘The coherent feed- forward loop serves as a sign-sensitive delay element in tran- scriptionnetworks’, J. Mol. Biol., 2003, 334, (2), pp. 197–204 [36] Balazsi, G., Barabasi, A.L., and Oltvai, Z.N.: ‘Topologi- Copyright © 2009 SciRes CANCER  Regulatory Network Motifs and Hotspots of Cancer Genes in a Mammalian Cellular Signaling Network Copyright © 2009 SciRes CANCER 35 cal units ofenvironmental signal processing in the tran- scriptional regulatorynetwork of Escherichia coli’, Proc. Natl. Acad. Sci. USA, 2005,102, (22), pp. 7841–7846 [37] Mangan, S., and Alon, U.: ‘Structure and function of the feed-forwardloop network motif’, Proc. Natl. Acad. Sci. USA, 2003, 100, (21),pp. 11980–11985 [38] Prinz, A.A., Bucher, D., and Marder, E.: ‘Similar network activityfrom disparate circuit parameters’, Nat. Neurosci., 2004, 7, (12),pp. 1345–1352 |