Journal of Environmental Protection
Vol.5 No.8(2014), Article
ID:46823,14
pages
DOI:10.4236/jep.2014.58072
Indoor Air Quality in the United Arab Emirates
William E. Funk1*, Joachim D. Pleil2, Joseph A. Pedit3, Maryanne G. Boundy3, Karin B. Yeatts4, David G. Nash2, Chris B. Trent5, Mohamed El Sadig6, Christopher A. Davidson3, David Leith3
1Department of Preventive Medicine, Feinberg School of Medicine, Northwestern University, Chicago, USA
2US Environmental Protection Agency, Research Triangle Park, USA
3Department of Environmental Sciences and Engineering, Gillings School of Global Public Health, University of North Carolina at Chapel Hill, Chapel Hill, USA
4Department of Epidemiology, Gillings School of Global Public Health, University of North Carolina at Chapel Hill, Chapel Hill, USA
5US Department of Housing and Urban Development, Washington DC, USA
6Department of Community Medicine, Faculty of Medicine and Health Sciences, United Arab Emirates University, Al Ain, UAE
Email: *w-funk@northwestern.edu
Copyright © 2014 by authors and Scientific Research Publishing Inc.
This work is licensed under the Creative Commons Attribution International License (CC BY).
http://creativecommons.org/licenses/by/4.0/


Received 22 April 2014; revised 16 May 2014; accepted 6 June 2014
ABSTRACT
Air quality was measured inside 628 United Arab Emirates (UAE) personal residences. Weekly average concentrations of carbon monoxide (CO), formaldehyde (HCHO), hydrogen sulfide (H2S), nitrogen dioxide (NO2), sulfur dioxide (SO2), and three size fractions of particulate matter (PM2.5, PMc, and PM10) were determined in each home. In a subset of the homes, measurements of outdoor air quality, ultrafine PM concentrations, and elemental PM concentrations were also made. Questionnaires were administered to obtain information on housing demographics and lifestyle habits. Air measurements were performed using simple and cost effective passive samplers. The 90th percentiles of indoor CO, HCHO, H2S, NO2, and SO2 were 1.55 ppm, 0.05 ppm, 0.12 ppm, 0.01 ppm, and 0.05 ppm, respectively. Median indoor PM2.5, PMc, and PM10, concentrations were 5.73 µg/m3, 29.4 µg/m3, and 35.2 µg/m3, respectively. The median indoor concentration of ultrafine PM was 3.62 × 10¹⁰ particles/m3. Indoor/outdoor ratios for PM were 0.44, 0.41, and 0.38 for ultrafine PM, PM2.5, and PM10, respectively. These values fall within the range of other indoor air studies findings conducted in developing countries. Air conditioning, smoking, and attached kitchens were significantly correlated with indoor levels of carbon monoxide. In addition, indoor concentrations of PM2.5 and PM10 were significantly correlated with vehicles parked within five meters of the home, central air conditioning, and having attached kitchens. This is the first robust indoor air quality data set developed for the UAE. This study demonstrates that screening level tools are a good initial step for assessing air quality when logistical issues (distance, language, cultural, training) and intrusion into personal lives need to be minimized.
Keywords:Indoor Air Quality, UAE, Particulate Matter, Pollution, Gases, Sources

1. Introduction
The discovery of vast oil resources in the UAE has enabled its citizens to progress within the past 50 years from a semi-nomadic existence in a harsh desert environment to a thriving lifestyle with vast, ultra-modern facilities and infrastructure. Although these economic and social changes were accompanied by great improvements in public health, concern exists that the rapid modernization may have created some detrimental environmental effects for the population. To study these concerns, the Environment Agency-Abu Dhabi commissioned a multidisciplinary, environmental health project that included epidemiologic [1] , nutritional [2] , and indoor air components. This third section, the environmental component of the study, supported the epidemiology study by characterizing indoor concentrations of gaseous and particulate pollutants in 628 Emirati residences.
Input from 56 environmental health stakeholders in the UAE prioritized environmental risks and interventions based on an expanded WHO burden of disease approach [3] . This effort revealed the leading concerns for mortality risks in the UAE were from exposures to ambient and indoor air pollution. Further, risk assessment analyses estimated that 290 deaths and more than 89,000 health care visits per year in the UAE may be related to exposure to poor indoor air quality. We note that these statistics are similar to those from other developed environments (e.g. New York, USA) and slightly lower than those found for London, UK [4] . However, as infectious diseases are reduced as important factors for human morbidity and mortality in developing countries, the effects on long-term latency diseases from environmental contamination associated with construction, production of goods, availability of private transportation, increases in consumption, etc. become more prominent concerns.
Previous studies in the US and Canada have found that indoor air is a concern because people spend more than 87% of their lives indoors [5] [6] . Emirati citizens may spend an even greater percentage of their time indoors because of high ambient temperatures and cultural factors that may limit outdoor activities. In addition, residential exposures may be of particular concern for vulnerable populations, such as developing fetuses [7] [8] , infants [9] , children [10] [11] , the elderly [12] , the and other susceptible individuals [13] .
Contaminants in the indoor air environment comprise a range of gases from combustion by-products to volatilized organic chemicals. Particulate matter arising from any combustion process [14] , or the ever-present desert sand may also pose potential impacts. This array of pollutants can arise from indoor activities or result from outdoor pollutants that penetrate into the indoor environment. The balance of indoor-outdoor contamination is a function of building tightness, construction materials, local roadway traffic, use and type of cooking appliances, cultural practices, lifestyle habits, and personal activities of the inhabitants.
Among the many health effects that have been linked to indoor air quality, asthma is perhaps the most significant. In the case of Emirati children, their increased prevalence of asthma during the past two decades is thought to be related to indoor air pollutants associated with changes in living habits, the presence of secondhand tobacco smoke in the residence [15] , urbanization [16] , and genetic susceptibility [17] -[19] . Therefore, an assessment of indoor air quality is essential to any overall evaluation of environmental health risks.
This study was designed to acquire representative measurements of indoor pollutants that could be used in association with on-going epidemiologic health evaluations of 628 UAE households. As a complement to one of the largest epidemiology studies in the Arabian Gulf region, a simple, inexpensive assessment of indoor air quality was required. For each home, the average indoor concentration over a one-week period was determined for CO, HCHO, H2S, NO2, SO2, and three size fractions of particulate matter: PM2.5, PMc, and PM10, which refer to particles sized less than 2.5 μm aerodynamic diameter (fine fraction), between 10 and 2.5 μm aerodynamic diameter (coarse fraction), and less than 10 μm aerodynamic diameter, respectively.
Additional particle samples were collected in 14 to 49 homes to evaluate indoor-outdoor pollutant ratios, ultrafine PM concentrations, and elemental PM composition. To complement the air quality measurements, questionnaires were administered in Arabic to selected family members to provide information on housing demographics and lifestyle habits. These data were used to assess health impacts associated with indoor air quality [1] , and to pinpoint potential pollutant sources to inform future remediation efforts.
2. Methods
2.1. Study Design
This study was reviewed and approved by the Institutional Review Boards of the University of North Carolina at Chapel Hill and the UAE University Faculty of Medicine. All informed consents and interviews with the study population were conducted by Arabic-speaking personnel using questionnaires written in Arabic.
The cross-sectional study design employed a nationally representative, stratified random sample of urban and rural Emirati residences from the seven Emirates (Abu Dhabi, Ajman, Dubai, Fujairah, Ras al-Khaimah, Sharjah, and Umm al-Quwain), as described by Yeatts et al. [1] . In brief, these 14 strata (7 Emirates × 2 locales) were divided into primary sampling units consisting of a census enumeration area in the urban areas or a village in rural settings. From the 2008 census data, the UAE Ministry of Economy randomly selected 120 primary sampling units across the country, with each unit containing at least eight Emirati households. Our study teams contacted 827 Emirati households; 628 households agreed to participate, yielding a response rate of 76%.
During the five-month period prior to the start of the study, all sampling equipment, protocols, and questionnaires were piloted in-country and modified as needed. Equipment and supplies were distributed to seven field sites. Field staff were recruited, trained, and tested in all aspects of the study and sampling protocols, including quality assurance and quality control procedures, the data management system, and cultural issues and sensitivities [20] .
Data collection required two home visits that occurred approximately seven days apart. At the first visit, following receipt of informed consent, the air monitoring equipment was deployed in a room where the family members spent a majority of their time together. One week later, the field staff returned to the residence to retrieve and enter data from the sampling equipment and to interview selected family members using a questionnaire format. Questions for the environmental exposure section were developed with guidance from the RIOPA survey [21] and the UAE Health and Lifestyle Survey [22] . Information was obtained on housing characteristics, residential history, potential indoor and outdoor environmental exposures, and behavioral factors such as smoking and incense use.
2.2. Adapting to Practical and Cultural Challenges
The planning and execution of indoor sample collection in this region required our awareness of several challenges unique to this study. First, we needed to accommodate the logistics and distances involved for supply/ resupply of sampling equipment, training of infield personnel, and execution of study objectives (deploying equipment, collecting samples, interpreting meta data, etc.). Secondly, we had to be respectful of cultural restrictions and religious conventions in dealing with the study participants within their own homes. Therefore, initial decisions were made to simplify deployed materials and equipment as much as possible. When studies are performed locally, for example, it is relatively easy to use experienced laboratory personnel as field operators, and to have a quick response for repair, replacement, and operation of complex instrumentation. However, for this study of hundreds of homes distributed across the UAE, the logistics required that in-country personnel assume primary roles of operating the study, and that the shipment of samples to US for analysis was minimized. As such, we opted to use a passive monitoring approach with diffusion tubes that could be read (color change) directly in the field for gas-phase species, and to use miniaturized passive diffusion/settling substrate assemblies that could be analyzed in the US for constituents and sizing of particulate matter.
Intrusions into the home life of study participants are always a concern, and perhaps a bit more complex in an Arab country where gender roles, personal activities (religious observations, smoking, incense use, etc.), athome chores (cooking, cleaning, etc.) are practiced differently than in the US. Therefore, the use of passive and non-intrusive sampling methods became an important feature to minimize such disturbances. Also, the use of long-term passive samplers allowed us to reduce the number of visits to the homes in contrast to active samplers where media are exchanged and flows calibrated typically every 24 hrs.
2.3. Indoor Air Pollutant Measurements—Gaseous Pollutants
A sampling strategy was developed and validated using colorimetric passive diffusion tubes (Gastec Corp., Kanagawa, Japan) to measure low indoor concentrations of CO, HCHO, H2S, NO2, and SO2 for one week [23] . This application contrasts to the conventional use of passive diffusion tubes where industrial concentrations of pollutants are evaluated during an eight-hour work shift.
Prior to use, extensive quality control was performed on random samples from different lots of the diffusion tubes to assess variance within and between lots. In the field, each diffusion tube served as its own blank; any tube that read non-zero prior to deployment was discarded. A second, randomly selected diffusion tube by gas type was deployed in each residence as a duplicate sample. At the conclusion of each seven-day period, all diffusion tubes were read inside the residence by two independent field staff members who compared the exposed tubes to a set of unopened tubes and to a set of laminated photographs that illustrated the proper color changes for each tube type. Results were compared between readers, and a single measurement for each tube type was recorded. Gaseous concentrations were then calculated using pollutant-specific algorithms [23] .
2.4. Indoor Air Pollutant Measurements—Particulate Matter
PM measurements were made using the UNC Passive Aerosol Sampler, which consists of for a scanning electron microscope (SEM) aluminum stub covered by a stainless steel mesh cap [24] . This lightweight (6.5 g) PM sampler is approximately the size of a dime and collects particles by gravitational settling and diffusion. For automated SEM analysis, a polycarbonate substrate was applied to the SEM stub using Electrodag graphite paint; then the mesh cap was immediately placed on the stub to prevent contamination and secured with two small screws. The entire unit was placed in a plastic holder and covered with a clear plastic cap until deployment.
Sampling began with the removal of the plastic cap to expose the passive aerosol sampler to air. Similarly, sampling ended with the replacement of the protective cap. Following deployment, the exposed samplers and associated blanks were shipped to RJ Lee Group, Inc. (Monroeville, PA) for analysis of PM2.5, PMc, and PM10 using computer-controlled scanning electron microscopy (CCSEM), an automated imaging system that detects and counts particle with diameters greater than 0.1 µm. This information was used to determine the concentration and size distribution of PM in each sample.
Elemental analysis was conducted on passive PM samplers in 13 residences where indoor and outdoor samplers were deployed. For these samplers, energy dispersive spectroscopy was used to determine the elemental composition of the collected aerosol particles in each size fraction. Data were obtained for 19 elements: aluminum (Al), barium (Ba), calcium (Ca), carbon (C), chlorine (Cl), chromium (Cr), copper (Cu), iron (Fe), lead (Pb), magnesium (Mg), manganese (Mn), nickel (Ni), phosphorus (P), silicon (Si), sodium (Na), sulfur (S), titanium (Ti), and zinc (Zn).
Ultrafine PM was measured in 24 homes using the same passive aerosol sampler with a Pelco Formvar Carbon Type-B grid (Ted Pella, Inc., Redding, California) [25] . These ultrafine PM samples were analyzed at the UNC using field emission scanning electron microscopy operated at 125 kX. The analysis allowed particle number concentrations for ultrafine PM to be determined for each sample.
Quality assurance and quality control procedures were implemented for the PM aerosol samplers and followed throughout the study. In five percent of randomly selected homes, duplicate PM samplers were deployed to determine the precision of the method. Blanks were also deployed in five percent of randomly selected residences; protective caps were not removed from these samplers. Similarly, duplicate and blank ultrafine samplers were deployed in five percent of the residences. Chain of custody was established to document the distribution, retrieval, shipment, and analysis of all PM samplers.
2.5. Deployment of Samples
For the indoor environment, high-density polyethylene sampling blocks (9 cm × 30 cm × 2 cm) were designed and built to hold seven passive diffusion tubes and four passive aerosol samplers with their protective caps. To prevent tampering or injury from the glass diffusion tubes, each block was fitted with a stainless steel cage that was secured to a modified surveyor’s tripod at a height of 1.3 meters above the ground. The tripod assembly was placed in a common room where family members spent the most time.
Outdoor passive PM samplers were deployed using a shelter of flat plates designed by Ott and Peters [26] to control air flow above the aerosol samplers and to protect them from weather. The flat plate shelter was adapted with extension screws to permit attachment of a circular polyethylene base (d = 10.2 cm) that held seven passive diffusion tubes. A 10 cm × 34 cm solar shield (Clear Dome Solar, San Diego, CA) was placed around the base to shield the diffusion tubes from direct sunlight. The shelter and base were also secured to a modified surveyor’s tripod at a height of 1.3 meters above the ground and placed in a protected fenced-in area or courtyard. The tripod was weighted to prevent toppling.
All airborne pollutants were sampled for one week. For pollutant gases, sampling began by snapping off the top section of the passive diffusion tube at the designated scored mark. The sealed end of each glass tube was then inserted into its labeled position on the sampling block. Similarly, for the passive aerosol sampler, removal of the protective cap and insertion of the sampler into position on the block or in the shelter constituted the start of the sampling period. Dates and times were recorded at the start and end of the sampling period.
2.6. Statistical Analyses
Indoor air pollution concentration means, medians, standard deviations, etc., were calculated using JMP software (JMP version 10, SAS Institute Inc., Cary, NC USA). Certain calculations of log-normal parameters were conducted using MS Excel (Excel: Mac 2011, Version 14.1.0, Redmond, WA, USA); some graphics were constructed using Graph Pad Prism (Prism 5: OS-X, 5.0c, La Jolla, CA, USA).
Associations between indoor air concentrations and environmental questionnaire data, such as second-hand smoke, air conditioning, etc., were examined using one-sided t-tests. Because of the explorative nature of these analyses, corrections for multiple testing were not performed.
3. Results
3.1. Duplicate and Blank Samples
Duplicate passive diffusion tubes that were deployed in 16% - 20% of homes for each gaseous pollutant had average relative standard deviations of 11%, 5%, 5%, 4%, and 8% for CO, HCHO, H2S, NO2, and SO2, respectively.
For the PM passive samplers, no particles were detected on the blank samplers. The averages of the relative standard deviations for the 33 duplicate PM samples were 20%, 16%, and 15% for PM2.5, PMc, and PM10, respectively. In examining the precision of these duplicate pairs, Arashiro and Leith (2013) found precision increased with higher PM concentrations due to better counting statistics. Although the passive sampler is not an EPA reference method, the precision of this device is close to the coefficient of variation of 10% set by the US EPA for operational precision.
3.2. Indoor Air Quality
Table 1 provides the median and 90th percentile indoor concentrations of the air pollutants. The table also shows the percentage of homes where the concentration of a pollutant was below the limit of quantification for the

Table 1 . Air pollutants measured indoors in the UAE.
*Approximate level of quantification.
monitors used in this study. Because these measurements represent seven-day average concentrations made with screening-level devices, these measurements should be interpreted with caution when comparing results to international air quality standards based on short-term (1-hr), work-day (8-hr), or 24-hr timeframes. However, relative pollutant concentrations were used along with environmental questionnaire data to pinpoint potential sources of pollutants, and along with associated health questionnaires to evaluate potential health risks [1] . Ratios of indoor and outdoor concentrations were also examined for general trends, such as differences across rural versus urban locations.
3.3. Gaseous Pollutants
Table 1 shows that indoor concentrations of gaseous pollutants were mostly below the limit of quantification with the exception of CO. However, detectable concentrations of HCHO, H2S, NO2, and SO2 were measured inside 35, 17, 16, and 38 percent of homes, respectively. Measurable levels of CO were present in all homes with a median indoor concentration of 0.76 ppm, and because CO is readily formed during indoor combustion processes (e.g., cooking, incense burning, and cigarette smoking), it was used as a general indicator for evaluating indoor combustion sources. Potential sources of CO from the environmental questionnaires show that split air conditioning, smoking, and attached kitchens were all significantly correlated with indoor levels of CO (Table 2). Split system air conditioning was found in 17% of the homes in our study and refers to a ductless system consisting of an outdoor condenser/compressor unit, an indoor wall-mounted unit with the air handler, and a remote control. Such a system allows cooling of individual rooms rather than an entire floor. Attached kitchens refer to the placement of the cooking area within the home, as is most common within the western world. Whereas the norm in the UAE was an “unattached kitchen” found in 69% homes, where food was prepared in a separate structure and brought to the residence at mealtimes. Outdoor construction within 100 meters of the home, vehicles parked within 5 meters of the home, open windows, portable heaters, use of natural gas in attached kitchens, and use of incense were not significantly associated with indoor concentrations of CO (p > 0.05).
Indoor and outdoor concentrations of gaseous pollutants measured in 49 homes showed that concentrations of CO were similar in both environments (Table 3). The median indoor/outdoor ratio was 0.95, which indicates that CO was higher outdoors than indoors. Higher concentrations of CO were also found in urban homes compared to rural residences for both indoor and outdoor samples (Table 4).
Table 2. Questionnaire variables as predictors of indoor air concentrations of CO, PM2.5, and PM10.
*One-sided t-tests comparing air concentrations with and without the presence of questionnaire variables. p-values less than 0.05 confirms that “yes” is significantly greater than “no” responses. p-values greater than 0.95 confirms that “yes” is significantly less than “no” responses.
Table 3. Air pollutants measured indoors and outdoors in paired homes.
*Approximate level of quantification.
Table 4. Air pollutants measured indoors in rural and urban locations in the UAE.
*Approximate level of quantification.
3.4. Particulate Matter
In the 39 homes where PM was measured both indoors and outdoors the median indoor concentrations of PM2.5, PMc, and PM10 were 6.34 μg/m3, 31.1 μg/m3, and 36.6 μg/m3, respectively (Table 3).
Indoor concentrations of PM2.5 and PM10 were highly correlated, with a Pearson R = 0.84. The median outdoor concentrations of PM2.5, PMc, and PM10 were 15.4 μg/m3, 79.7 μg/m3, and 96.8 μg/m3, respectively. Concentrations of particles were lower indoors than outdoors; the ratios of the indoor to outdoor median PM2.5, PMc, and PM10 concentrations in these 39 paired samples were 0.41, 0.39, and 0.38, respectively. Indoor PM concentrations were higher in rural areas than urban locations, but outdoor PM concentration were not significantly different between rural and urban locations (Table 4).
Potential indoor sources of PM were investigated using environmental questionnaires to assess associations between indoor PM concentrations and questionnaire variables (Table 2). Indoor concentrations of PM2.5 and PM10 were significantly associated with vehicles being parked within five meters of the home, use of central air conditioning, and with kitchens that were located within the residence. Opening of windows, construction within one hundred meters of the house, cooking fuel type, cigarette smoking, and use of incense were not significantly correlated with indoor PM (p > 0.05). However, this lack of association may be due in part to the polycarbonate substrate used on the UNC Passive Aerosol Samplers, which can underestimate combustion-related (carbonbased) PM. Table 3 presents the 14 residences with paired indoor and outdoor ultrafine PM measurements. Concentrations are reported as the number of particles per unit volume (particles/m3), which is the most standard convention for reporting ultrafine PM. The median concentrations of ultrafine PM in the indoor and outdoor samples were 2.9 × 10¹⁰ particles/m3 and 6.6 × 10¹⁰ particles/m3, respectively. In the 14 homes with paired indoor and outdoor measurements, the median indoor/outdoor ratio of ultrafine PM was 0.44.
3.5. Elemental Composition
Elemental analysis of the PM samples in Figure 1 shows a higher percentage of carbon was observed indoors, which may reflect indoor combustion sources such as smoking or burning incense. In contrast, the percentage of silicon was higher outdoors, which may reflect a higher prevalence of sand-based particles. Overall, differences for carbon and silicon were small, and indoor and outdoor profiles of the seven most abundant elements were similar, which is suggestive of a common PM source. This finding may be the result of infiltration of outdoor PM into the indoor environment. In addition, Figure 2 shows that chromium, nickel, copper, and zinc concentrations were higher indoors than outdoors, while lead was higher in the outdoor samples. These findings suggest that while infiltration of outdoor air may be a major source of indoor PM, localized sources of PM indoors and outdoors likely exist and provide differing trace-element profiles.

Figure 1. Weight percentages of the seven most abundant elements measured indoors and outdoors in 13 homes in the UAE. Error bars represent the standard deviations of the means.

Figure 2. Weight percentages of eight less abundant elements measured indoors and outdoors in 13 paired homes in the UAE. Error bars represent the standard deviations of the means.
4. Discussion
These results point out the complexity of indoor exposure patterns. While it is not possible to state unequivocally and clearly the causes of all indoor concentrations reported here, this discussion will focus on what can be said, and present a comparison with results of studies of indoor air quality in other parts of the world to place these finding in perspective.
This indoor air quality assessment in the UAE is the largest of its kind in the Middle East region. We evaluated 628 homes within the UAE, successfully collecting hundreds of measurements for five gaseous pollutants (CO, HCHO, H2S, NO2, and SO2) and four size fractions of PM (Ultrafine PM, PM2.5, PMc, and PM10). Our targeted pollutants were selected based on common exposures that occupants in the UAE might encounter from sources such as infiltration of ambient air pollution from nearby industrial activity and traffic, as well as key indoor sources such as tobacco smoking and incense burning.
Indoor Particulate Matter: Detailed Analysis
In Table 5 we compare indoor concentrations of PM2.5 measured in the UAE with other studies throughout different parts of the world. While these comparisons are meant to put the results of this study in context, we note that measurements made in this study were performed with screening-level samplers and that rigorous comparisons with other studies should be done with caution.
One recent study performed by the US EPA of the urban environment of Detroit, Michigan—the Detroit Exposure and Aerosols Research Study (DEARS)—spanned 3 winter and 3 summer seasons from 2004 to 2007 (Williams, 2008). Figure 3(a) shows the frequency distribution of the 628 indoor, week-long PM2.5 measurements made in the UAE regardless of urban vs. rural locations and other meta-data. The figure shows that the data appear lognormal (which is expected for environmental data) and that the geometric mean (GM) and geometric standard deviation (GSD) are 5.79 μg/m3 and 2.33 μg/m3, respectively. Figure 3(b) shows the analogous PM2.5 data from 539 measurements made in 134 urban Detroit homes from the DEARS study selected to represent the summer months of 2004-2006. Figure 3(b) shows the data are also lognormal in character but shifted somewhat higher with geometric mean (GM) and geometric standard deviation (GSD) of 16.24 μg/m3 and 1.88 μg/m3, respectively. Although the UAE homes experienced approximately the same outdoor PM2.5 levels as Detroit, (UAE: GM = 15.4 μg/m3, DEARS: GM = 14.0 μg/m3), their indoor levels were a factor of 2.5 lower (GM = 5.79 μg/m3 vs. 16.2 μg/m3). Detroit is located in the northern part of the midwestern US where most homes were not air conditioned (cooled) in the summer; occupants generally used passive ventilation in the form of fans and open windows, which results in similar indoor and outdoor PM2.5 concentrations. The UAE
Table 5 . Comparison of PM2.5 concentrations in studies conducted in different parts of the world.
Note: The values in this table were estimated from the respective published data summaries and harmonized under the assumption that measurements were log-normally distributed.
 (a)
(a)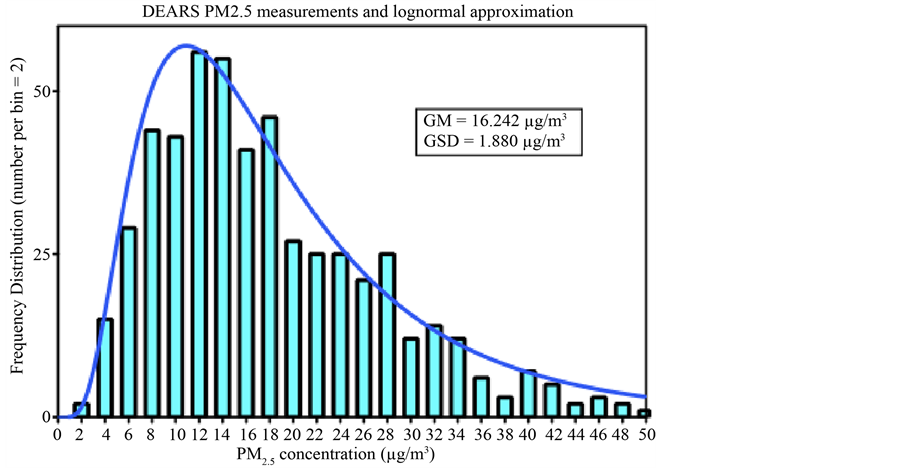 (b)
(b)
Figure 3. (a)/(b) Detailed comparison of distributions and levels of indoor air measurements of PM2.5 in UAE and DEARS residential exposure studies. Both data sets show expected log-normal character; the UAE results are about 2.5 times lower most likely due to differences in ventilation (sealed AC vs. open windows) and differences in cooking (detached vs. attached kitchens).
homes may have been more sealed due to the high ambient temperatures and the ever-present desert climate. UAE homes also tend to have separated kitchens, which further reduces sources of indoor PM2.5.
Indoor air concentrations of CO ranged from 0.13 - 5.8 ppm, with a median value of 0.77 ppm. In homes where both indoor and outdoor measurement were made, the I/O ratio was 0.95, indicating that levels were slightly higher outdoors. This ratio was higher than the I/O ratio observed in a study performed in four sites in Saudi Arabia, which reported an average I/O ratio of 0.63 [27] . In this study, Rowe et al. reported automobile traffic as the major sources of outdoor CO, and cooking with gas stoves, use of kerosene heaters, charcoal burners, waterpipes, and cigarette smoking as the major sources for indoor CO [27] . Similarly, we found smoking and attached kitchens were significantly correlated with indoor levels of CO (Table 2).
We collected paired indoor and outdoor measurements for PM2.5, PMC, and PM10 at 39 homes and calculated an indoor-outdoor ratio (I/O) as an indicator of which environment may be the stronger contributor of PM. In our study, the median I/O ratios were 0.41, 0.39 and 0.38 for PM2.5, PMC, and PM10, respectively. Rural areas had slightly higher median concentrations and wider ranges of concentrations in the upper quartile than urban locations. Potential determinants for this finding may include less development in rural areas to shelter homes from blowing sand and dust, older construction that allows for greater infiltration of ambient air pollution, or possibly different occupant activities and behaviors than in urban locations. Our I/O ratios indicate that generally outdoor PM concentrations exceeded those indoors, although this finding does not negate the contribution of indoor sources of exposures to the health burden of UAE residents.
In the RIOPA study [21] of 306 homes located in Los Angeles, CA; Elizabeth, NJ; and Houston, TX, the authors reported a median I/O for PM2.5 of 0.70, with an interquartile range of 0.54 - 0.87. The RIOPA I/O results are reasonably comparable to those that we obtained from our study; however, it should be noted that the RIOPA study collected their samples continuously over a 48-hr period, while our samples were collected passively and integrated over a 7-day averaging period. The longer averaging time of our samples may tend to smooth out any episodic peak concentrations.
Geller et al. [28] calculated I/O ratios for 13 homes in the southern California desert region during winter and spring when occupants would be more likely to open windows and rely on natural ventilation. Measurements were collected in each home over 3 - 4 consecutive 23-hour periods. The topography and climate trends in this southern California region are comparable to those encountered in the UAE, since our study occurred during late fall, winter, and spring when temperatures in the UAE were more moderate. Geller and colleagues reported median I/O ratios of 0.92 and 0.54 for PM2.5 and PM10, respectively [28] . The median indoor PM2.5 concentration reported by the authors was 4.6 µg/m3 with a range of 0.6 - 20.2 µg/m3, and the median indoor PM10 concentration was 13.5 µg/m3 with a range of 4.2 - 49.3 µg/m3.
We collected paired indoor-outdoor ultrafine PM samples for 14 homes and calculated an I/O ratio of 0.44. Ultrafine particles have a greater propensity to deposit deeper into the lung due to their small size and greater diffusion coefficient, which makes characterizing their contribution to indoor environments critical to understanding indoor air exposures. Ultrafine PM is associated with several ambient and indoor sources, including tobacco smoke and incense, both of which were commonly reported exposure sources in our study. For example, thirty-five percent of men surveyed in our study identified themselves as current smokers, and secondhand smoke exposures were reported by 19% of the heads of households who were surveyed [1] . Furthermore, almost half of the households reported daily incense use and over 80% burned incense in the home at least once a week [1] .
The overall median ultrafine PM number concentration from our study was 3.6 × 10¹⁰ particles/m3. As a comparison, Nazaroff et al. [29] measured ultrafine PM concentration in seven homes in the San Francisco region and reported concentrations ranging from 3.7 × 10⁹ particles/m3 to 2.8 × 10¹⁰ particles/m3. The authors attributed the particles to both ambient and indoor sources, including cooking and furnace use. Afshari et al. [30] conducted a chamber study for ultrafine particles associated with several different activities, including cooking, smoking cigarettes, and candle burning. The authors reported the highest particle number concentration of 2.41 × 10¹¹ particles/m3 when burning a beeswax candle in the chamber. Cigarette smoke resulted in a slightly lower particle concentration of 2.18 × 10¹¹ particles/m3. While we did not find a significant association between PM and waterpipe smoking, indoor air concentrations of ultrafine PM may have been underestimated due to the type of samplers used in our study and warrants further investigation. Waterpipe, or hookah, smoking is gaining popularity around the world and maintains a prominent role in Arabic culture, particularly among younger women who view it as having a less negative stigma than cigarette smoking [31] . Daher et al. [32] stated that pollutant levels in the sidestream (i.e., secondhand) smoke generated from one hookah session lasting one-hour were comparable to the smoking sessions of 2 - 5 cigarette smokers. The authors estimated that four repeated waterpipe sessions resulted in 3.99 × 10¹² particles/waterpipe.
Incense use is another activity firmly grounded in the UAE and Arabic culture that may present exposures of concern to ultrafine PM. An experimental study by See et al. [33] focused on the physical characteristics of four types of incense commonly used by Taoists, Buddhists, Hindus, and Shinto followers. The authors calculated particle number concentrations ranging from 1.1 × 10¹² particles/m3 to 2.4 × 10¹² particles/m3 during incense burning. Our indoor ultrafine PM data reported in Table 1 and Table 3 are within the range of the study data of other researchers, and the activities that are reported to have occurred in our study homes are consistent with those evaluated in these other studies. Nevertheless, the ambient concentrations of ultrafine PM were somewhat elevated in our study, highlighting the importance of additional research in the UAE on this topic to accurately apportion these exposures.
In 14 homes in the UAE, indoor and outdoor elemental composition was examined. The composition profiles for indoor and outdoor samples were similar, which suggests that ambient infiltration may play a role in indoor PM concentrations. Carbon and silicon were identified as the most abundant elements. The presence of carbon inside the home is indicative of a combustion source, possibly from indoor sources such as tobacco smoke or incense. Cooking with natural gas may also be a source for some homes, but it may not be as prominent a source as one would find in the US or Europe because the kitchens of most Emirati homes are located in a separate building (e.g. 69% of homes reported having detached kitchens in this study). Ambient sources of carbon, including automobile exhaust from traffic, may also infiltrate into homes. The higher indoor presence of carbon in urban compared with rural areas may be due to the higher density traffic and lends support to the suggestion of ambient infiltration. Conversely, silicon, which is the primary element in sand, was more abundant in rural PM samples, possibly due to less dense neighborhoods and smaller buildings that permit sand to blow more freely and infiltrate into homes. However, as noted previously, the total concentration of carbon may have been underestimated due to the polycarbonate-coated SEM stubs used in this study, which are less sensitive to carbonaceous particles. This sample media bias may explain the lack of association found between activities such as smoking and burning incense indoors with indoor concentrations of PM.
Several trace metals were also measured including Ti, Cr, Mn, Ni, Cu, Zn, Ba, and Pb. Levels of Cr, Ni, Cu, and Zn were higher for indoor samples than outdoors. Sources of these metals could be of ambient or indoor origin, but additional research is needed to more definitively answer this question. Possible indoor sources include tobacco smoke, incense fumes, or burning candles. Chromium, Ni, Cu and Zn have been identified in cigarette smoke [34] . A recent study in Kuwait also examined the presence of trace metals in indoor air [35] . Although different elements were more prominent in that study, the investigators reported a similar trend to ours with trace metals being generally more abundant in indoor residential environments.
The pollutant concentration patterns reported here are clearly complex, so that definitive, general statements about causative factors cannot be made. What does emerge from this study is an understanding that: (1) concentrations of the indoor pollutant gases measured here were usually, but not always, relatively low (Table 1), (2) relationships exist between indoor concentrations of both gases and PM with lifestyle parameters such as smoking, the type of air conditioning used, and whether the residence has an attached or unattached kitchen (Table 2), (3) concentrations of PM, particularly PM10, could sometimes be relatively high (Table 1), and (4) that one important source of indoor PM appears to be outdoor PM (Figure 1).
5. Conclusion
Our study successfully measured gaseous and PM air concentrations in 628 homes in the UAE as a first step to characterize indoor air quality in this widely understudied region. We found that overall, indoor air quality in UAE residences is quite similar to other developed nations; there were no remarkable outliers other than the slightly higher coarse particulate fraction (PMc), which is likely attributable to the preponderance of sand in the desert environment. The passive sampling strategy developed for this study was minimally-invasive and inexpensive, yet provided reasonable data in comparison with other studies, such as the DEARS by the US EPA in Detroit, MI. This approach will help to facilitate the acceptance and feasibility of additional population-based studies of air quality in other international scenarios where logistics are more challenging. The wealth of data collected during this campaign can be used to develop further research studies to answer questions that have been spawned by these results, including apportionment of exposures, quantifying the contribution of ambient infiltration to indoor pollutant concentrations, levels of personal exposures, and understanding the effect of household activities on their exposures. While the air measurements reported in this study should be interpreted with caution given the screening-level precision of the samplers used, these relative estimations of air quality can successfully be used to evaluate the effects of indoor air pollution on human health [1] , and are a valuable resource for identifying potential sources of airborne pollutants in population-based research.
Acknowledgements
We thank our many collaborators in the UAE who contributed to this study, and the participants who graciously supported this work. We are grateful to the Collaborative Studies Coordinating Center at the University of North Carolina for their statistical assistance. This study was supported by funds from the Environment Agency-Abu Dhabi. This work has been subjected to U.S. Environmental Protection Agency review and approved for publication.
References
- Yeatts, K.B., et al. (2012) Indoor Air Pollutants and Health in the United Arab Emirates. Environmental Health Perspectives, 120, 687-694. http://dx.doi.org/10.1289/ehp.1104090
- Ng, S.W., et al. (2011) Nutrition Transition in the United Arab Emirates. European Journal of Clinical Nutrition, 65, 1328-1337. http://dx.doi.org/10.1038/ejcn.2011.135
- Willis, H.H., et al. (2010) Prioritizing Environmental Health Risks in the UAE. Risk Analysis: An Official Publication of the Society for Risk Analysis, 30, 1842-1856. http://dx.doi.org/10.1111/j.1539-6924.2010.01463.x
- Gibson, J.M. and Farah, Z.S. (2012) Environmental Risks to Public Health in the United Arab Emirates: A Quantitative Assessment and Strategic Plan. Environmental Health Perspectives, 120, 681-686. http://dx.doi.org/10.1289/ehp.1104064
- Klepeis, N.E., et al. (2001) The National Human Activity Pattern Survey (NHAPS): A Resource for Assessing Exposure to Environmental Pollutants. Journal of Exposure Analysis and Environmental Epidemiology, 11, 231-252. http://dx.doi.org/10.1038/sj.jea.7500165
- Leech, J.A., et al. (2002) It’s about Time: A Comparison of Canadian and American Time-Activity Patterns. Journal of Exposure Analysis and Environmental Epidemiology, 12, 427-432. http://dx.doi.org/10.1038/sj.jea.7500244
- Choi, H., et al. (2012) Fetal Window of Vulnerability to Airborne Polycyclic Aromatic Hydrocarbons on Proportional Intrauterine Growth Restriction. PloS One, 7, Article ID: e35464. http://dx.doi.org/10.1371/journal.pone.0035464
- Perera, F.P., et al. (2011) Polycyclic Aromatic Hydrocarbons-Aromatic DNA Adducts in Cord Blood and Behavior Scores in New York City Children. Environmental Health Perspectives, 119, 1176-1181. http://dx.doi.org/10.1289/ehp.1002705
- Pickett, A.R. and Bell, M.L. (2011) Assessment of Indoor Air Pollution in Homes with Infants. International Journal of Environmental Research and Public Health, 8, 4502-4520. http://dx.doi.org/10.3390/ijerph8124502
- Neas, L.M., et al. (1991) Association of Indoor Nitrogen Dioxide with Respiratory Symptoms and Pulmonary Function in Children. American Journal of Epidemiology, 134, 204-219.
- Heinrich, J. (2010) Air Pollution, Asthma and Allergies in Children. Occupational and Environmental Medicine, 67, 290-291. http://dx.doi.org/10.1136/oem.2009.051193
- Simoni, M., et al. (2003) Indoor Air Pollution and Respiratory Health in the Elderly. European Respiratory Journal, 21, 15S-20S. http://dx.doi.org/10.1183/09031936.03.00403603
- Bernstein, J.A., et al. (2008) The Health Effects of Nonindustrial Indoor Air Pollution. Journal of Allergy and Clinical Immunology, 121, 585-591. http://dx.doi.org/10.1016/j.jaci.2007.10.045
- Polidori, A., et al. (2006) Fine Organic Particulate Matter Dominates Indoor-Generated PM2.5 in RIOPA Homes. Journal of Exposure Science & Environmental Epidemiology, 16, 321-331. http://dx.doi.org/10.1038/sj.jes.7500476
- Hassan Mahboub, B.H., et al. (2010) Asthma Insights and Reality in the United Arab Emirates. Annals of Thoracic Medicine, 5, 217-221. http://dx.doi.org/10.4103/1817-1737.69109
- Mahboub, B.H., Al-Hammadi, S., Rafique, M., Sulaiman, N., Pawankar, R., Al Redha, A.I. and Mehta, A.C. (2012) Population Prevalence of Asthma and Its Determinants Based on European Community Respiratory Health Survey in the United Arab Emirates. BMC Pulmonary Medicine, 12, 4. http://dx.doi.org/10.1186/1471-2466-12-4
- Joseph, M., Zoubeidi, T., Al-Dhaheri, S.M., Al-Dhaheri, A.A., Al-Dhaheri, A.A., Al-Kaabi, F.M., Al-Muhairi, S.J. and Joseph, J. (2009) Paternal Asthma Is a Predictor for Childhood Asthma in the Consanguineous Families from the United Arab Emirates. Journal of Asthma, 46, 175-178. http://dx.doi.org/10.1080/02770900802604095
- Alsowaidi, S., Abdulle, A. and Bernsen, R. (2010) Prevalence and Risk Factors of Asthma among Adolescents and Their Parents in Al-Ain (United Arab Emirates). Respiration, 79, 105-111. http://dx.doi.org/10.1159/000219248
- Alsowaidi, S., Abdulle, A., Bernsen, R. and Zuberbier, T. (2010) Allergic Rhinitis and Asthma: A Large Cross-Sectional Study in the United Arab Emirates. International Archives of Allergy and Immunology, 153, 274-279. http://dx.doi.org/10.1159/000314368
- Yeatts, K.B., et al. (2012) Conducting Environmental Health Research in the Arabian Middle East: Lessons Learned and Opportunities. Environmental Health Perspectives, 120, 632-636. http://dx.doi.org/10.1289/ehp.1104031
- Weisel, C.P., et al. (2005) Relationships of Indoor, Outdoor, and Personal Air (RIOPA). Part I. Collection Methods and Descriptive Analyses. Research Report, 130, 1-107; discussion 109-127.
- Badrinath, P., Ghazal-Aswad, S., Parfitt, D. and Osman, N. (2004) Cultural and Ethnic Barriers in Conducting Research. Factors Influencing Menarche in the United Arab Emirates. Saudi Medical Journal, 25, 1626-1630.
- Nash, D.G. and Leith, D. (2010) Use of Passive Diffusion Tubes to Monitor Air Pollutants. Journal of the Air & Waste Management Association, 60, 204-209. http://dx.doi.org/10.3155/1047-3289.60.2.204
- Wagner, J. and Leith, D. (2001) Passive Aerosol Sampler. Part 1: Principle of Operation. Aerosol Sciences and Technology, 34, 186-192. http://dx.doi.org/10.1080/027868201300034808
- Nash, D.G. and Leith, D. (2010) Ultrafine Particle Sampling with the UNC Passive Aerosol Sampler. Aerosol Science and Technology, 44, 1059-1064. http://dx.doi.org/10.1080/02786826.2010.509747
- Ott, D.K. and Peters, T.M. (2008) A Shelter to Protect a Passive Sampler for Coarse Particulate Matter, PM10-2.5. Aerosol Science and Technology, 42, 299-309. http://dx.doi.org/10.1080/02786820802054236
- Rowe, D.R., Aldhowalia, K.H. and Mansour, M.E. (1989) Indoor-Outdoor Carbon-Monoxide Concentrations at 4 Sites in Riyadh, Saudi-Arabia. JAPCA-The Journal of the Air & Waste Management Association, 39, 1100-1102.
- Geller, M.D., Chang, M., Sioutas, C., Ostro, B.D. and Lipsett, M.J. (2002) Indoor/Outdoor Relationship and Chemical Composition of Fine and Coarse Particles in the Southern California Deserts. Atmospheric Environment, 36, 1099-1110.http://dx.doi.org/10.1016/S1352-2310(01)00340-5
- Nazaroff, W.W., Bhangar, S. and Mullen, N. (2010) Ultrafine Particle Concentrations and Exposures in Northern California Houses. Abstracts of Papers of the American Chemical Society, Washington DC, 239.
- Afshari, A., Matson, U. and Ekberg, L.E. (2005) Characterization of Indoor Sources of Fine and Ultrafine Particles: A Study Conducted in a Full-Scale Chamber. Indoor Air, 15, 141-150. http://dx.doi.org/10.1111/j.1600-0668.2005.00332.x
- Nakkash, R.T., Khalil, J. and Afifi, R.A. (2011) The Rise in Narghile (Shisha, Hookah) Waterpipe Tobacco Smoking: A Qualitative Study of Perceptions of Smokers and Non Smokers. BMC Public Health, 11, 315. http://dx.doi.org/10.1186/1471-2458-11-315
- Daher, N., Saleh, R., Jaroudi, E., Sheheitli, H., Badr, T., Sepetdjian, E., Al Rashidi, M., Saliba, N. and Shihadeh, A. (2010) Comparison of Carcinogen, Carbon Monoxide, and Ultrafine Particle Emissions from Narghile Waterpipe and Cigarette Smoking: Sidestream Smoke Measurements and Assessment of Second-Hand Smoke Emission Factors. Atmospheric Environment, 44, 8-14. http://dx.doi.org/10.1016/j.atmosenv.2009.10.004
- See, S.W., Balasubramanian, R. and Joshi, U.M. (2007) Physical Characteristics of Nanoparticles Emitted from Incense Smoke. Science and Technology of Advanced Materials, 8, 25-32. http://dx.doi.org/10.1016/j.stam.2006.11.016
- Bernhard, D., Rossmann, A. and Wick, G. (2005) Metals in Cigarette Smoke. IUBMB Life, 57, 805-809. http://dx.doi.org/10.1080/15216540500459667
- Bu-Olayan, A. and Thomas, B. (2010) Validating Trace Metals Levels in PM2.5 Aerosols from Indoor and Outdoor Polluting Premises. American Journal of Environmental Sciences, 6, 224-229. http://dx.doi.org/10.3844/ajessp.2010.224.229
NOTES

*Corresponding author.