Open Journal of Modelling and Simulation
Vol.03 No.03(2015), Article ID:58018,8 pages
10.4236/ojmsi.2015.33012
Effective Control Strategies on the Transmission Dynamics of a Vector-Borne Disease
Saddam Hossain1, Jannatum Nayeem2, Chandranath Podder3
1BRAC University, Dhaka, Bangladesh
2Ahsanullah Universities of Science and Technology, Dhaka, Bangladesh
3Department of Mathematics, University of Dhaka, Dhaka, Bangladesh
Email: saddam8089@gmail.com, acm.math@gmail.com, cnath_007@yahoo.com
Copyright © 2015 by authors and Scientific Research Publishing Inc.
This work is licensed under the Creative Commons Attribution International License (CC BY).
http://creativecommons.org/licenses/by/4.0/


Received 12 June 2015; accepted 11 July 2015; published 16 July 2015
ABSTRACT
In this paper, we have rigorously analyzed a model to find the effective control strategies on the transmission dynamics of a vector-borne disease. It is proved that the global dynamics of the disease are completely determined by the basic reproduction number. The numerical simulations (using MatLab and Maple) of the model reveal that the precautionary measures at the aquatic and adult stage decrease the number of new cases of dengue virus. Numerical simulation indicates that if we take the precautionary measures seriously then it would be more effective than even giving the treatment to the infected individuals.
Keywords:
Vector-Borne Disease, Dengue, Reproduction Number, Force of Infection, Control Strategies

1. Introduction
Vector-borne diseases rely upon organisms, named vectors, such as mosquitoes, ticks or sandflies that have an active role in the transmission of a pathogen from one host to the other. Every year there are more than 1 billion cases and over 1 million deaths from vector-borne diseases such as malaria, dengue, schistosomiasis, human African try-panosomiasis, leishmaniasis, Chagas disease, yellow fever, Japanese encephalitis and onchocerciasis, globally. Since dengue is related with our previous work, so over here we consider the Dengue transmission model. Dengue is endemic in more than 110 countries [1] - [4] . It infects 50 to 390 million people worldwide a year, leading to half a million hospitalizations [3] [5] [6] , and approximately 25,000 deaths [4] [7] . For the decade of the 2000s, 12 countries in Southeast Asia were estimated to have about 3,000,000 infections and 6000 deaths annually [7] . In the United States, the rate of dengue infection among those who return from an endemic are with a fever is 3% - 8% [3] [4] .
Dengue fever is an infectious tropical disease caused by the dengue virus. Dengue is transmitted by several species of mosquito within the genus Aedes, principally Aedes aegypti. The virus has four different types [1] [8] - [10] , but only short-term immunity to the others. Subsequent infection with a different type increases the risk of severe complications. It is hoped that the first products will be commercially available by 2015 [1] [3] . The incidence of dengue fever has increased dramatically since the 1960s. Dengue has become a global problem since Second World War. The incubation period (time between exposure and onset of symptoms) ranges from 3 - 14 days, but most often it is 4 - 7 days [3] [4] [11] . Therefore, travelers returning from endemic area are unlikely to have dengue if fever or other symptoms start more than 14 days after arriving home [4] [12] . According to the World Tourism Organization, in 2004, 125.4 million international tourists visited countries where they might be at risk for acquiring infection 7% - 45% travelers. As approximately two billion people live in tropical and subtropical regions of the world, and an additional roughly 12 million people each year travel to these regions, a large share of the world’s population is at risk of contracting dengue.
According to the World Tourism Organization, 2,012,077 USA tourists visited Thailand during 1 January 2001 and 31 December 2004, giving a rate of 3.5 dengue infection per 1 million visitors to Thailand. Personnel deployed in dengue-endemic areas during humanitarian emergencies then are regular travelers, since they usually live in areas without vector control activities or air conditioning, and usually stay in those areas longer than do tourists. During a 5-month deployment as a part of the United Nations Mission in Haiti, 32% of 249 personal with febrile illness had dengue [3] [12] . Travelers can also introduce new serotypes in endemic areas, or dengue virus in non-endemic areas infected by vector-mosquitoes, and play an important role in dengue spread [6] [13] - [16] .
Several mathematical models have been developed in the literature to gain-insights into the transmission dynamics of dengue in a community [1] [10] [11] [17] - [26] . In our previous paper, we have extended some of the earlier models by considering the migrated individuals. To control the dengue virus effectively and to find the effects of migratory population, we should understand the dynamics of the disease transmission and take into account all of the relevant details, such as the dynamics of the human population and vector. For a realistic model, we consider some special classes like migratory class, treatment class and vector aquatic class. We also present and analyze some control rate parameters that will help to find the effective control strategies of the diseases.
2. Model
The dengue virus follows two main modes of transmission: human to mosquito and mosquito to human [5] [8] . The model assumes a homogeneous mixing of the human and vector (mosquito) populations, so that each mosquito bite has equal chance of transmitting the virus to susceptible human in the population (or acquiring Infec- tion from an infected human). The total human population at time t, denoted by , is sub-divided into six
mutually-exclusive sub-populations of susceptible humans , exposed humans
 , infectious humans
 , migrated population
 , treatment class
 and recovered humans
 , so that

Similarly, the total vector population at time t, denoted by , is split into aquaticClass
 , susceptible mosquitoes
 , exposed mosquitoes
 , infectious mesquites
 , so that
 . The susceptible human population is generated via recruitment of humans (by birth) into the community (at a constant rate,
 ). This population is decreased following infection, which can be acquired via effective contact with an exposed or infectious vector at a rate
 ; the force of infection of humans given by
 (1)
(1)
where the modification parameter
 accounts for the assumed reduction in transmissibility of exposed mosquitoes relative to infectious mosquitoes [1] . The model for the transmission dynamics of dengue in a population is given by the following system of non-linear differential equation (description of variables of the dengue mode is given in the Table 1).

Table 1. Description of variables of the dengue model (2).
 (2)
(2)
The associated basic reproduction number, denoted by , is given by

where ρ is the spectral radius of . It follows that

where,
 and
and
 and
and ,
,
 ,
,
 ,
,
 ,
,
 ,
, .
.
The square root in the expression for R0 arises from the two generations required for an infectious vector or host to reproduce itself.
3. Numerical Simulations and Discussions
The model (2) is simulated, using the parameter values given in Table 2 and Table 3 (unless otherwise stated).
Figure 1 presents the simulations of the dengue transmission model (2), showing a contour plot of the reproduction threshold
 which indicates that if the rate σV at which the vector individuals transfer from exposed class to infected class increases and at the same time if we have the effective precautionary measures the we would be able to control the disease spread and no endemic will occur, otherwise the disease burden will increases. Figure 2 depicts the simulations of the dengue transmission model (2), showing the total number of infected human population in time. It monitors that if the reproduction threshold is less than unity then the disease burden will decrease and there will be no disease in the community. Figures 3-7 monitor the effect of the ef-
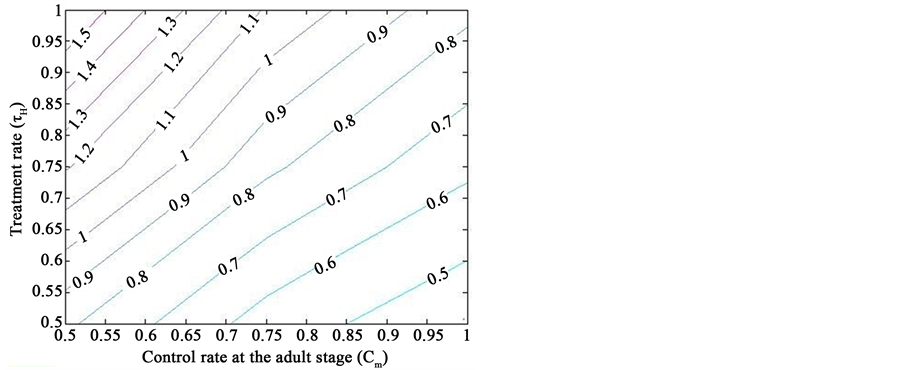
Figure 1. Simulations of the model (2) showing a contour plot of R0 as a function of control effect at the adult stage (Cm) and treatment rate of human population (τH). Parameter values used are as given in Table 2 and Table 3, with ΠH = 20, C1 = 0.075, C2 = 0.0375, σV = 0.0130, σH = 0.01250, γ1 = 0.001428, γm = 0.003575, Ca = 0.350, π1 = 7, ηH = 0.02902, ηV = 0.0129, θc = 0.075, πV = 5000, µH = 0.01492537, µV = 0.363.
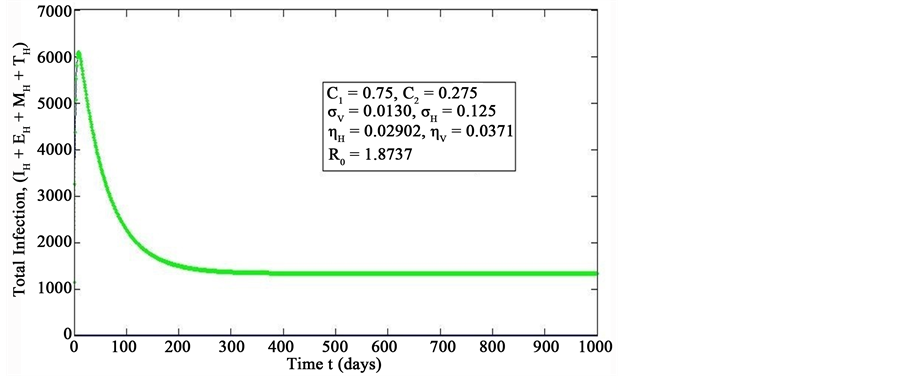
Figure 2. Simulations of the model (2) showing the total number of infected human population (EH + IH + MH + TH) as a function of time(for increasing value of σH), using the parameter values in Table 2 and Table 3 with ΠH = 20, C1 = 0.75, C2 = 0.275, σV = 0.0130, σH = 0.1250, δH = 0.0001, δV = 0.01, γ1 = 0.01428, γm = 0.03575, Ca = 0.0, Cm = 0.0, π1 = 7, τH = 0.0, ηH = 0.02902, ηV = 0.037103, θc = 0.075, πV = 5000, µH = 0.01492537, µV = 0.363333, R0 = 1.8737.
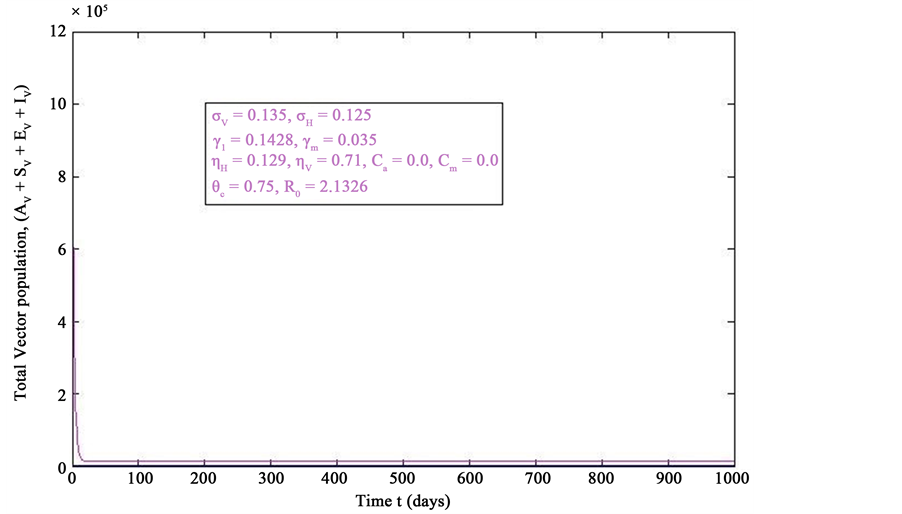
Figure 3. Simulations of the model (2) (without precautionary measures Ca = Cm = 0) showing the total number of vector population (AV + SV + EV + IV) as a function of time, using the parameter values in Table 2 and Table 3 with ΠH = 20, C1 = 0.75, C2 = 0.375, σV = 0.135, σH = 0.125, δH = 0.0001, δV = 0.01, γ1 = 0.1428, γm = 0.035, Ca = 0.0, Cm = 0.0, π1 = 7, τH = 0.0, ηH = 0.02902, ηV = 0.037103, θc = 0.75, µ1 = 0.0, µ2 = 0.0, πV = 5000, µH = 0.01492537, µV = 0.363333, R0 = 2.1326.
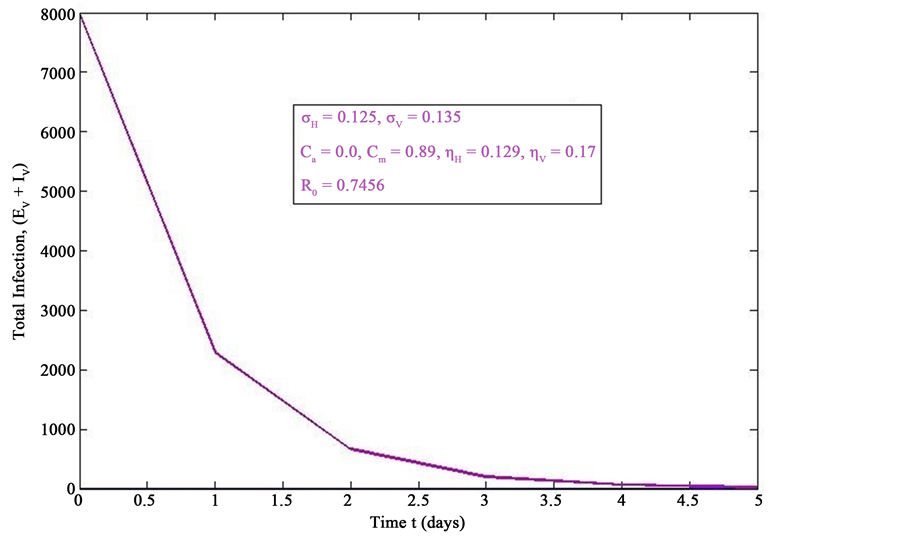
Figure 4. Simulations of the model (2) (with precautionary measures at the adult stage Cm = 0 and aquatic stage Ca = 0) showing the total number of infected vector individuals (EV + IV) as a function of time, using the parameter values in Table 2 and Table 3 with ΠH = 20, C1 = 0.75, C2 = 0.375, σV = 0.135, σH = 0.125, δH = 0.0001, δV = 0.01, γ1 = 0.01428, γm = 0.03575, Ca = 0.0, Cm = 0.89, π1 = 7, τH = 0.0, ηH = 0.129, ηV = 0.171, θc = 0.0075, µ1 = 0.0, µ2 = 0.0, πV = 5000, µH = 0.01492537, µV = 0.363333, R0 = 0.7455.
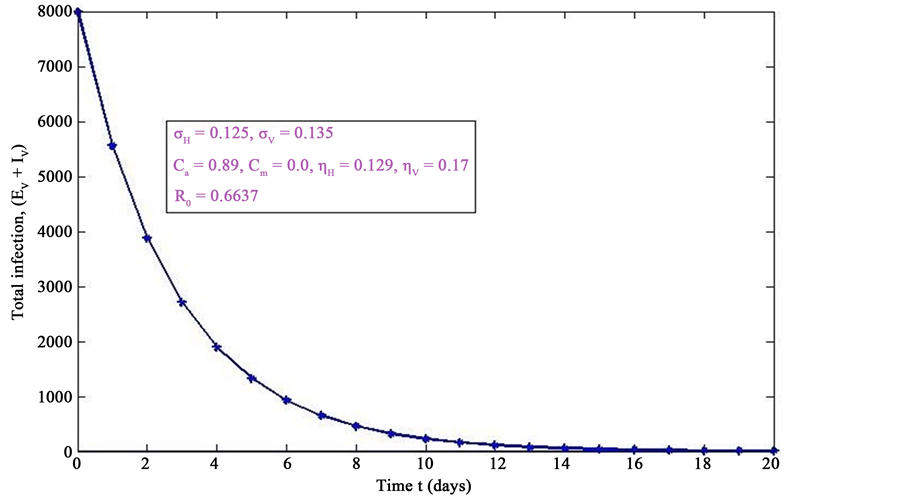
Figure 5. Simulations of the model (2) (with precautionary measures at the aquatic stage Ca = 0 and Cm = 0) showing the total number of infected vector individuals (EV + IV) as a function of time, using the parameter values in Table 2 and Table 3 with ΠH = 20, C1 = 0.75, C2 = 0.375, σV = 0.135, σH = 0.125, δH = 0.0001, δV = 0.01, γ1 = 0.01428, γm = 0.03575, Ca = 0.89, Cm = 0.0, π1 = 7, τH = 0.0, ηH = 0.12902, ηV = 0.17, θc = 0.01175, µ1 = 0.0, µ2 = 0.0, πV = 5000, µH = 0.01492537, µV = 0.363333, R0 = 0.6637.
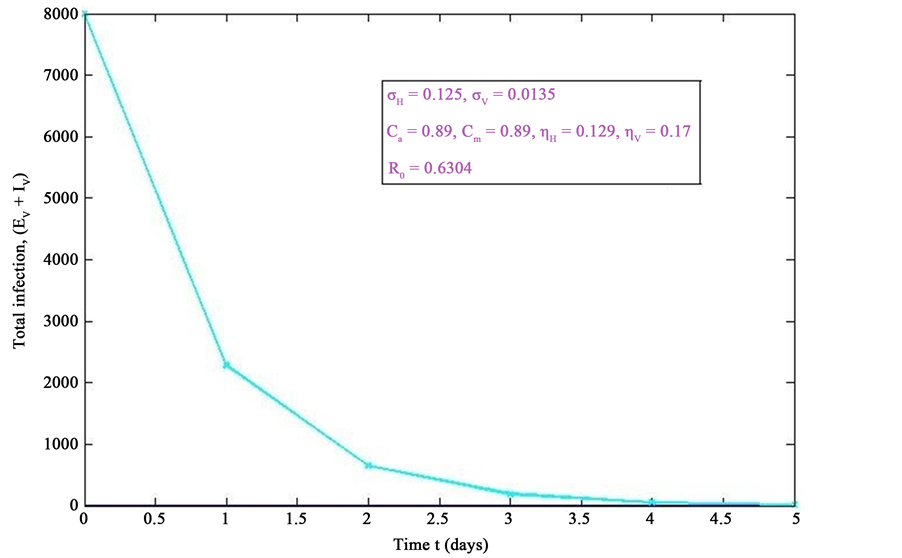
Figure 6. Simulations of the model (2) (with precautionary measures at the aquatic stage Ca = 0 and both adult stage Cm = 0) showing the total number of infected vector individuals (EV + IV) as a function of time, using the parameter values in Table 2 and Table 3 with ΠH = 20, C1 = 0.75, C2 = 0.375, σV = 0.0135, σH = 0.125, δH = 0.0001, δV = 0.01, γ1 = 0.01428, γm = 0.013575, Ca = 0.89, Cm = 0.89, π1 = 7, τH = 0.42, ηH = 0.129, ηV = 0.173, θc = 0.01175, µ1 = 0.0, µ2 = 0.0, πV = 5000, µH = 0.01492537, µV = 0.363333, R0 = 0.6304.
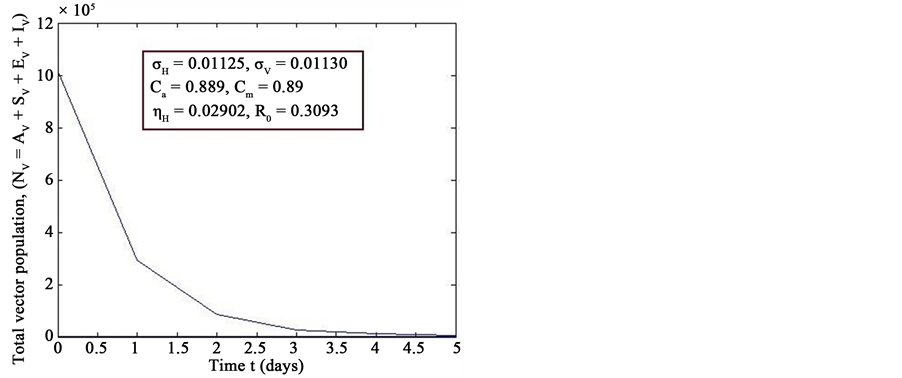
Figure 7. Simulations of the model (2) (with precautionary measures at the aquatic stage Ca = 0 and both adult stage Cm = 0) showing the total number of vector individuals (AV + SV + EV + IV) as a function of time, using the parameter values in Table 2 and Table 3 with ΠH = 20, C1 = 0.75, C2 = 0.375, σV = 0.01130, σH = 0.01125, δH = 0.0001, δV = 0.01, γ1 = 0.01428, γm = 0.013575, Ca = 0.889, Cm = 0.89, π1 = 7, τH = 0.42, ηH = 0.02902, ηV = 0.01137103, θc = 0.01175, µ1 = 0.0, µ2 = 0.0, πV = 5000, µH = 0.01492537, µV = 0.363333, R0 = 0.3093.
Table 2. The values for variables for the Figures 1-7.
Table 3. The value of the parameters of the dengue model 2.
fective vector control rate
 and
and . If we do not have any necessary precautionary measures, then the total number of vector population increases rapidly (Figure 3) and persists in the community ultimately. If we take the precautionary measures in the aquatic stage (i.e., if the control rate
 increases), the number of total infected vector
 decreases rapidly as like Figure 6. However if we take the necessary precautionary measures in the adult stage (i.e., if the control rate
 increases), the total infected vector
 also decreases, (Figure 4). Additionally if we take the precautionary step in the aquatic and adult both stage, then the total number of infected vector decreases drastically (Figure 6). To see the total changes in the vector population after some necessary precautionary measures, we have, from Figure 6, that the total vector population
 decreases rapidly. Figure 3 and Figure 6, present the comparative situation before and after the precautionary measures have taken.
4. Conclusion
Mosquitoes are the carriers that can cause a virus infection to human. Aim of our current study is to make people conscious about vector-bone disease cause. Numerical simulation depicts that if we take the precautionary measures more seriously it would be more effective than even giving the treatment to the infected individuals. Numerical simulations reveal that the spread of dengue virus can be controlled more effectively, if we take the precautionary measures at the aquatic and adult stages.
Cite this paper
SaddamHossain,JannatumNayeem,ChandranathPodder, (2015) Effective Control Strategies on the Transmission Dynamics of a Vector-Borne Disease. Open Journal of Modelling and Simulation,03,111-119. doi: 10.4236/ojmsi.2015.33012
References
- 1. Garba, S.M., Gumel, A.B. and Abu Bakar, M.R. (2008) Backward Bifurcations in Dengue Transmission Dynamics. Mathematical Biosciencees, 201, 11-25. http://dx.doi.org/10.1016/j.mbs.2008.05.002
- 2. Ranjit, S. and Kissoon, N. (2011) Dengue Hemorrhagic Fever and Shock Syndromes. Pediatric Critical Care Medicine, 12, 90-100. http://dx.doi.org/10.1097/PCC.0b013e3181e911a7
- 3. WWW.CDC.Gov/Dengue
- 4. WWW.WHO.int/denguecontrol/faq/en/index6.html
- 5. Whitehorn, J. and Farrar, J. (2010) Dengue. British Medical Bulletin, 95, 161-173.
http://dx.doi.org/10.1093/bmb/ldq019 - 6. Wilder-Smith, A. and Schwartz, E. (2005) Dengue in Travelers. The New England Journal of Medicine, 353, 924-932. http://dx.doi.org/10.1056/NEJMra041927
- 7. Varatharaj, A (2010) Encephalitis in the Clinical Spectrum of Dengue Infection. Neurology India, 58, 585-591. http://dx.doi.org/10.4103/0028-3886.68655
- 8. Holmes, P. and Guckenheimer, J. (1990) Nonlinear Oscillations, Dynamical Systems, and Bifurcations of Vector Fields. Springer-Verlag, New York Inc., New York.
- 9. Kautner, I., Robinson, M.J. and Kuhnle, U. (1997) Dengue virus Infection: Epidemiology, Pathogenesis, Clinical Presentation, Diagnosis, and Prevention. The Journal of Pediatrics, 131, 516-524. http://dx.doi.org/10.1016/S0022-3476(97)70054-4
- 10. Esteva, L. and Vargas, C. (2003) Coexistence of Different Serotypes of Dengue Virus. Journal of Mathematical Biology, 46, 31-47. http://dx.doi.org/10.1007/s00285-002-0168-4
- 11. Esteva, L. and Vargas, C. (1999) A Model for Dengue Disease with Variable Human Population. Journal of Mathematical Biology, 38, 220-240. http://dx.doi.org/10.1007/s002850050147
- 12. CDC (2010) Locally Acquired Dengue—Key West, Florida, 2009-2010. Morbidity and Mortality Weekly Report (MMWR), 59, 577-581.
- 13. Wilder-Smith, A. and Tambyah, P.A. (2007) Severe Dengue Virus Infections in Travelers. The Journal of Infectious Diseases, 195, 1081-1083. http://dx.doi.org/10.1086/512684
- 14. CDC (2006) Travel-Associated Dengue—United States, 2005. Morbidity and Mortality Weekly Report (MMWR), 55, 700-702.
- 15. Koopman, J.S., Prevots, D.R., Mann, M.A.V., Dantes, H.G., Aquino, M.L.Z., et al. (1991) Determinants and Predictors of Dengue Infection in Mexico. American Journal of Epidemiology, 133, 1168-1178.
- 16. Takahashi, L.T., Maidana, N.A., Ferreira Jr., W.C., Pulino, P. and Yang, H.M. (2005) Mathematical Models for the Aedes aegypti Dispersal Dynamics: Travelling Waves by Wing and Wind. Bulletin of Mathematical Biology, 67, 509- 528. http://dx.doi.org/10.1016/j.bulm.2004.08.005
- 17. Feng, Z. and Velasco-Hernandez, X.J. (1997) Competitive Exclusion in a Vector-Host Model for the Dengue Fever. Journal of Mathematical Biology, 35, 523-544.
http://dx.doi.org/10.1007/s002850050064 - 18. Struchiner, C.J., Luz, P.M., Codeco, C.T., Coelho, F.C. and Massad, E. (2006) Current Research Issues in Mosquito-Borne Diseases Modelling. Contemporary Mathematics, 410, 349-352.
- 19. Coutinho, F.A.B., Burattini, M.N., Lopez, L.F. and Massad, E. (2006) Threshold Conditions for a Non-Autonomous Epidemic System Describing the Population Dynamics of Dengue. Bulletin of Mathematical Biology, 68, 2263-2282.
http://dx.doi.org/10.1007/s11538-006-9108-6 - 20. Chowell, G., Diaz-Duenas, P., Miller, J.C., Alcazar-Velazco, A., Hyman, J.M., Fenimore, P.W. and Castillo Chavez, C. (2007) Estimation of the Reproduction Number of Dengue Fever from Spatial Epidemic Data. Mathematical Biosciences, 208, 571-589. http://dx.doi.org/10.1016/j.mbs.2006.11.011
- 21. Jelinek, T. (2000) Dengue Fever in International Travelers. Clinical Infectious Diseases, 31, 144-147. http://dx.doi.org/10.1086/313889
- 22. Tewa, J.J., Dimi, J.L. and Bowang, S. (2007) Lyapunov Functions for a Dengue Disease Transmission Model. Chaos, Solitons & Fractal, 39, 936-941. http://dx.doi.org/10.1016/j.chaos.2007.01.069
- 23. Esteva, L. and Vargas, C. (1998) Analysis of a Dengue Disease Transmission Model. Mathematical Biosciences, 150, 131-151. http://dx.doi.org/10.1016/S0025-5564(98)10003-2
- 24. Esteva, L. and Vargas, C. (2000) Influence of Vertical and Mechanical Transmission on the Dynamics of Dengue Disease. Mathematical Biosciences, 167, 51-64.
http://dx.doi.org/10.1016/S0025-5564(00)00024-9 - 25. Derouich, M. and Boutayeb, A. (2006) Dengue Fever: Mathematical Modelling and Computer Simulation. Applied Mathematics and Computation, 177, 528-544.
http://dx.doi.org/10.1016/j.amc.2005.11.031 - 26. Ferguson, N.M., Donnelly, C.A. and Anderson, R.M. (1999) Transmission Dynamics and Epidemiology of Dengue: Insights from Age-Stratied Sero-Prevalence Surveys. Philosophical Transactions of the Royal Society of London B, 354, 757-768. http://dx.doi.org/10.1098/rstb.1999.0428