 Journal of Geoscience and Environment Protection, 2014, 2, 59-67 Published Online December 2014 in SciRes. http://www.scirp.org/journal/gep http://dx.doi.org/10.4236/gep.2014.25009 How to cite this paper: Dimadis, G., Dimadi, A., & Bacasis, I. (2014). Influence of Fracture Roughness on Aperture Fracture Surface and in Fluid Flow on Coarse-Grained Marble, Experimental Results. Journal of Geoscience and Environment Protection, 2, 59-67. http://dx.doi.org/10.4236/gep.2014.25009 Influence of Fracture Roughness on Aperture Fracture Surface and in Fluid Flow on Coarse-Grained Marble, Experimental Results G. Dimadis, A. Dimadi, I. Bacasis Depart ment of Civil Engineering, Laboratory of Technical Geology, Aristotle University, Thessaloniki, Greece Email: gdimadi s@civil .auth.gr Received Oc tob er 2014 Abstract Wetting fluid flow through rock discontinuities influence a great number of project among others: dam construction, underground projects, CO2 storage in underground schemes, geological dispos- al of radioactive wastes; Hydrocarbon storage caverns. Flow through fractures is considered to be laminar due to small aperture of the fracture walls and slow velocity. The fluid model called “Cubic law” describes the flow assuming parallel infinite plates. However, natural discontinuities on rock have roughness. In this experimental study an induced fracture on a sample of medium-grained marble was used, to determine the influence of roughness in water flow. This study is a prelimi- nary part of research funding program for flow of CO2 through rocks (AUTH -GEOMechanics and Environment of CO2 geological Storage, Project No. 456,400) . Keywords Cubic Law , Roughness, Hydraulic Ape rtu r e, Mechanical Aperture 1. Introduction In relatively impermeable rocks, the fluid flow is essentially confined in joints and fractures of the rock mass. As a result the hydraulic conductivity of the rock mass is determined by the hydraulic conductivity of joints and fractures. The major factors govern the flow in fractured rocks are, a) fluid properties, b) void geometry and c) fluid pressure at the joint boundary (Olsso n & Barton, 2001) (Kranzz, Frankel, Engelder, & Scholz, 1979). Void geometry is ruled by the variation of the aperture between the walls of the fracture and the contact areas (touch- ing asperites) (Zimmerman & Bodvarsson, 1996) which induce the roughness of the fracture walls. In this study the parameter of void space is examined, by testing the effect of joint surface roughness on water flow rate through induced marble fracture. The relationship between flow rate and hydraulic gradient (Δh/Δl) is given by Darcy’s law or so called cubic law Equation (1) (Bear, 1979) (Witherspoon, Wang, Iwai, & Gale, 1980) even though introduced for planar pa-  G. Dimadis et al. rallel surfaces should not be generally used to estimate flow through rough surfaces (Oron & Berkowitz, 1998) (Park, Osada, Ma tsushita, Takahashi, & Ito, 2013; Zhao, Li, & J iang, 2013; Zimmerman, Al-Yaarubi, P a in, & Grattoni, 2004; Brown, 1987). In conditions that fluid velocity is high and/or joint surface roughness is much, the Cubic Law cannot apply. Moreover it is crucial to calculate the appropriate (most accurate) fracture aperture, so as the predictions of cubic law to be accurate (Renshaw, 1995). (1) where Q is the flow rate of water passing through two smooth parallel plates, Δh is the difference in hydraulic heads, w is the width of the flowing zone between the parallel plates in the direction normal to the flow vector, Δl is the length of sample, ρ is the fluid density, g is the acceleration due to gravity, μ is the kinematic viscosity of the fluid and bh is the distance between the two plates (hydraulic aperture). Roughness affection seems to be in length (Δl). Actually roughness increases the length that fluid has to cover from point A to point B. The longest route causes greater “friction effect” the solids would bring to the fluid, thus decreasing the fracture transmissivity (Bo Li, Jiang, Koyama, Jing, & Tanabashi, 2008). This becomes crit- ical in small joint apertures, because it is translated in greater resistance to flow, and finally in lower conductiv- ity (orders of magnitude) of rough joints (Oron & Berkowitz, 1998) 2. Materials and Method 2.1. Sample Preparation Α sample of marble, of medium-grained Interlocking crystals, with an induced fracture was used in this study. Total dimensions of the samples were: 186 × 45 × 105 mm (Figure 1). Artificial fracture was imposed by split- ting (tension fracture) one sample in half using custom made metal splitting jaws (a kind of modified “Brazilian” loading method) in a UCS device. A thin scratch in the middle of all surfaces (parallel to the long axis) of the sample was created before splitting, so as to enhance the stress field while loading, as a result almost parallel surfaces of crack occurred. We studied the influence of fracture roughness on water flow for different joint apertures. Fluid flow is as- sumed to occur only through the fracture, because the permeability of marble is considered negligible to the joint-flow magnitude. Eleven hydraulic gradients (Δh/Δl) were selected for each test Table 1. It must be mentioned that due to re- strictions of the experimental setup in apertures of 750 μm and 1000 μm hydraulic gradients greater than 0.54 and 0.4 respectively, could not be achieved. Each test concerns the same induced mechanical aperture, six induced mechanical apertures were selected as seen in Table 2, these apertures could represent a natural fracture at stage of rest (0 - 500 μm) and stage after shear movement which causes dilation to the fracture surface (>1000 μm) (Yeo, de Freitas, & Zimmerman, 1998). For each hydraulic gradient we conducted three flow measurements for 50 seconds (after the flow was stabi- lized) the average flow was calculated. Totally more than 150 measurements were conducted. To ensure that the Figure 1. Sample of marble with rough fracture surface.  G. Dimadis et al. Table 1. Relation of hydraulic gradient and sample length. Relation between Hydraulic gradient and Δh/ΔL ratio Δh (mm) 2 7.5 15 25 35 50 75 100 125 150 190 Δh/ΔL1 0.01 0.04 0.08 0.13 0.19 0.27 0.4 0.54 0.67 0.81 1.02 Note: 1In our study ΔL is steady (equal to sample length 189mm). Table 2. Fracture mechanical apertures used in the study. Em1 Em2 Em3 Em4 Em5 Em6 Fracture mechanically induced aperture (μm) 0 200 250 500 750 1000 induced mechanical apertures were as accurate as possible, each time we let the sample halves to rest on them- selves (Em1 = 0 μm) and then raised it on the desired aperture. The raise of the upper halve was manually con- trolled by four linear displacement indicators LDI (Wykeham Farrance, accuracy: ±2 μm) placed at each corner of the sample. For the same aperture to verify reproducibility in measurement at least 3 tests were performed. 2.2. Experimental Set Up Upper and lower surfaces of the samples were rigidly attached on acrylic plates with dimensions 10 × 65 × 260 mm, 4 thread rods at each corner were used for raising the upper half of the sample on z axis, while 4 Linear displacement indicators were used for exact measurement of level raising, a 5th indicator was used to check for linear movement along x axis. Two smaller acrylic plates with cavities in one side where used as entrance and exit chambers, which allowed water to enter/exit the fracture evenly, minimizing any radial movement. The hydraulic heads in entrance and exit where measured by two piezometers. Hydraulic gradient was applied each time manually using the piezometers. We employed constant head method by adding a water tank with a spillway to receive constant hydraulic head at specimen entrance, resulting in constant hydraulic gradient throughout each step. At the exit the spillway of the water tank was used to lead the water coming out of the fracture in a container on a high precision laboratory scale (KERN N2400). Weighting the outcome water gave us the water flow of the crack by using the equivalence 1 ml = 1 g of water. Deaerated water was used throughout the experiment. Total view of the experimental apparatus in Figure 2. To avoid inserting anisotropy in flow as described in Li’s study (B. Li, Wong, & Milnes, 2014) due to move- ment on x axis, 4 rigid metal plates were placed at both sides (y-z planes) of the sample, while raising it on de- sired mechanical aperture. We used strips of fiber-free elastomeric foam, as no-flow boundary. 2.3. Fracture Roughness Characterization The sample with the rough faces fracture was scanned with a 3D scan in both faces and the exact micro-topo- graphy of the phases was electronically created (Figure 5), z axis measurement took place to calculate joint sur- face roughness. Characterization of joint surface roughness made by one empirical and one statistical method that are widely used in rock mechanics. JRC factor (joint roughness coefficient) introduced by Barton (Nick Barton, 1973) is a coefficient used to quantify rock joint roughness, it compares the joint surface duplicate taken with a Profile Gauge Tool for a length of 10 cm, to a table of 10 typical roughness profiles and JRC ranges from 0 (for totally planar faces) to 20 (for very rough surfaces) Figure 4. In our case compare of the joints profile gave as an approximation for JRC ≈ 17 (Figure 3 and Figure 4). The statistical method we used is the dimensionless parameter Ζ2 introduced by Myers (Myers, 1962). It is defined as: (2)  G. Dimadis et al. Figure 2. Experimental setup. Figure 3. Profiles of lower half taken with profilometer. where z(x) refers to profile of the fracture surface and L is the profile length. In practice it is calculated by the discretization of the surface profile: ( ) ( ) 2 1 22 1 1 ii ii zz ZLxx + + − =− ∑ (3) where xi and zi the coordinates of the surface profile and L the length of the profile (L = 189 mm). For the rough fracture surface and 42 profiles along x axis Z2 factor was calculated and JRC coefficient was extracted using Tse’s Equation (4) by (Tse & Cruden, 1979). The frequency of JRC results can be seen in Fig- ure 6. Mean JRC was calculated as 16.38 very close to our approximation (≈17). (4) 3. Results The conducting aperture e of the fracture according to Barton (N. Barton, Bandis, & Bakhtar, 1985) is consi- dered identical to parameter bh of cubic law Equation (1), so after measuring flow rates in our experiment, we back-calculated the conducting aperture that occurred in every flow. Linear regression between hydraulic gradient and flow rate was observed so laminar flow exists (Figure 7). 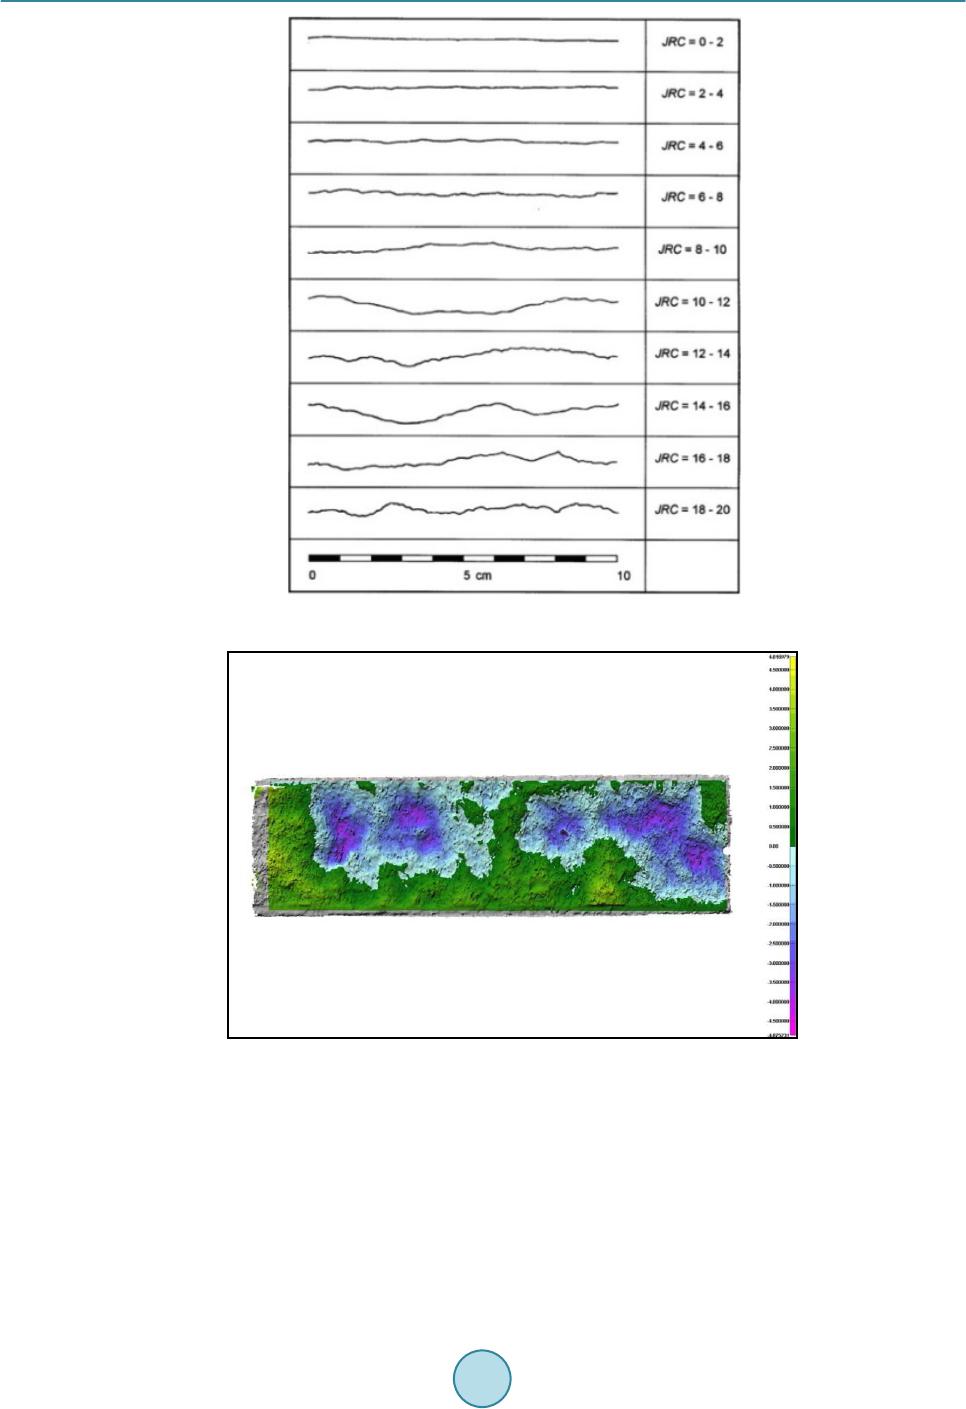 G. Dimadis et al. Figure 4. Typical profiles of fractures for JRC coefficient (N. Barton & Choubey, 1977). Figure 5. Topography of marble fracture (lower half). We used the cubic law to back-calculate the hydraulic aperture e (Figure 8) for each induced mechanical aper- ture Emi 0 μm, 200 μm, 250 μm, 500 μm,750 μm and 1000 μm. The existence of flow for induced aperture Em1 = 0 μm (fracture closed under gravity only) and the back cal- culated hydraulic aperture of 122 μm (Figure 8(a)), is incompatible for closed fracture. This indicates that void spaces exist between the two walls of fracture due to roughness and water flows through them. Using the empirical Equation (5) of Bandis (Bandis, Makurat, & Vik, 1986) for JRC 16.3 and assuming con- ducting aperture e equal to back calculated hydraulic bh (bh = e = 122 μm), the real aperture E is approached as 363 μm (for fracture closed under self-weight).  G. Dimadis et al. Figure 6. Calculated JRC coefficient for 42 profiles along x axis. Figure 7. Measured flow rate “Q” for mechanically induced apertures: a) Em1 = 0 μm; b) Em2 = 200 μm; c) Em3 = 250 μm; d) Em4 = 500 μm; e) Em5 = 750 μm; f) Em6 = 1000 μm. 0 2 4 6 8 10 12 14 16 18 15 16 17 18 19 JRC value Frequency of calculated JRC  G. Dimadis et al. Figure 8. Back calculated hydraulic apertures for mechanically induced apertures: a) Em1 = 0 μm; b) Em2 = 200 μm; c) Em3 = 250 μm; d) Em4 = 50 0 μm; e) Em5 = 7 50 μm; f) Em6 = 1000 μm. (5) For every mechanically induced aperture the real aperture E was estimated (Table 3). The variation of induced mechanical aperture Em to real aperture E, is presented in Figure 9. Back calculated hydraulic apertures for mechanically induced apertures: a) Em1 = 0 μm, b) Em2 = 200 μm, c) Em3 = 250 μm, d) Em4 = 500 μm, e) Em5 = 750 μm, f) Em6 = 1000 μm. 4. Conclusions and Discussion In this preliminary study we tested the influence of roughness and induced aperture on the flow regime by mea- suring flow rate in a fracture of marble. The roughness of the fracture walls was estimated by the index of JRC and factor Z2 which gave similar results (JRC ≈ 16.5). We observed that conducting aperture e (equal to hydraulic aperture bh which was back calculated by cubic law) and Em do not coincide, apart from induced aperture Em6 = 1000 μm. This indicates that cubic law was not valid for apertures lower than 1000 μm. During the experiment even for Em1 = 0 μm flow existed. We calculated the real aperture E using Bandis’s Equation (5) which gave Ε = 360 μm for Em1 = 0 μm. Real aperture E became identical to induced aperture Emi only at 1000 μm. The great differences which were observed between real aperture E and induced aperture Em indicate that the empirical Equation (5) can be improved. In our experiment values of conducting aperture, real aperture and induced aperture became identical only at  G. Dimadis et al. Figure 9. Real aperture E to Induced aperture Em variation. Table 3. Estimated real apertures and induced apertures Induced aperture Emi 0 200 250 500 750 1 000 Back calculated bh (equal to e) 122 250 290 490 7 00 992 Real Aperture E 363 521 562 730 875 1000 1000 μm. Further tests will take place, in order to approach the relation between induced aperture Em and conducting aperture (e). Tests will be performed for lower apertures trying to minimize the gap between these two parameters. The value of real aperture for closed fracture (E0) will be approached by putting the sample under normal stress, further flow tests will take place in these conditions to optimize Bandis’ constitutive model (Eq uatio n (5)). The same procedure will be followed for samples with different fracture roughness (smooth till very rough). Later, flow experiments with acid solutions (simulating CO2-brine conditions under pressure) will be per- formed, to examine the influence of acidity on fracture roughness and fracture transmissivity. Acknowledgem ents This research has been co-financed by the European Union (European Social Fund–ESF) and Greek national funds through the Operational Program “Education and Lifelong Learning” of the National Strategic Reference Framework (NSRF)-Research Funding Program: Thales. Investing in knowledge society through the European Social Fund. References Bandis, S. C., Makurat, A., & Vik, G. (1986). Predicted and Measured Hydraulic Conductivity of Rock Joints. Publikas- jon-Norges Gotekniske Institutt, 164, 1-11. Barton, N. (1973). Review of a New Shear-Strength Criterion for Rock Joints. Eng in eeri ng Geology, 7, 287-332. http://dx.doi.org/10.1016/0013-7952(73)90013-6 Barton, N., Bandis, S., & Bakhtar, K. (1985). Strength, Deformation and Conductivity Coupling of Rock Joints. Internation- al Journal of Rock Mechanics and Mining Sciences & Geomechanics Abstracts, 22, 121 -140. http://dx.doi.org/10.1016/0148-9062(85)93227-9 Barton, N., & Choubey, V. (1977). The Shear Strength of Rock Joints in Theory and Pract ice. Rock Mechanics Felsmechanik Mecanique Des Roches, 10, 1-54. http://dx.doi.org/10.1007/BF01261801  G. Dimadis et al. Bear, J. (1979). Hydraulics of Groundwater. MacGraw-Hill. Brown, S. R. (1987). Fluid Flow through Rock Joints: The Effect of Surface Roughness. Journal of Geophysical Research, 92, 1337-1347. http://dx.doi.org/10.1029/JB092iB02p01337 Kranzz, R. L., Frankel, A. D., Engelder, T., & Scholz, C. H. (1979). The Permeability of Whole and Jointed Barre Granite. International Journal of Rock Mechanics and Mining Sciences & Geomechanics Abstracts, 16, 225-234. http://dx.doi.org/10.1016/0148-9062(79)91197-5 Li, B., Jiang, Y., Koyama, T., Jing, L., & Tanabashi, Y. (2008). Experimental Study of the Hydro -Mechanical Behavior of Rock Joints Using a Parallel-Plate Model Containing Contact Areas and Artificial Fractures. International Journal of Rock Mechanics and Mining Sciences, 45, 362 -375. http://dx.doi.org/10.1016/j.ijrmms.2007.06.004 Li, B., Wong, R. C. K., & Milnes, T. (2014). Anisotropy in capillary invasion and fluid flow through induced sandstone and shale fractures. International Journal of Rock Mechanics and Mining Sciences, 65, 129-140. http://dx.doi.org/10.1016/j.ijrmms.2013.10.004 Myers , N. O. (1962). Characterization of Surface Roughness. Wear, 5, 182-18 9. http://dx.doi.org/10.1016/0043-1648(62)90002-9 Olsson, R., & Barton, N. (2001). An Improved Model for Hydromechanical Coupling during Shearing of Rock Joints. Inter- national Journal of Rock Mechanics and Mining Sciences, 38, 317-329. http://dx.doi.org/10.1016/S1365-1609 (00 )00 079 -4 Oron, A. P., & Berkowitz, B. (1998). Flow in Rock Fractures: The Local Cubic Law Assumption Reexamin ed. Water Re- sources Research, 34, 2811-2825. http://dx.doi.org/10.1029/98WR02285 Park, H., Osada, M., Matsushita, T., Takahashi, M., & Ito, K. (2013). Development of Coupled Shear-Flow-Visualization Apparatus and Data Analysis. International Journal of Rock Mechanics and Mining Sciences, 63, 72-81. http://dx.doi.org/10.1016/j.ijrmms.2013.06.003 Renshaw, C. E. (1995). On the Relationship between Mechanical and Hydraulic Apertures in Rough-Walled Fractures. Journal of Geophysical Research, 100, 629-636. http://dx.doi.org/10.1029/95JB02159 Tse, R., & Cruden, D. M. (1979). Estimating Joint Roughness Coefficients. International Journal of Rock Mechanics and Mining Sciences & Geomechanics Abstracts, 16, 303 -307. http://dx.doi.org/10.1016/0148-9062(79)90241-9 Witherspoon, P. A., Wang, J. S. Y., Iwai, K., & Gale, J. E. (1980). Validity of Cubic Law for Fluid Flow in a Deformable Rock Fracture. Water Resources Research, 16, 1016 -1024. http://dx.doi.org/10.1029/WR016i006p01016 Yeo, I. W., de Freitas, M. H., & Zimmerman, R. W. (1998). Effect of Shear Displacement on the Aperture and Permeability of a Rock Fracture. International Journal of Rock Mechanics and Mining Sciences, 35, 1051-1070. http://dx.doi.org/10.1016/S0148-9062(98)00165-X Zhao, Z., Li, B., & Jiang, Y. (2013). Effects of Fracture Surface Roughness on Macroscopic Fluid Flow and Solute Transport in Fracture Networks. Rock Mechanics and Rock Engineering, 47, 2279-2286 http://dx.doi.org/10.10 07/ s00 603 -013-0497 -1 Zimmerman, R. W., Al-Yaarubi, A. , Pain, C. C., & Grattoni, C. A. (2004). Non-Linear Regimes of Fluid Flow in Rock Fractu res. International Journal of Rock Mechanics and Mining Sciences, 41, 384. http://dx.doi.org/10.1016/j.ijrmms.2003.12.045 Zimmerman, R. W., & Bodvarsson, G. (1996). Hydraulic Conductivity of Rock Fractures. Transport in Porous Media, 23, 1-30. http://dx.doi.org/10.1007/BF00145263
|