Applied Mathematics
Vol.09 No.08(2018), Article ID:86931,21 pages
10.4236/am.2018.98065
Methodology for Constructing a Short-Term Event Risk Score in Heart Failure Patients
Kévin Duarte1,2*, Jean-Marie Monnez1,2,3, Eliane Albuisson4,5,6
1CNRS, INRIA, Institut Elie Cartan de Lorraine, Université de Lorraine, Nancy, France
2CHRU Nancy, INSERM, Université de Lorraine, CIC, Plurithématique, Nancy, France
3IUT Nancy-Charlemagne, Université de Lorraine, Nancy, France
4Institut Elie Cartan de Lorraine, Université de Lorraine, CNRS, Nancy, France
5CHRU Nancy, BIOBASE, Pôle S2R, Université de Lorraine, Nancy, France
6Faculté de Médecine, InSciDenS, Université de Lorraine, Nancy, France

Copyright © 2018 by authors and Scientific Research Publishing Inc.
This work is licensed under the Creative Commons Attribution International License (CC BY 4.0).
http://creativecommons.org/licenses/by/4.0/


Received: May 2, 2018; Accepted: August 26, 2018; Published: August 29, 2018
ABSTRACT
We present a methodology for constructing a short-term event risk score from an ensemble predictor using bootstrap samples, two different classification rules, logistic regression and linear discriminant analysis for mixed data, continuous or categorical, and random selections of variables into the construction of predictors. We establish a property of linear discriminant analysis for mixed data and define an event risk measure by an odds-ratio. This methodology is applied to heart failure patients on whom biological, clinical and medical history variables were measured and the results obtained from our data are detailed.
Keywords:
Ensemble Predictor, Linear Discriminant Analysis, Logistic Regression, Mixed Data, Scoring, Supervised Classification

1. Introduction
In this study, we focus on the problem of constructing a short-term event risk score in heart failure patients based on observations of biological, clinical and medical history variables.
Firstly, we present how we defined the learning sample using the available data and the list of explanatory variables used.
Secondly, we state a property of linear discriminant analysis (LDA) for mixed data, continuous or categorical.
Thirdly, we describe the methodology used, based on constructing an ensemble predictor using two different classification rules, logistic regression and LDA, bootstrap samples, and introducing random selections of variables into the construction of predictors. After presenting the method used to build a risk score and to reduce its variation scale from 0 to 100, we define a measure of the importance of variables or groups of correlated variables in the score and a measure of the event risk by an odds-ratio.
Finally, we describe the results obtained by applying our methodology to our data, using the AUC Out-Of-Bag (OOB) as a measure of predictor accuracy.
2. Data
The database at our disposal was EPHESUS, a clinical trial that included 6632 patients with heart failure (HF) after acute myocardial infarction (MI) complicated by left ventricular systolic dysfunction (left ventricular ejection fraction < 40%) [1] . All patients were randomly assigned to treatment with eplerenone 25 mg/day or placebo.
In this trial, each patient was regularly monitored, with visits at the inclusion in the study (baseline), 1 month after inclusion, 3 months later, then every 3 months until the end of follow-up. At each visit, biological, clinical parameters or medical history were observed. In addition, all adverse events (deaths, hospitalizations, diseases) that occurred during follow-up were collected.
To define the learning sample used to construct the short-term event risk score, we made the following working hypothesis: based on biological, clinical measurements or medical history on a patient at a fixed time, we sought to assess the risk that this patient has a short-term HF event. The individuals considered are couples (patient-month) without taking into account the link between several couples (patient-month) concerning the same patient. Therefore, it was assumed that the short-term future of a patient depends only on his current measures.
Firstly, we did a full review of the database in order to:
• identify the biological and clinical variables that were regularly measured at each visit,
• determine the medical history data that we could update from information collected during the follow-up.
We were thus able to define a set of 27 explanatory variables whose list is presented in Figure 1. The biological parameter ePVS was defined in [2] . Estimated glomerular filtration rate (eGFR) was assessed using three formulas [3] [4] [5] . The different types of hospitalization were defined in supplementary material of [1] .
Then, we defined the response variable as the occurrence of a composite short-term HF event (death or hospitalization for progression of HF). In order to have enough events, we defined the short term as being equal to 30 days. Patient-months with a follow-up of less than 30 days and no short-term HF event during this incomplete follow-up period, were not taken into account.
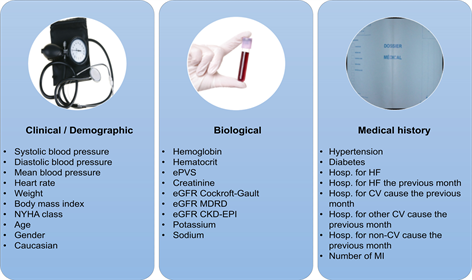
Figure 1. List of variables.
There were finally 21,382 patient-months from 5937 different patients whose 317 with short-term HF event and 21,065 with no short-term event.
3. Property of Linear Discriminant Analysis of Mixed Data
Denote A' the transposed of a matrix A.
In case of mixed data, categorical and continuous, a classical method to perform a discriminant analysis is:
1) perform a preliminary factorial analysis according to the nature of the data, such as multiple correspondence factorial analysis (MCFA) [6] for categorical data, multiple factorial analysis (MFA) [7] for groups of variables, mixed data factorial analysis (MDFA) [8] , ... ;
2) after defining a convenient distance, perform a discriminant analysis from the set of values of principal components, or factors.
See for example the DISQUAL (DIScrimination on QUALitative variables) method of Saporta [9] , who performs MCFA, then LDA or QDA.
Denote as usual T the total inertia matrix of a dataset partitioned in classes, W and B respectively its intraclass and interclass inertia matrix.
We show hereafter that when performing LDA with metrics T−1 or W−1, it is not necessary to perform a preliminary factorial analysis and LDA can be directly performed from the raw mixed data.
Metrics W−1 will be used in the following but can be replaced by T−1.
Let a set of n individuals, partitioned in q disjoint classes . Denote , the weight of ith individual of class and the weight of , with . p quantitative variables or indicators of modalities of categorical variables, denoted , are observed on these individuals. Suppose that there exists no affine relation between these variables, especially for each categorical variable an indicator is removed.
For , denote the value of for ith individual of class . Denote the vector and the barycenter of the elements for :
Intraclass inertia matrix W is supposed invertible:
A currently used distance in LDA between two points a and b in is such that:
Suppose we want to classify an individual knowing the vector a of values of . Principle of LDA is to classify it in such that is minimal.
Consider now new variables affine combinations of , with , such that:
with , A a matrix of rank p and a vector in .
Denote the barycenter of vectors in for :
Let Z the intraclass inertia matrix of :
The rank of Z is equal to the rank of A, . For , the matrix Z is not invertible. Then use in this case the pseudoinverse (or Moore-Penrose inverse) of Z, denoted , which is equal to the inverse of Z when , to define the pseudodistance denoted in . The denomination pseudodistance is used because is not positive definite. Remind the definition of a pseudoinverse and two theorems [10] .
Definition Let A a matrix of rank r. The pseudo-inverse of A is the unique matrix such that:
1) ,
2) ,
3) ,
4)
Theorem 1: Maximal rank decomposition
Let A a matrix of rank r. Then there exist two full-rank (r) matrices, F of dimension and G of dimension ( ) such that .
Theorem 2: Expression of A+
Let a full-rank decomposition of A. Then .
Prove now:
Proposition 1:
Proof. . AW and are of full-rank p. Applying theorem 2 yields:
Note that, when , A is invertible and .
Thus:
Proposition 2: Let A a matrix, , of rank p and for , , . The results of LDA of the dataset with the metrics on are the same as those of LDA of the dataset with the pseudometrics .
Applications
Denote the value of the variable for individual i belonging to I, , and the vector of values of for individual i. Denote the weight of individual i, such that . To perform a factorial analysis of the dataset , the difference between two individuals i and is measured by a distance defined on associated to a metrics M, such that
Denote X the matrix whose element is . Denote D the diagonal matrix whose element is .
Perform a factorial analysis of , for instance PCA for continuous variables or MCFA for categorical variables or MDFA for mixed data. Suppose X of rank p. Denote a unit vector of the jth principal axis. Denote the jth principal component. Denote U the matrix and C the matrix ; as are M-orthonormal, and
Using the metrics of intraclass inertia matrix inverse, LDA from C is equivalent to LDA from X.
Suppose now that the variable is introduced; when is the indicator of a modality of a binary variable, is the indicator of the other modality. Then:
Denote the matrix whose element is . LDA from C with the metrics of intraclass inertia matrix inverse is equivalent to LDA from with the metrics of intraclass inertia matrix pseudoinverse.
For instance:
1) If are continuous variables, LDA from X is equivalent to LDA from C obtained by PCA, such as normed PCA, or gCCA [11] and MFA which can be interpreted as PCA with specific metrics.
2) If are indicators of modalities of categorical variables, and if MCFA is performed to obtain C, LDA from C with the metrics of intraclass inertia matrix inverse is equivalent to LDA from X with the metrics of intraclass inertia matrix pseudoinverse.
3) Likewise, if are continuous variables or indicators of modalities of categorical variables, and if MDFA [8] is performed to obtain C, LDA from C with the metrics of intraclass inertia matrix inverse is equivalent to LDA from X with the metrics of intraclass inertia matrix pseudoinverse. In this case, other metrics can also be used, such as that of Friedman [12] or that of Gower [13] .
4. Methodology for Constructing a Score
4.1. Ensemble Methods
Consider the problem of predicting an outcome variable y, continuous (in the case of regression) or categorical (in the case of classification) from observable explanatory variables , continuous or categorical.
The principle of an ensemble method [14] [15] is to build a collection of N predictors and then aggregate the N predictions obtained using:
• in regression: the average of predictions ;
• in classification: the rule of the majority vote or the average of the estimations of a posteriori class probabilities.
The ensemble predictor is expected to be better than each of the individual predictors. For this purpose [14] :
• each single predictor must be relatively good,
• single predictors must be sufficiently different from each other.
To build a set of predictors, we can:
• use different classifiers,
• and/or use different samples (e.g. by bootstrapping, boosting, randomizing outputs) [15] [16] [17] ,
• and/or use different methods of variables selection (e.g. ascending, stepwise, shrinkage, random) [18] [19] [20] [21] ,
• and/or in general, introduce randomness into the construction of predictors (e.g. in random forests [22] , randomly select a fixed number of variables at each node of a classification or regression tree).
In Random Generalized Linear Model (RGLM) [23] , at each iteration,
• a bootstrap sample is drawn,
• a fixed number of variables are randomly selected,
• the selected variables are rank-ordered according to their individual association with the outcome variable y and only the top ranking variables are retained,
• an ascending selection of variables is made using AIC [24] or BIC [25] criteria.
Tufféry [26] wrote that logistic models built from bootstrap samples are too similar for their aggregation to really differ from the base model built on the entire sample. This is in agreement with an assertion by Genuer and Poggi [14] . However, Tuffėry suggests the use of a method called “random forest of logistic models” introducing an additional randomness: at each iteration,
• a bootstrap sample is drawn,
• variables are randomly selected,
• an ascending variables selection is performed using AIC [24] or BIC [25] criteria.
Note that this method is in fact a particular case of RGLM method.
Present now the method used in this study to check the stability of the predictor obtained on the entire learning sample.
4.2. Method of Construction of an Ensemble Predictor
The steps of the method for constructing an ensemble predictor are presented in the form of a tree (Figure 2).
At first step, classifiers are chosen.
At second step, bootstrap samples are drawn and are the same for each classifier.
At third step, for each classifier and each bootstrap sample, modalities of random selection of variables are chosen, a modality being defined either by a number of randomly drawn variables or by a number of predefined groups of correlated variables, which are randomly drawn, inside each of which a variable is randomly drawn.
At fourth step, for each classifier, each bootstrap sample and each modality of random selection of variables, one method of selection of variables is chosen, a stepwise or a shrinkage (LASSO, ridge or elastic net) method.
This yields a set of predictors, which are aggregated to obtain an ensemble predictor.

Figure 2. General methodology for the construction of a score.
4.3. Choices Made
To assess accuracy of the ensemble predictor, the percentage of well-classified is currently used. But this criterion is not always convenient, especially in the present case of unbalanced classes. We decided to use the area under ROC curve (AUC). AUC in resubstitution being usually too optimistic, we used AUC “out-of-bag” (OOB) [27] : for each patient, consider the set of predictors built on the bootstrap samples that do not contain this patient, i.e. for which this patient is “out-of bag”, then aggregate the corresponding predictions to obtain an OOB prediction.
Two classifiers were used: logistic regression and linear discriminant analysis (LDA) with metrics . Other classifiers were tested but not retained because of their less good results, such as random forest-random input (RF-RI) [22] or quadratic discriminant analysis (QDA). The k-nearest neighbors method (k-NN) was not tested, because it was not adapted to this study due to the presence of very unbalanced classes with a too small class size.
1000 bootstrap samples were randomly drawn.
Three modalities of random selection were retained, firstly a random draw of a fixed number of variables, secondly and thirdly a random draw of a fixed number of predifined groups of correlated variables followed by a random draw of one variable inside each drawn group. The number of variables or of groups drawn was determined by optimization of AUC OOB.
Fourth step did not improve prediction accuracy and was not retained.
4.4. Construction of an Ensemble Score
4.4.1. Aggregation of Predictors
In the case of two classes and , whose barycenters are respectively denoted and , Fisher linear discriminant function
can be used as score function. For logistic regression, the following score function can be used:
Remind that, in the case of a multinormal model with homoscedasticity (covariance matrices within classes are equal), when , logistic model is equivalent to LDA [15] ; indeed:
So we used the following method to aggregate the obtained predictors:
1) the score functions obtained by LDA are aggregated by averaging; denote now the averaged score;
2) likewise the score functions obtained by logistic regression are aggregated by averaging; denote the averaged score;
3) a combination of the two scores, is defined, ; a value of that maximizes AUC OOB is retained; denote the optimal score obtained by this method.
If is an optimal cut-off, the ensemble classifier is defined by:
If , x is classified in ;
If not, x is classified in .
4.4.2. Definition of a Score from 0 to 100
The variation scale of the score function was reduced from 0 to 100 using the following method. Denote:
Denote for :
and
Let the minimal value of the variable if , or its maximal value if .
Denote the “normalized” score function, with values from 0 to 100, defined by:
with
4.4.3. Measure of Variables Importance
Explanatory variables are not expressed in the same unit. To assess their importance in the score, we used “standardized” coefficients, multiplying the coefficient of each variable in the score by its standard deviation. These coefficients are those associated with standardized variables and are directly comparable. For all variables, the absolute values of their standardized coefficient, from the greatest to the lowest, were plotted on a graph. The same type of plot was used for groups of correlated variables, whose importance is assessed by the sum of absolute values of their standardized coefficients.
4.4.4. Risk Measure by an Odds-Ratio
Define a risk measure associated to a score s by an odds-ratio :
An estimation of , also denoted , is with and , .
Note that:
• decreases when decreases and is constant. In practice, the decrease will be much smaller when there are many observations;
• is not defined when is equal to 1.
For these reasons, the following definition can also be used:
Note that is the slope y/x of the line joining the origin to the point of the ROC curve. In the case of an “ideal” ROC curve, supposed continuous above the diagonal line, assuming that there is no vertical segment in the curve, this slope increases from point , corresponding to the minimal value of score, to point , corresponding to its maximal value; the case of a vertical segment (Se decreases, Sp is constant), occurring when the score of a patient with event is between those of two patients without event, is particularly visible in the case of a small number of patients and also justifies the definition of , whose curve fits that of .
For very high score values, when or are too small, the estimation of is no longer reliable. A reliability interval of the score could be defined, depending on the values of and .
5. Results
5.1. Pre-Processing of Variables
5.1.1. Winsorization
To avoid problems related to the presence of outliers or extreme data, all continuous variables were winsorized using the 1st percentile and the 99th percentile of each variable as limit values [28] . We chose this solution because of the large imbalance of the classes (317 patients with event against 21,065 with no event, so there is a ratio of about 1 to 66). The elimination of extreme data would have led to decrease the number of patients with event.
5.1.2. Transformation of Variables
Among qualitative variables, two are ordinal: the NYHA class with 4 modalities and the number of myocardial infarction (no. MI) with 5 modalities. In order to preserve the ordinal nature of these variables, we chose to use an ordinal encoding. For NYHA, we therefore associated 3 binary variables: NYHA ≥ 2, NYHA ≥ 3 and NYHA ≥ 4. In the same way, for the no. MI, we considered 4 binary variables: no. MI ≥ 2, no. MI ≥ 3, no. MI ≥ 4 and no. MI ≥ 5.
On the other hand, continuous variables were transformed in the context of logistic regression. For each continuous variable, a linearity test was performed using the method of restricted cubic splines with 3 knots [29] . A cubic spline restricted with 3 knots is composed of a linear component and a cubic component. Linearity testing is to test, under the univariable logistic model, the nullity of the coefficient associated with the cubic component. To do this, we used the likelihood ratio test. The results of linearity tests are given in Table 1 (p-value 1).
At 5% level, linearity was rejected for 9 of 16 continuous variables. For each of these 9 variables, we represented graphically the relationship between the logit (logarithm of the probability of event) and the variable. An example of graphical representation is given for potassium: we observe a quadratic relationship between the logit and the potassium (Figure 3). In agreement with the relationship observed, we applied a simple, monotonous or quadratic transformation function to each of the 9 variables. The transformation function applied to each variable is given in Table 1.
For hematocrit and the three variables of eGFR, the relationship is clearly monotonous. So we considered some simple monotonic transformation functions as with or , then we

Table 1. Linearity tests and transformation of continuous variables.

Figure 3. Relationship between potassium and logit of probability of event.
retained for each variable the transformation for which the likelihood under univariable logistic model was maximal (minimal p-value).
For other variables not checking linearity, namely potassium, the three blood pressure measures (systolic, diastolic and mean), and heart rate, the relationship between the logit and the variable was rather quadratic. We therefore applied a quadratic transformation function with an optimal value determined by maximizing likelihood under univariable logistic model. To compare, we also used the criterion of maximal AUC to determine an optimal value. These results are presented in Table 2. Notice that the optimal values determined by the two methods are the same for systolic BP, diastolic BP and heart rate and are very close for potassium and mean BP.
Also note that the transformation applied to potassium allows to take into account both hypokalemia and hyperkalemia, two different clinical situations pooled here that may increase the risk of death and/or hospitalization measured by the score.
To verify that the transformation of the variables was good, a linearity test for the transformed variable was performed according to the previously detailed principle. All tests are not significant at the 5% level (see Table 1, p-value 2).
5.2. Ensemble Score
5.2.1. Ensemble Score by Logistic Regression
As a first step, we applied our methodology with the following parameters:
• use of a single classification rule, logistic regression ( ),
• draw of 1000 bootstrap samples ( ),
• random selection of variables according to a single modality ( ).
Three modalities for the random selection of variables were defined:
• 1st modality: random draw of m variables among 32,
• 2nd modality: random draw of m groups among 18, then one variable from each drawn group,
• 3rd modality: random draw of m groups among 24, then one variable from each drawn group.
The groups of variables considered for each modality are presented in Table 3. For modalities 2 and 3, we formed groups of variables based on correlations between variables. For the second modality, we gathered for example in the same
Table 2. Quadratic transformations.
Table 3. Composition of groups of variables.
group hemoglobin, hematocrit and ePVS because of their high correlations. For the third modality, the same groups were used, except for the two variables linked to hospitalization for HF, the four variables linked to the no. MI and the three variables related to the NYHA class, for which each binary variable was considered as a single group.
For each modality, an ensemble score was built for all possible values of m and the one that gave maximal AUC OOB was selected. In Table 4 are reported the
Table 4. Results obtained by logistic regression.
results obtained for each modality with the optimal m. The best result was obtained for the third modality, with AUC OOB equal to 0.8634.
The ensemble score by logistic regression, denoted , obtained by averaging the three ensemble scores that we constructed, gave slightly better results, with AUC OOB of 0.8649.
5.2.2. Ensemble Score by LDA for Mixed Data
The same methodology was used by simply replacing the classification rule (logistic regression) by LDA for mixed data and keeping the same other settings. Again, for each modality, we searched the optimal m parameter. The obtained results are presented in Table 5.
As for logistic regression, the best results were obtained for the third modality, with AUC OOB equal to 0.8638.
The ensemble score by LDA, denoted , yielded better results with AUC OOB equal to 0.8654.
5.2.3. Ensemble Score Obtained by Synthesis of Logistic Regression and LDA
The final ensemble score denoted , obtained by synthesis of the two ensemble scores and presented previously, provided the best results with AUC equal to 0.8733 in resubstitution and 0.8667 in OOB.
This ensemble score corresponds to the one obtained by applying our methodology with the following parameters:
• two classification rules are used, logistic regression and LDA for mixed data ( ),
• 1000 bootstrap samples are drawn ( ),
• m variables are randomly selected according to three modalities ( ).
The scale of variation of the score function was reduced from 0 to 100 according to the procedure described previously. We denote this “normalized” score .
In Table 6, we present the “raw” and “standardized” coefficients associated with each of the variables in the score function and the “normalized” score function .
5.2.4. Importance of Variables in the Score
To have a global view of the importance of the variables in the “normalized” score, we represented on a graph the absolute value of standardized coefficient
Table 5. Results obtained by LDA for mixed data.
associated with each variable, from the largest value to the smallest (see Figure 4). Note that the most important variables are heart rate, NYHA class ≥ 3 and history of hospitalization for HF in the previous month. On the other hand, variables such as weight, no. MI ≥ 5 or BMI do not play a large part in the presence of others.
The same type of graph was made to represent the importance of the groups of variables in configuration 2 defined by the sum of the absolute values of the “standardized” coefficients associated with the variables of the group, from the largest sum to the smallest (see Figure 4). Note that the two most influential groups are NYHA (NYHA ≥ 2, NYHA ≥ 3 and NYHA ≥ 4) and history of hospitalization for HF(hospitalization for HF in the previous month and hospitalization for HF during life). Three important groups follow: “Hematology” (ePVS, hemoglobin, hematocrit), “heart rate” and “Renal function” (creatinine and three formulas of eGFR). The least important groups of variables are “Obesity” (weight, BMI) and gender.
5.2.5. Risk Measure by an Odds-Ratio
We represented the variation of , , , , and according to the score s (Table 7). For score values , is less than or equal to 30. Thus, beyond this threshold value 49.1933, is no longer very reliable. We therefore defined as reliability interval of the and functions .
We represented the variation of odds-ratio and in this reliability interval (Figure 5). By reading the graph, for a patient with a score of 40 for
example, is about 15 times higher than .
6. Conclusions and Perspectives
In this article, we presented a methodology for constructing a short-term event risk score, based on an ensemble predictor built using two classification rules (logistic regression and LDA for mixed data), 1000 bootstrap samples and three modalities of random selection of variables. This score was normalized on a scale from 0 to 100. We gave a measure of the importance of each variable and each group of variables in the score and defined an event risk measure by an odds-ratio.
Table 6. Ensemble score.
Table 7. Variation of , , , , and according to the values of score s.

Figure 4. Importance of variables and groups of variables.
Due to the nature of the data available (data derived from the EPHESUS study), we had to define the short term to 30 days in order to have enough observations with HF event. It would be better to have data of patients with

Figure 5. Risk measure by an odds-ratio.
shorter intervals, in order to have data the closest possible of an event and eventually improve the quality of the score. When such data will be available, it will be interesting to apply the same methodology to construct a new score.
Note that this methodology can be adapted to the case of a data stream. Suppose that new data for heart failure patients arrive continuously. They can be allocated to bootstrap samples using online bagging [30] . Each predictor based on logistic regression or binary linear discriminant analysis can be updated online using stochastic gradient algorithms. As examples of such algorithms, see [31] for binary LDA and [32] for logistic regression, which use online standardized data in order to avoid numerical explosions in the presence of extreme values. Thus the ensemble score obtained by averaging can be updated online.
Conflicts of Interest
The authors declare no conflicts of interest regarding the publication of this paper.
Cite this paper
Duarte, K., Monnez, J.-M. and Albuisson, E. (2018) Methodology for Constructing a Short-Term Event Risk Score in Heart Failure Patients. Applied Mathematics, 9, 954-974. https://doi.org/10.4236/am.2018.98065
References
- 1. Pitt, B., Remme, W., Zannad, F., et al. (2003) Eplerenone, a Selective Aldosterone Blocker, in Patients with Left Ventricular Dysfunction after Myocardial Infarction. New England Journal of Medicine, 348, 1309-1321. https://doi.org/10.1056/NEJMoa030207
- 2. Duarte, K., Monnez, J.M., Albuisson, E., Pitt, B., Zannad, F. and Rossignol, P. (2015) Prognostic Value of Estimated Plasma Volume in Heart Failure. JACC: Heart Failure, 3, 886-893. https://doi.org/10.1016/j.jchf.2015.06.014
- 3. Cockcroft, D.W. and Gault, H. (1976) Prediction of Creatinine Clearance from Serum Creatinine. Nephron, 16, 31-41. https://doi.org/10.1159/000180580
- 4. Levey, A.S., Coresh, J., Balk, E., et al. (2003) National Kidney Foundation Practice Guidelines for Chronic Kidney Disease: Evaluation, Classification, and Stratification. Annals of Internal Medicine, 139, 137-147. https://doi.org/10.7326/0003-4819-139-2-200307150-00013
- 5. Levey, A.S., Stevens, L.A., Schmid, C.H., et al. (2009) A New Equation to Estimate Glomerular Filtration Rate. Annals of Internal Medicine, 150, 604-612. https://doi.org/10.7326/0003-4819-150-9-200905050-00006
- 6. Lebart, L., Morineau, A. and Warwick, K. (1984) Multivariate Descriptive Statistical Analysis: Correspondence Analysis and Related Techniques for Large Matrices. Wiley, New-York.
- 7. Escofier, B. and Pagès, J. (1990) Multiple Factor Analysis. Computational Statistics and Data Analysis, 18, 121-140. https://doi.org/10.1016/0167-9473(94)90135-X
- 8. Pagès, J. (2004) Analyse Factorielle de Données Mixtes. Revue de Statistique Appliquée, 52, 93-111.
- 9. Saporta, G. (1977) Une Méthode et un Programme d’Analyse Discriminante sur Variables Qualitatives. Analyse des Données et Informatique, Inria, 201-210.
- 10. Rotella, F. and Borne, P. (1995) Théorie et Pratique du Calcul Matriciel. Editions Technip.
- 11. Carroll, J.D. (1968) A Generalization of Canonical Correlation Analysis to Three or More Sets of Variables. Proceedings of the 76th Annual Convention of the American Psychological Association, Washington DC, 1968, 227-228.
- 12. Friedman, J.H. and Meulman, J.J. (2004) Clustering Objects on Subsets of Attributes (with Discussion). Journal of the Royal Statistical Society: Series B (Statistical Methodology), 66, 815-849. https://doi.org/10.1111/j.1467-9868.2004.02059.x
- 13. Gower, J.C. (1971) A General Coefficient of Similarity and Some of its Properties. Biometrics, 27, 857-871. https://doi.org/10.2307/2528823
- 14. Genuer, R. and Poggi, J. M. (2017) Arbres CART et Forêts Aléatoires, Importance et Sélection de Variables. https://arxiv.org/pdf/1610.08203v2.pdf
- 15. Hastie, T., Tibshirani, R. and Friedman, J. (2009) The Elements of Statistical Learning. Springer, New York. https://doi.org/10.1007/978-0-387-84858-7
- 16. Efron, B. and Tibshirani, R.J. (1994) An Introduction to the Bootstrap. CRC Press, Boca Raton.
- 17. Breiman, L. (1996) Bagging Predictors. Machine Learning, 24, 123-140. https://doi.org/10.1007/BF00058655
- 18. In Lee, K. and Koval, J.J. (1997) Determination of the Best Significance Level in Forward Stepwise Logistic Regression. Communications in Statistics-Simulation and Computation, 26, 559-575. https://doi.org/10.1080/03610919708813397
- 19. Wang, Q., Koval, J.J., Mills, C.A. and Lee, K.I.D. (2007) Determination of the Selection Statistics and Best Significance Level in Backward Stepwise Logistic Regression. Communications in Statistics-Simulation and Computation, 37, 62-72. https://doi.org/10.1080/03610910701723625
- 20. Bendel, R.B. and Afifi, A.A. (1977) Comparison of Stopping Rules in Forward “Stepwise” Regression. Journal of the American Statistical Association, 72, 46-53.
- 21. Tibshirani, R. (1996) Regression Shrinkage and Selection via the Lasso. Journal of the Royal Statistical Society. Series B (Methodological), 58, 267-288. http://www.jstor.org/stable/2346178
- 22. Breiman, L. (2001) Random Forests. Machine Learning, 45, 5-35. https://doi.org/10.1023/A:1010933404324
- 23. Song, L., Langfelder, P. and Horvath, S. (2013) Random Generalized Linear Model: A Highly Accurate and Interpretable Ensemble Predictor. BMC Bioinformatics, 14, 5. https://doi.org/10.1186/1471-2105-14-5
- 24. Akaike, H. (1998) Information Theory and an Extension of the Maximum Likelihood Principle. In: Parzen, E., Tanabe, K. and Kitagawa, G., Eds., Selected Papers of Hirotugu Akaike, Springer Series in Statistics (Perspectives in Statistics), Springer, New York, 199-213.
- 25. Schwarz, G. (1978) Estimating the Dimension of a Model. The Annals of Statistics, 6, 461-464. https://doi.org/10.1214/aos/1176344136
- 26. Tufféry, S. (2015) Modélisation Prédictive et Apprentissage Statistique avec R. Editions Technip.
- 27. Breiman, L. (1996) Out-Of-Bag Estimation. https://www.stat.berkeley.edu/~breiman/OOBestimation.pdf
- 28. Dixon, W.J. (1960) Simplified Estimation from Censored Normal Samples. The Annals of Mathematical Statistics, 31, 385-391. https://doi.org/10.1214/aoms/1177705900
- 29. Royston, P. and Sauerbrei, W. (2007) Multivariable Modeling with Cubic Regression Splines: A Principled Approach. Stata Journal, 7, 45-70.
- 30. Oza, N.C. and Russell, S. (2001) Online Bagging and Boosting. Proceedings of 8th International Workshop on Artificial Intelligence and Statistics, Key West, 4-7 January 2001, 105-112.
- 31. Duarte, K., Monnez, J.M. and Albuisson, E. (2018) Sequential Linear Regression with Online Standardized Data. PLoS ONE, 13, e0191186. https://doi.org/10.1371/journal.pone.0191186
- 32. Monnez, J.M. (2018) Online Logistic Regression Process of a Data Stream with Online Standardized Data.