Crystal Structure Theory and Applications
Vol.2 No.2(2013), Article ID:33491,5 pages DOI:10.4236/csta.2013.22010
X-Ray Crysatllographic and Vibrational Spectroscopic Studies of Thorium Bromate Hydrate
1Department of Physics, Cochin University of Science and Technology, Kochi, India
2Department of Physics, University of Kerala, Thiruvananthapuram, India
3Department of Physics,University College of Engineering, Anna University Tirunelveli Region,
Nagercoil, India
4School of Physics, Madurai Kamaraj University, Madurai, India
Email: *junaidbushiri@cusat.ac.in
Copyright © 2013 M. Junaid Bushiri et al. This is an open access article distributed under the Creative Commons Attribution License, which permits unrestricted use, distribution, and reproduction in any medium, provided the original work is properly cited.
Received November 30, 2012; revised January 1, 2013; accepted January 10, 2013
Keywords: Thorium Bromate; X-Ray Diffraction; IR Spectroscopy; Raman; Crystal Structure;  Anion
Anion
ABSTRACT
Th(BrO3)3·H2O single crystals were grown from its aqueous solution at room temperature. Single crystal XRD, Raman and FTIR techniques were used to investigate the crystal structure. The crystal structure was solved by Patterson method. The as grown crystals are in monoclinic system with space group P21/c. The unit cell parameters are a = 12.8555(18) Å, b = 7.8970(11) Å, c = 9.0716(10) Å, a = 90˚, b = 131.568˚ and g = 90˚ and unit cell volume is 689.1(2) Å3. Z = 8, R factor is 5.9. The Raman and FTIR studies indicate the lowering of symmetry of bromate anion from C3V to C1. Hydrogen bonds with varying strengths are present in the crystal. The centrosymmetric space group P21/c of the crystal is confirmed by the non-coincidence of majority of Raman and IR bands.
1. Introduction
Hydrated bromates, coordinated to rare earth metals are an interesting group of compounds due its magnetic and optical properties [1,2]. Further, Bromates are attained considerable interest from chemists because its role in chemical oscillator systems and chemiluminescence systems and as an oxidizing agent for the fast oxidation of secondary alcohols [3-7]. Recently, Thionine-Bromate is identified as a new reaction system for kinetic spectrophotometric determination of hydrazine in cooling tower water samples [8]. However a limited attention is paid by researchers to understand structural and physical properties of bromate compounds. Single crystal XRD and vibrational spectroscopic techniques are being used by different authors for elucidating structure of hydrated metallic bromates [9-15]. Interestingly, most of these compounds having hydrogen bonded crystalline structure and oxyhalogen anions in these compounds posses distorted pyramidal structure. Thorium is one of the important actinide elements, actinide bromate compounds are rarely reported in the literature. In the present work we are reporting structural studies of hydrated rare earth thorium bromate by using X-ray diffraction, Raman and infrared spectroscopy for the first time.
2. Experimental
Crystals used in the present investigation were grown from aqueous solution of thorium bromate by slow evaporation at room temperature (32˚C) over a period of one month. Single crystal X-ray diffraction data were collected by using single crystal X-ray diffractometer sealed tube CAD4/MACH3, with MoKα radiation (λ = 0.71073 Å). CAD4 Software. Version 5.0. Enraf-Nonius were used for data collection [16,17]. The cell data were obtained from the least-squares refinement. Structure was solved by using ShellX97 program. Raman spectrum of the sample was recorded using Bruker RFS 100/s Raman spectrometer equipped with Nd:YAG laser (Wavelength 1064 nm at a Laser power of 150 mW) in the stokes region from 50 - 4000 cm−1 with a spectral resolution better than 4 cm−1. Standard Ge detector was used for detecting the Raman signals. FTIR spectrum of the sample in the range 400 - 4000 cm−1 was obtained from Shimadzu spectrometer by KBr pellet method and in the region 50 - 400 cm−1 with polyethylene pellet method by using MAGNA 550 FTIR spectrometer.
3. Results and Discussion
3.1. X-Ray Crystal Structural Studies
The structure of the title compound is solved by Patterson method [16]. Thorium atoms are coordinated to oxygen atoms and some of these are coordinated to bromine and H2O (Figure 1). The average bond length of water (oxygen) coordinated Th(1)-O1w is of the order of 2.6972(0.0232) Å which is comparable to Th-O (water) distance (2 - 46 Å) reported in thorium nitrate pentahydrate [18]. The thorium atom coordinated to the oxygen atoms of bromate group (Th(1)-O (of BrO3) is of the order of 2.7766(0.0125) Å. Generally lanthanide hydrated bromates form disordered bromate anions at room temperature [15]. In the actinide bromate also disordered bromate anion is seen which is formed by the bonding of oxygen atoms with bromine and Thorium atoms is shown in the ORTEP diagram (Figure 2). The average Br(1)- O(1) distance is 1.6504(0.0133) Å, Br(1)-O(3) is 1.6573(0.0129) Å and Br(1)-O(2) 1.6712(0.0128) Å (Table 1). These distances are consistent with those of previously reported one in the literature [12-14].
3.2. Raman and FTIR Spectral Studies
Th(BrO3)3·H2O crystallizes in the monoclinic crystal

Figure 1. ORTEP diagram of hydrated thorium bromate.

Figure 2.  anion and thorium water coordination in hydrated thorium bromate.
system (space group P21/c, Z = 8) and all the atoms are occupying in the C1 sites. The factor group analysis was carried out by the correlation method developed by Fateley et al. [19]. The total irreducible representation, excluding the acoustic modes, are distributed as
 .
.
The  anion with C3V symmetry has four fundamental modes of vibrations, symmetric stretching n1— 805 (A1), asymmetric stretching n3—805 (E), symmetric bending n2—418 (A1) and asymmetric bending n4—358 (E) cm-1 [13,14,16-20]. For XY3 pyramidal (C3v) molecules G = 2A1+2E, and all the modes are active both in the Raman and IR spectra [20]. In Raman spectrum, a strong band is observed at 820 cm−1 followed by a shoulder at 796 cm−1 and another strong band is appeared at 784 cm−1 (Figure 3). The strongest band observed in the IR spectrum is at 789 followed by a strong shoulder at 821 cm−1. These bands correspond to ν1-ν3 modes of BrO3− anion. These spectral band positions are in the same region as reported previously in the literature which is having comparable Br-O distance [21-25]. The symme-tric stretching frequency of
  anion observed in this crystal is almost similar (784 cm−1) to that of reported in crystals like Cd(BrO3)2·2H2O, Nd(BrO3)3·9H2O, Gd(BrO3)3·9H2O and La(BrO3)3·9H2O [23-26]. This

Table 1. Selected bond distances of thorium bromate hydrate .

Figure 3. FT Raman spectrum of hydrated thorium bromate in the region 50 - 4000 cm−1.
downward shift is attributed to the presence of hydrogen bonding, which is attached to water molecules.
Symmetric bending mode ν2 is observed at 429 cm−1 as a weak band in the Raman spectrum similar to that in the case of [Cu (H2O)6] (BrO3)2 (Table 2) [25]. The degeneracy of the ν4 mode of  anion is lifted in the Raman spectrum and two bands are observed at 371 and at 383 cm−1 (Figure 3). Lifting of degeneracy is also observed in the IR spectrum and two bands are observed at 363 and 389 cm−1. The lifting of degeneracy of ν4 mode both in the Raman and IR spectra indicate the lowering of symmetry of
  anion from C3v pyramidal to lower one at C1. A moderately intense broad band is observed at 152 cm−1 in Raman spectra is assigned to the
 rotational mode [27].

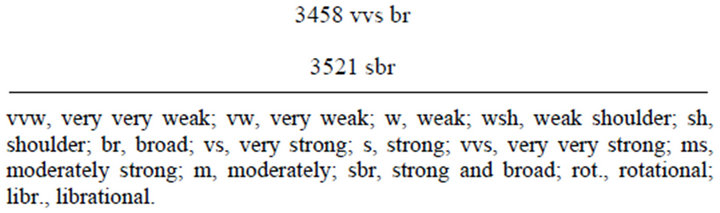
Table 2. Raman and IR Spectral data of thorium bromate hydrate (cm−1).
In the stretching mode region of H2O a broad band extending from 3000 - 3708 cm−1 is obtained in the IR spectrum (Figure 4) with shoulder at 3155 and followed by in tense peaks 3458 and 3521 cm−1. In the bending mode region, a moderately intense band is observed at 1597 cm−1 in the IR spectrum. The appearance of OH stretching modes at lower wavenumber than those of free state values of H2O indicate the presence of hydrogen bonds in the crystal [24]. Due to hydrogen bonds, OH bending modes are usually expected to shift upwards. But the coordination of Thorium atoms to the water Oxygen atoms causes a downward shift. Therefore, this almost equally energetic upward and downward pulling of O atoms causes the intense OH bending modes to appear without any shift in wavenumber values with respect to its free state value (1595-ν2 H2O). The appearance of additional bands in the OH stretching regions and broad spectral profile of both bending and stretching regions confirms the existence of hydrogen bonds of different strengths in the crystal [24,25]. The bands observed below 250 cm−1 are mostly of lattice modes and are assigned in Table 2. Interestingly, majority of the Raman and IR bands are not coinciding each other which indicate that the hydrated thorium bromate is crystallized in centrosymmetric space group which is in agreement with X-ray crystallographic information.
The strong Raman bands observed at 2130 and 2206 cm−1 probably attributed to resonance Raman scattering process since there is no vibrational bands are expected in this region for the title compound. Thorium is having closely lying “f” electronic energy levels, the electronic transitions between these levels initiate the formation of bands in the region 1925 - 2280 cm−1 similar to that reported previously in several U(IV) and Zr(IV) bis (ketimide) complexes, and in a few Th(IV) compounds [28,29].

Figure 4. FTIR spectrum of the hydrated thorium bromate in the region 500 - 4000 cm−1.
4. Conclusion
The crystal structure of hydrated thorium bromate shows the Br(1)-O(1) distance is 1.6504(0.0133) Å, Br(1)-O(2) 1.6712(0.0128) Å and Br(1)-O(3) is 1.6573(0.0129) Å. Additional bands obtained in the vibrational spectra in the region of ν1 modes in the thorium bromate hydrate are due to the lifting of degeneracy of  ion, which occupies a site of lower symmetry than its free state at C3v. The lifting of degeneracy of ν4 mode both in the Raman and IR spectra indicate the lowering of symmetry of
  anion from C3v pyramidal to lower one. The shifting of stretching modes of water towards low wavenumber region as compared to that of its free state value and the broadening of the stretching bands of H2O indicate the presence of hydrogen bonds of varying strengths in the crystal. Non-coincidence of majority of Raman and IR bands confirms the centrosymmetric space group P21/c of the crystal. Resonance Raman scattering process is seen in addition to vibrational bands attributed to closely lying “f” electronic energy levels. The present compound may be useful to study as a chemical oscillator and chemiluminescence systems in future.
REFERENCES
- S. K. Misra and X. Li, “Electron Paramagnetic Resonance of Gd3+-Doped Dy(BrO3)3∙9H2O and Eu(BrO3)3∙9H2O Single Crystals: Structural Phase Transitions and SpinHamiltonian Parameters,” Journal of Physics: Condensed Matter, Vol. 4, No. 13, 1992, pp. 3559-3670. doi:10.1088/0953-8984/4/13/025
- D. Neogy and T. Purohit, “Magnetic Behavior and Crystal Field of Dy(BrO3)3⋅9H2O,” Physical Review B, Vol. 35, No. 11, 1987, pp. 5849-5855. doi:10.1103/PhysRevB.35.5849
- N. Matsuyama, N. Okazaki, Y. Tanimoto and I. Hanazaki, “Photo-Response of the Bromate-Sulfite Chemical Oscillator with Tris-(bipyridine)ruthenium(II) as a Catalyst,” Chemical Physics Letters, Vol. 323, No. 3, 2000, pp. 372-376. doi:10.1016/S0009-2614(00)00507-8
- K. Kurin-Csörgei, I. R. Epstein and M. Orbán, “Systematic Design of Chemical Oscillators Using Complexation and Precipitation Equilibria,” Nature, Vol. 433, No. 7022, 2005, pp. 139-142. doi:10.1038/nature03214
- M. Iranifam, M. A. Segundo, J. L. M. Santos, J. L. F. C. Lima and M. H. Sorouraddin, “Oscillating Chemiluminescence Systems: State of the Art,” Luminescence, Vol. 25, No. 6, 2010, pp. 409-418. doi:10.1002/bio.1203
- S. Pääkkönen, J. Pursiainen and M. Lajunen, “Fast Oxidation of Secondary Alcohols by the Bromate-Bromide System Using Cyclic Microwave Heating in Acidic Water,” Tetrahedron Letters, Vol. 51, No. 51, 2010, pp. 6695- 6699. doi:10.1016/j.tetlet.2010.10.009
- D. Deepa and G. Chandramohan, “Kinetic and Mechanistic Study on the Oxidation of Indole-3-Propionic Acid in Acetic Acid Medium,” Research Journal of Chemical Sciences, Vol. 2, No. 10, 2012, pp. 70-74.
- M. R. Shishehbore, A. Sheibani and M. Eslami, “Thionine-Bromate as a New Reaction System for Kinetic Spectrophotometric Determination of Hydrazine in Cooling Tower Water Samples,” Journal of Chemistry, Vol. 2013, 2013, pp. 1-5.
- J. Albertsson and I. Elding, “The Geometry of the Nonaaqualanthanoid (3+) Complex in the Solid Bromates and Ethyl Sulphates,” Acta Crystallographica, Vol. B33, 1977, pp. 1460-1469.
- H. Poulet, J. P. Mathieu, D. Vergnat, B. Vergnat, A. Hadni and X. Gerbaux, “Vibrational Spectra, Structure, and Phase Transition in Neodymium and Gadolinium Bromate Enneahydrates,” Physica Status Solidi, Vol. 32, No. 2, 1975, pp. 509-520. doi:10.1002/pssa.2210320221
- R. E. Gerkin and W. J. Reppart, “The Structures of the Lanthanide Ethyl Sulfate Enneahydrates, M(C2H5SO4)3.9H2O [M = La-Lu (except Pm)], at 171 K,” Acta Crystallographica, Vol. C40, No. 5, 1984, pp. 781- 786.
- R. E. Gerkin and W. J. Reppart, “Structures of Holmium Bromate Enneahydrate at 168 and 294 K and Their Implications for the Isomorphic Series of Rare-Earth Bromate Enneahydrates,” Acta Crystallographica, Vol. C43, No. 4, 1987, pp. 623-631.
- A. C. Blackburn, J. C. Gallucci and R. E. Gerkin, “The Structure of Hexaaquaaluminium(III) Bromatetrihydrate, [Al(H2O)6](BrO3)3∙3H2O,” Acta Crystallographica, Vol. C48, No. 7, 1992, pp. 1185-1188.
- K. Lieselotte, L. K. Templeton and D. H. Templeton, “Structure of Barium Bromate Monohydrate,” Acta Crystallographica, Vol. C45, No. 4, 1989, pp. 672-673.
- A. Abbasi and L. Eriksson, “Nonaaquayttrium(III) Tris(Bromate),” Acta Crystallographica, Vol. E62, No. 5, 2006, pp. 126-128.
- A. C. T North, D. C. Philips and F. S. Mathews, “A Semi-Empirical Method of Absorption Correction,” Acta Crystallographica, Vol. A24, No. 3, 1968, pp. 351-359.
- Enraf-Nonius, “CAD-4 Software. Version 5.0.,” EnrafNonius, Delft, 1994.
- T. Ueki, A. Zalkin and D. H. Templeton, “Crystal Structure of Thorium Nitrate Pentahydrate by X-Ray Diffraction,” Acta Crystallographica, Vol. 20, No. 6, 1966, pp. 836-841. doi:10.1107/S0365110X66001944
- W. G. Fateley, F. R. Dollish, N. T. McDevitt and F. F. Bentley, “Infrared and Raman Selection Rules for Molecular and Lattice Vibrations—The Correlation Method,” Wiley-Interscience, New York, 1972.
- K. Nakamoto, “Infrared and Raman Spectra of Inorganic and Coordination Compounds—Part A,” 5th Edition Wiley-Interscience, New York, 1997.
- D. M. Adams, J. Barlow, H. Tan and M. J. Taylor, “The Vibrational Spectra of Mercury (I) Bromate, Sulphate, and Nitrate Dihydrate,” Journal of Raman Spectroscopy, Vol. 5, No. 1, 1976, pp. 63-73. doi:10.1002/jrs.1250050108
- R. S. Jayasree, M. J. Bushiri, A. John and V. U. Nayar, “Temperature Dependent Polarized Raman Spectra of Nonaaqualanthanoid (Pr) Single Crystal,” Spectrochimica Acta, Vol. A64, No. 2, 2006, pp. 518-525.
- T. Devanathan and T. K. K. Srinivasan, “Raman Spectra of Single-Crystal Cd(BrO3)2·2H2O and Polycrystalline Cd(BrO3)2·2D2O,” Journal of Raman Spectroscopy, Vol. 18, No. 7, 1987, pp. 525-531. doi:10.1002/jrs.1250180714
- T. K. K. Srinivasan and T. Devanathan, “Raman Spectral Studies of Dehydration of Sr(BrO3)2·H2O,” Journal of Raman Spectroscopy, Vol. 21, No. 2, 1990, pp. 99-102. doi:10.1002/jrs.1250210206
- M. J. Bushiri and V. U. Nayar, “Raman and FTIR Spectra of [Cu(H2O)6](BrO3)2 and [Al(H2O)6](BrO3)3 × 3H2O,” Spectrochimica Acta, Vol. A58, No. 5, 2002, pp. 899-909.
- M. J. Bushiri and V. U. Nayar, “Raman and FTIR Spectra of RE(BrO3)3·9H2O (RE = Eu, Tb) and Electronic Transitions in Eu(BrO3)3·9H2O,” International Journal of Modern Physics, Vol. B15, No. 18, 2001, pp. 2499-2507.
- A. Viste and D. E. Irish, “Raman and Infrared Spectral Studies of Polycrystalline Thallium(I) Halates, TlXO3,” Canadian Journal of Chemistry, Vol. 55, No. 18, 1977, pp. 3218-3227. doi:10.1139/v77-448
- E. J. Schelter, P. Yang, B. L. Scott, R. E. Da Re, K. C. Jantunen, R. L. Martin, P. J. Hay, D. E. Morris and J. L. Kiplinger, “Systematic Studies of Early Actinide Complexes: Thorium(IV) Fluoroketimides,” Journal of the American Chemical Society, Vol. 129, No. 16, 2007, pp. 5139-5152. doi:10.1021/ja0686458
- D. E. Morris, R. E. Da Re, K. C. Jantunen, I. C. Rodriguez and J. L. Kiplinger, “Trends in Electronic Structure and Redox Energetics for Early-Actinide Pentamethylcyclopentadienyl Complexes,” Organometallics, Vol. 23, No. 22, 2004, pp. 5142-5153. doi:10.1021/om049634v
NOTES
*Corresponding author.