Internationa l Journal of Geosciences, 2014, 5, 1-4
Published Online January 2014 (http://www.scirp.org/journal/ijg)
http://dx.doi.org/10.4236/ijg.2014.51001
Geomagnetic Investigation Method Using Iphone®
Integrated Magnet ic S en so r
Mapathe Ndiaye, Ababacar Diagne
Laboratoire de M écanique et Modél isation, UFR Sciences de l’Ingénieur, University of Thies, Thies, Sen egal
Email: mapathe.ndiaye@univ-thies.sn
Received November 15, 2013; revised December 12, 2013; accepted Jan uary 9, 2014
Copyright © 2014 Mapathe Nd iaye, Ababacar Diagn e. This is an open access ar ticle distr ibuted under the Creative Co mmons Attri-
bution License, which permits unrestricted use, distribution, and reproduction in any medium, provided the original work is properly
cited. In accordance o f the Creative Co mmons Attribution License all Copyrights © 2014 are reserved for SCIRP and the owner of
the intellectual property Mapathe Ndiaye, Ababacar Di agne. All Copyright © 2014 are guard ed by law and by SCIRP as a guardian.
ABSTRACT
We carried out a geomagnetic investigation usi ng Iphone 4 S® integrated magnetic sensor. The investigated area
is a faulted sedimentary terrain crossed by basaltic volcanic veins. The obtained magnetic anomaly map shows
the limits between the sedimentary rocks and a magnetic body at a given depth. These results are compared to
the geometry of the magnetic body as shown by geological maps. The results seem to be accurate for the deter-
mination of geometry and the depth of the magnetic body.
KEYWORDS
Geomagnetic; Magnetic Anomaly; Iphone 4S; Vein; Basalt
1. Introduction
The rapid expansion of mobile phone technology led to
the emergence of smartphones. Nowadays, almost all
smartphones include various accessories as cameras or
GPS antenna. But one of the most innovative steps in
smartp hones e volutio n remai ns the inte gratio n of sensor s
[1]. Nowadays, many smartphones are equipped with
gravit y, li ght de tectio n, or magnet ic se nsors. The co mpe-
tition context between manufacturers leads to embeding
more and more sensitive sensors in the devices. While it
is common to use these sensors in various domains [2];
[3] or to access their electronic specifications, it is still
difficult to predict their efficiency in more specific do-
mains, as in geophysical investigation. This is probably
due to the complexity of geophysical objects where in-
formation about the physical property is encoded in the
data in a complex way [4].
In this work, we explored a smartphone sensor, spe-
cifically magnetic sensor capability for geophysical in-
vestigation. We chose a geological context, favorable to
geomagnetic investigations, with well contrasted mag-
netic properties, presenting volcanic veins surrounded
with layered sedimentary rocks. Moreover, b y comparing
the obtained results with the existing geological data, it
will be po ssible to validate obta ined results.
2. Material and Method
We carried out geomagnetic investigation using Iphone
magnetic sensor, recording data with Sensor Monitor
mobile application [5].
Sensor Monitor is a n iOS ap pl icatio n allo wing to s how
the c ur re nt va l ue o f all t he s e n so rs include d i n the Ip ho ne
(GPS sensor, magnetic sensor, accelerometer, proximity
sensor, etc.). We used Sensor Monitor free version on
Iphone 4S. Many other free sensor data recording appli-
cations are available for Iphones. But they differ on the
types of sensor data that can be recorded simultaneously,
the format of the output file or the number of shown di-
gits.
The explored area is located in Diack, a village South-
est of Thies Region, Senegal, West Africa, between
16˚43'W to 16˚45'W and 14˚40'N to 14˚41'N. The geo-
logical framework of Diack is characterized by faulted
sedimentary layers crossed by basaltic veins settled dur-
ing the late Miocene fissural volcanism [6]. The radi-
ometric ages ranges from 7.8 ± 0.50 MA for basanites to
10.30 ± 0.50 MA for dolerites [7]. The volcanic veins fill
the intersection of N-S and E-W orthogonal faults [8].
Previously, two main veins referred as “pitons” and
numbered P1 and P2 exist with secondary veins spread
all around the region [9]. Since the eighteens, the basaltic
OPEN ACCESS IJG
M. NDIAYE, A. DIAGNE
2
veins have been actively exploited as source of aggre-
gates for roads and building materials. Nowadays, as it
can be observed in the field, the main veins are merged
and form a unique set.
The investigated area is located in the eastern part of
the unified veins (Figure 1) with sedimentary rocks and
no basaltic rock outcrops. The purpose of our choice was
to take advantage of the contrast of magnetic properties
to detect the underground limit between sedimentary and
basaltic formations.
Using Sensor Monitor, we collected current time ver-
sus GPS location and current time versus magnetic field
components through scan lines (Figure 2). Sensor Mon-
itor saves this data in two distinct files. The current time
allowed synchronization between location and magnetic
data.
The magnetic data were collected as in standard mag-
netic survey choosing a base station where data were
repetitively collected at given time intervals during the
investigation, for magnetic data correction. Also the
Iphone 4S was held by a walking operator as the device
sensor can update and record magnetic data at 30 Hz
frequency. 4321 magnetic data with their positions were
recorded.
The obtained data were processed to synchronize loca-
tion and magnetic data. In fact, GPS and magnetic se nsor
update respectively when location and magnetic data
change. As these changes are not always correlated, it
was necessary to use the current time to synchronize the
data. We coded a small script in java to synchronize the
data.
The processed data were mapped using Surfer soft-
ware. The obtained result is further replaced in the geo-
logical context using a GIS.
3. Results and Discussion
Using the implemented java code on magnetic and posi-
tion files, we produced a unique o utput file with the cur-
rent time, the position (x, y and z in degrees) and the
main components of the magnetic field (Xm, Ym, Zm).
The positions were converted to UTM WGS 84 Zone
28 for compliance with geological data. The components
of the magnetic field were used to compute the total
magnetic field Tm.
The base station data (Table 1) allo wed computing the
drift, necessary for diurnal correction (Figure 3).
The diurnal correction was done considering the drift
of 0.2377 nT/s computed from the base station data.
Thus, the co r r ec tio n fo rmul a f o r a va lue V read at a time t
within the sta rting time (11 h 57 min 22 s) and the ending
time ( 14 h 17 min 12 s) is:
( )
corrected read0
0.2377V Vtt=+−
(1)
where
corrected
V
is the value of magnetic field after diur-
Eolianites
Sand and clay s
La te ritic cuira sse
Volc a nic deposi t ( v e i n)
Inv e stig a ted area
Figure 1. Geological setting of the investigated area ([10].
Modified).
0 50 100
meters
N
Figure 2. Sca n lines used in geomagnetic inves tiga tion.
Table 1. Magnetic fi eld measure at base station.
Base x [m] y [m] Tm [ nT] Durati on [s]
1A 313,837 1,624,724 35553.6237 0
1R 313,842 1,624,723 35952.7422 1840
2A 313,842 1,624,723 32998.7754 1958
2R 313,842 1,624,723 32408.4254 3637
F1 313,842 1,624,723 32177.6049 8107
F2 313,842 1,624,723 34180.6022 8383
OPEN ACCESS IJG
M. NDIAYE, A. DIAGNE
3
Figure 3. Plot of base station data showing a decrease in
magnetic f ield value in time.
nal correction,
read
V
is the measured magnetic field at
time t and t0 is the starting time of the mag netic survey.
The IG RF fi e ld fo r S e ne gal,
IGRF
T
is 32755.1 nT [11].
We can therefore compute the magnetic anomaly
t
using the relation:
m IGRF
tT T∆= −
(2)
where Tm is the corrected value
corrected
V
. Therefore we
have:
corrected
32755.1tV∆= −
(3)
Finally we filtered the high frequency noise corres-
pond ing to soil surfac e ma gne tic va ria tions usi ng mo ving
average method [12]. The corrected and filtered data
were mapped in Surfer using natural neighbor interpola-
tion. The results are shown in Figure 4.
The magnetic anomaly map (Figure 4) shows a dipo-
lar magnetic anomaly with a maximum and a minimum
with geological structures slightly oriented NW-SE. In
fact, the magnetic anomaly shape depends on magnetic
inclination which depends on the location. When we are
out of the Earth poles, magnetic responses are always
dipolar in relation to magnetic inclination and the pres-
ence of two opposite poles in all magnetic objects. The
position of t he magnetic ob ject is sl ightly at the i nflexion
poi nt o f t he ano mal y p ro file f or a n inclinatio n of 30 ˚ [13].
Thus we interpreted the dashed black line as the limits of
the magnetic object with extension to the western side.
The depth of the magnetic object responsible for the
anomaly is determined by the tangent method [14] and
gives 61.5 meters.
To compare the magnetic anomaly data with other da-
tasets, we reproduced the dark line corresponding to
magnetic object limit (ie basaltic vein) on the geological
map ( Figure 5). The e xtension a nd the o rientatio n of the
magnetic anomaly seem to be relevant to geometry of the
unified vein as represented on the geological map. The
vein slopes in the eastern direction and may reach 61.5
meters depth under the dashed dark line.
Figure 4. Magnetic anomaly map obtained by interpolation
using nat ur al ne ig h bo r met ho d.
Figure 5. Repres entation of the interprete d magneti c object
limit (dashed black line) on geological map.
In the southern part of the magnetic ano maly map, we
observed a small area of around 1 hectare, with very high
anomaly values. This anomaly zone is unknown on ex-
isting geological maps and previous investigations. An
excavation or mechanical drilling of the area should lead
Eolianites
Sand and clay s
La ter itic cuirasse
Volca nic deposi t ( v e i n)
Inv estigate d ar ea
OPEN ACCESS IJG
M. NDIAYE, A. DIAGNE
4
to know the underground object responsible for the ano-
ma ly.
4. Conclusions
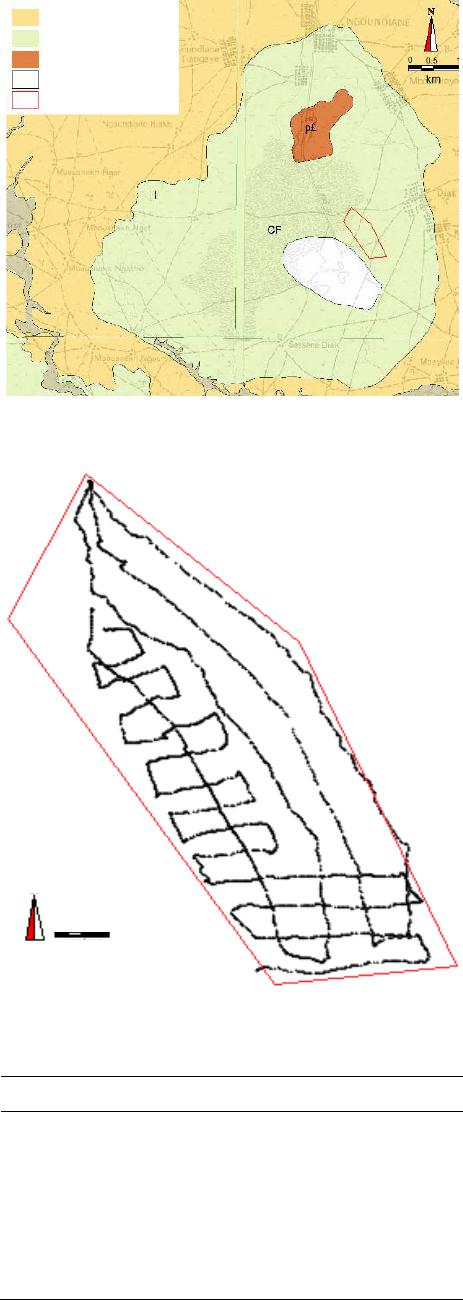
The geomagnetic investigation carried out using Iphone
4S magnetic sensor with Sensor Monitor application,
shows that the geometry and the depth of the basaltic
vein can be retrieved from the magnetic anomaly data.
The reliability of the result has been confirmed with ex-
isting geological maps.
It should be important in a next stage to interpret the
geomagnetic anomaly using inversion techniques in 2D
in order to retrieve a model of the magnetic body.
The method seems to be accurate in geometry and
depth deter mination but it will b e worth in the next steps
developing a standalone mobile application that should
process the acquired data, map the magnetic anomaly and
later give the depth and shape of the magnetic body.
REFERENCES
[1] W. D. Jones, “A Compass in Every Smartphone,IEEE
Spectrum, Vol. 47, No. 2, 2010, pp. 12-13.
http://dx.doi.org/10.1109/MSPEC.2010.5397765
[2] H. Ketabdar, A. Jahanbekam, K. A. Yuksel, T. Hirsch,
and A. A. Haji, “MagiMusic: Using Embedded Compass
(Magneti c) Sensor for Touch-Less Gesture Bas ed In terac-
tion with Digital Music Instruments in Mobile Devices,
Proceedings of the 5th International Conference on
Tangible, Embedded, and Embodied Interaction, Funchal,
22-26 January 2011, pp. 241-244.
[3] A. M. Pendrill and J. Rohlén, “Acceleratio n and Rotation
in a Pendulum Ride, Measured Using an iPhone 4,”
Physics Education, Vol. 46, No. 6, 2011, p. 676.
http://dx.doi.org/10.1088/0031-9120/46/6/001
[4] D. W. Oldenburg and Y. G. Li , “Inversion for Applied Geo-
physics: A Tutorial,Investigations in Geophysics, Vol.
13, 2005, 89-150.
http://dx.doi.org/10.1190/1.9781560801719.ch5
[5] Y. Ko, “Sensor Monitor,” Version 1.0.9, Itunes Strore,
2011.
https://itunes.apple.com/ca/app/sensor-monitor/id381075
251?mt=8
[6] P. Fraudet, “Contribution à L’étud e des Roches Éruptives
de la Région de Thiès (République du Sénégal),” Do-
cuments des Laboratoires de Géolo gi e de la Faculté des
Sciences de Lyon, 57, 1973, p. 15- 86.
[7] J. P. Cantagrel, G. Crevola, J. Lappartient and F. Tessier,
“Age Radiométriques pour le Volcanisme d e la Presqu’ile
du Cap-Vert K/Ar,” Rapport inedit Departement de
Geologie Université de Dakar and In: Plan Min Re-
publi que Senegal, 1980, p. 54.
[8] F. Tessier, “Contributions à la Stratigraphie et à la Palé-
ontologie de la Partie Ouest du Sénégal,” Thèse Univer-
sité de M arseille, et Bulletin de la Direction des Mines et
de la Géologie de lAfrique Occidentale Française, tome
2, No. 14, 1952, 544 p.
[9] A. Dia, “Contribution à l’étude des Caractéristiques
Pétrographiques, Pétrochimiques et Géotechniques des
Granulats Basaltiques de la Presqu’île du Cap vert et du
Plateau d e Thiès,” Thèse de Docto r at, Universi té de
Dakar, Faculté des Sci ences, Dakar, 1982, 181 p.
[10] Pasmi, “Carte Géologique de la zone D’activité du
Cap-Vert à 1/50 000, Formations Superficielles, Re-
présentation de la Feuille de Ndiaganiao,” Rapport GTR/
PASMI/0309-374, 2009.
[11] C. C. Finlay, S. Maus, C. D. Beggan, T. N. Bondar, A.
Chambodut, T. A. Ch ernova, A. Chulliat, V. P. Golovkov,
B. Hamilton, M. Hamoudi, R. Holme, G. Hulot, W.
Kuang, B. Langlais, V. Lesur, F. J. Lowes, H. Luhr, S.
Macmillan, M. Mandea, S. McLean, C. Manoj, M.
Menviel le, I. Michael is, N. Olsen, J. Ra uberg, M . Rother,
T. J. Sabaka, A. Tangborn, L. Toffner-Clausen, E.
Thebault, A. W. P. Thomson, I. Wardinski Z. Wei and T.
I. Zvereva, “International Geomagnetic Reference Field:
the Eleventh Generation. International Association of
Geomagnetism and Aeronomy, Working Group V-MOD,”
Geophysical Journal International, Vol. 183, No. 3, 2010,
pp. 1216-1230.
[12] E. W. Weisstein, “Moving Average,” MathWorld—A
Wolfram Web Resource, 2013.
http://mathworld.wolfram.com/MovingAverage.html
[13] L. L. Nettleton, “Gravity and Magnetics for Geologists
and Seismologists,” AAPG Bulletin, Vol. 46, No. 10,
1962, pp. 1815-1838.
[14] N. C. Steenl an d, “Oil Fileds and Aero magneti c Anomali es,”
Geophysics, Vol. 30, No. 5, 1965, pp. 706-739.
OPEN ACCESS IJG