L. HUA ET AL.
Copyright © 2013 SciRes. ENG
types were obtained from the sequence alignment files
provided by the 1000 Genomes Project for their pilot3
study (http://www.1000genomes.org). There is a total of
24487 SNPs, all of which are autosomal. A total of 200
replicates (phenotypes) of the trait simulation were car-
ried out in both data sets. In this paper, we onl y selected
the disease status (coded 0 = no, 1 = yes) of the first ten
replicates as dichotomous disease phenotype to perform
our analysi s .
2.2. Data Preprocessing
Pli nk soft ware can be used to calculate the associatio n of
genome-wide SNPs with the phenotypes. Here, all of
p-values were used to construct gene-phenotype associa-
tion matrix. This matrix is 24487 × 10 (SNPs × number
of phenotypes) matrix. We performed bioinformatics
analysis by using the bicluster method to this matrix in
the followin g step.
2.3. Applying Bicluster Method to
Gene-Phenotype Association Matrix
A bicluster is a subset of the SNPs exhibiting consistent
association strength over a subset of the phenotypes. We
applied Statistical-Algorithmic Method for Bicluster
Analysis (SAMBA) algorithm [5] to detect significant
biclusters from our constructed gene -phenotype associa-
tion matrix. This algorithm includes three phases. In the
first phase, the bipartite graph was formed and vertex
pair weights were calculated using weighting methods. In
the second phase, the hashing technique was applied to
find the hea viest bicliques in the graph. In the last phase,
a local procedure on the biclusters in each heap was per-
formed. We used Expander software (http://acgt.cs.tau.
ac.il/expander/) to implement this algorith m.
2.4. Functional Gene Mod ules Min ing in
Combination with KEGG Pathway
To se e if the gene s si gni fica ntl y aggr egat ing i n extracted,
biclusters are also aggregating in functional categories,
we performed a KEGG enrichment test. For a given
KEGG pathway, a gene is either in this pathway or not in
this pathway. We suppose that a total of N (=3205) genes
for the analyzed data are presented in KE GG pathways in
which a set of genes in biclusters are significantly ag-
gregated. We app lied GeneTrail software (http://genetr ail.
bioinf.uni-sb.de/) to identify functional gene modules
(gene biclusters) enriched on KEGG pathways signifi-
cantly. In t his stud y, to avoid the p ossible los s of the tr ue
positives, the multiple test correction was not performed
and the p-va lue quo ted sho uld be considered a s a heuris-
tic measure, useful as an indicator that roughly rates the
relative enrichment of significantly aggregated genes for
each KEGG pathway.
3. Resul ts
3.1. Constructing Gene-Phenotype Association
Matrix
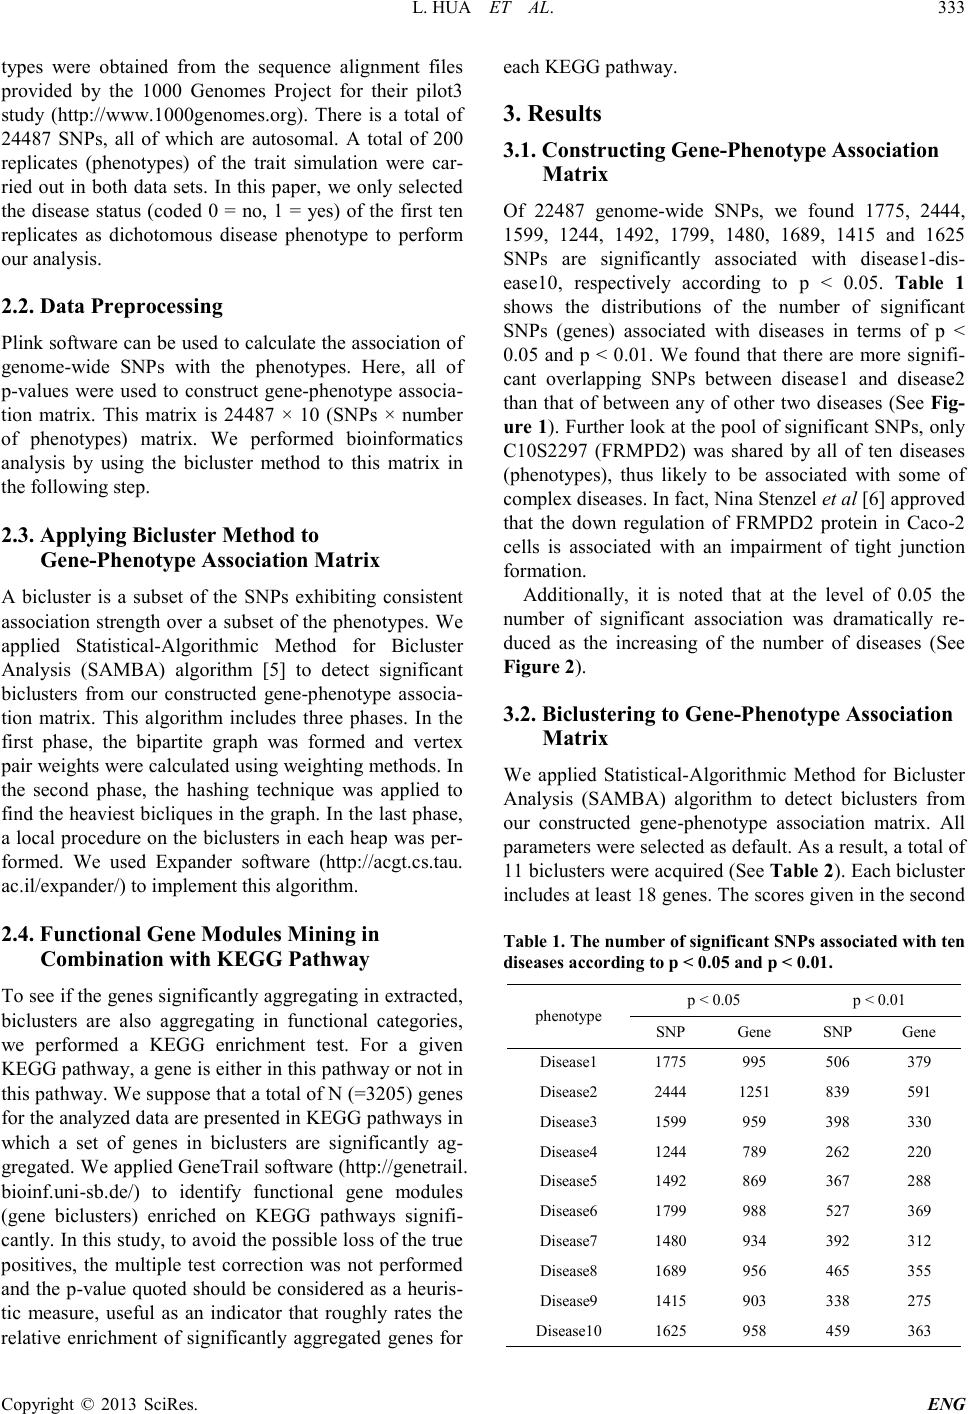
Of 22487 genome-wide SNPs, we found 1775, 2444,
1599, 1244, 1492, 1799, 1480, 1689, 1415 and 1625
SNPs are significantly associated with disease1-dis-
ease10, respectively according to p < 0.05. Table 1
shows the distributions of the number of significant
SNPs (genes) associated with diseases in terms of p <
0.05 and p < 0.01. We found that there are more signifi-
cant overlapping SNPs between disease1 and disease2
than that of between any o f other two diseases (See Fig-
ure 1). Furthe r loo k at the pool o f significa nt SNP s, only
C10S2297 (FRMPD2) was shared by all of ten diseases
(phenotypes), thus likely to be associated with some of
complex diseases. In fact, Nina Stenzel et al [6] approved
that the down regulation of FRMPD2 protein in Caco-2
cells is associated with an impairment of tight junction
formation.
Additionally, it is noted that at the level of 0.05 the
number of significant association was dramatically re-
duced as the increasing of the number of diseases (See
Figure 2).
3.2. Biclustering to Gene-Phenotype Association
Matrix
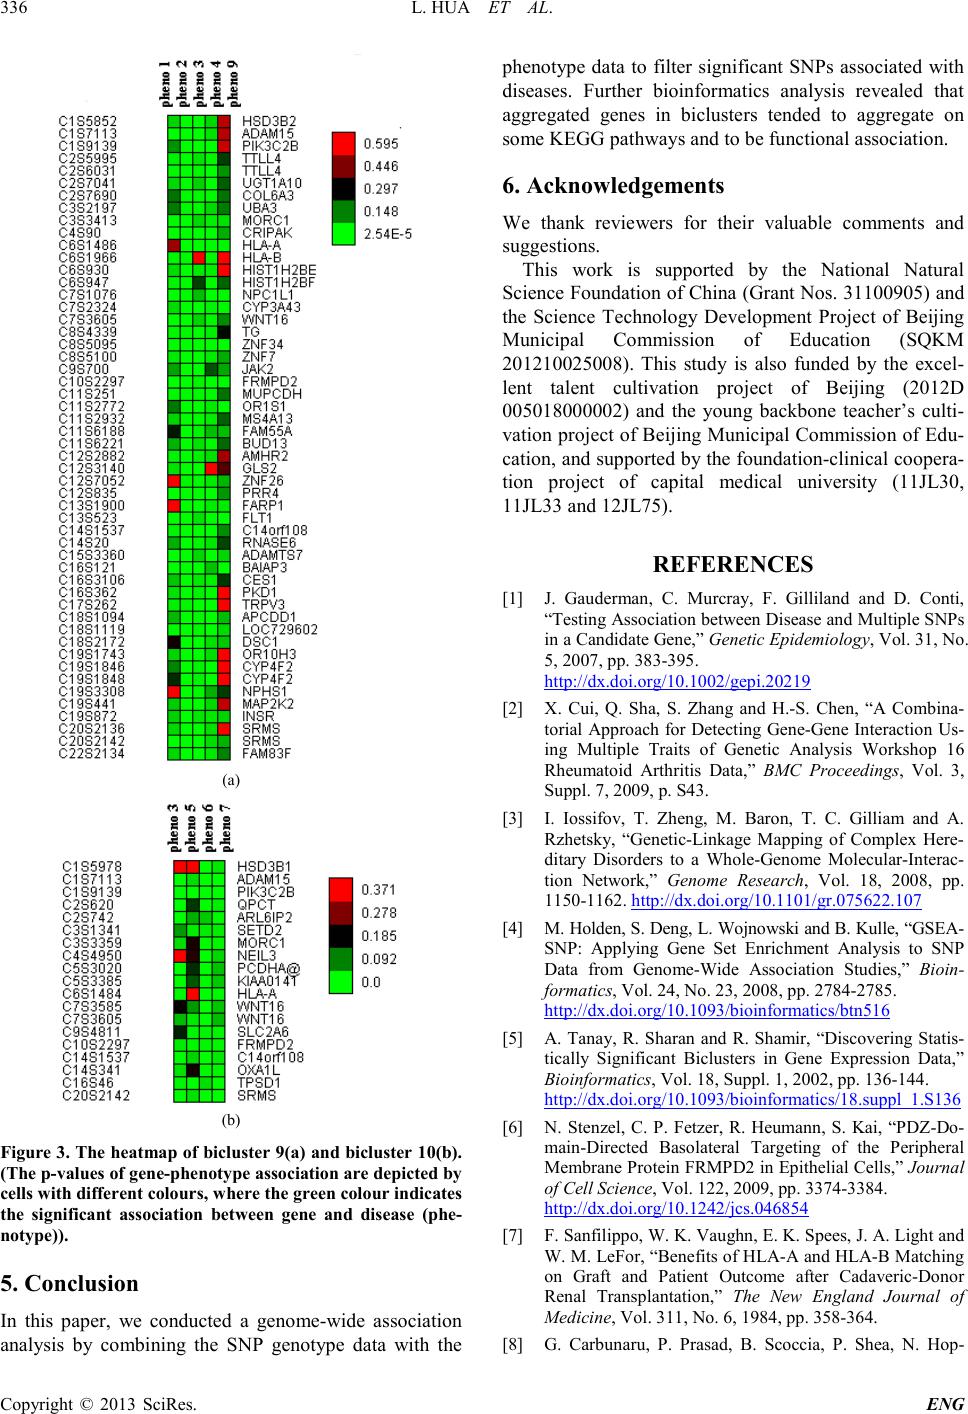
We applied Statistical-Algorithmic Method for Bicluster
Analysis (SAMBA) algorithm to detect biclusters from
our constructed gene-phenotype association matrix. All
parameters were selected as default. As a result, a total of
11 biclusters were acquired (See Tabl e 2). Each bicluster
includes at least 18 genes. Th e scores gi ve n i n t he se c ond
Table 1. The number of significant SNPs associated w ith ten
diseases according to p < 0.05 and p < 0.01.
phenotype p < 0.05 p < 0.01
SNP Gene SNP Gene
Dis ease1 1775 995 506 379
Dis ease2 2444 1251 839 591
Dis ease3 1599 959 398 330
Dis ease4 1244 789 262 220
Dis ease5 1492 869 367 288
Dis ease6 1799 988 527 369
Dis ease7 1480 934 392 312
Dis ease8 1689 956 465 355
Dis ease9 1415 903 338 275
Dis ease10 1625 958 459 363