Energy and Power Engineering, 2013, 5, 148-150
doi:10.4236/epe.2013.54B028 Published Online July 2013 (http://www.scirp.org/journal/epe)
Research on the Anti-corona Coating of the Power
Transmission Line Conductor
Ziqiang Xu, Ren Li
Hebei Provincial Key laboratory of Power Equipment Security Defense, North China Electric Power University, Baoding, China
Email: bao1986dan@163.com
Received April, 2013
ABSTRACT
An anti-corona method for the power transmission lines is proposed in this paper. The RTV coating is used as the an-
ti-corona coating, which is spaying onto the surface of the wearing conductor. The corona characteristic of the conduc-
tor test was done, and the corona onset voltage in crease after the spraying of the anti-co ro na layer, the coron a lo ss in the
same voltage decrease, which could prove the excellent effect of improving the corona characteristic of the conductor.
This anti-corona method will have great prospect, based on the background of the construction of UHV power trans-
mission lines.
Keywords: Corona Loss; EHV/UHV Power Transmission; RTV Coating; Anti-corona
1. Introduction
Corona discharge is a discharge phenomenon that the
surface electric field strength exceeds the breakdown
electric field strength. The breakdown electric field
strength is generally 2 0-30 kV/cm, when the electric field
strength exceeds this value, the discharge sound could be
heard, and the smell of ozone, and the bluish velvet light
could be seen in the surrounding of the conductor. The
ions generated by corona discharge move fro and to the
conductor by the alternating electric field, and light and
radio interference will be generated in the meantime. The
above effect will cause a consumption of energy, which
is called corona loss. The calculation of corona loss is the
primary work in the optimum transmission line design.
Especially the UHV long distance power transmission in
the high altitude areas, the calculation of the corona loss
plays a decisive role [1-3].
Nowadays, the research on UHV and EHV power
transmission is in the studying the characteristic step.
Measures like enlarging the diameter of the conductor,
enlarging the bundle space or raise the height of the
tower can reduce the corona loss of power transmission
line, but on the other hand, the measures themselves will
cause a lot of money. And for the conductors with de-
fects, it is really unrealistic to replace the original con-
ductors in large scale. It is urgently need to find a new
way to reduce the corona loss of the UHV/EHV power
transmission lines. The application object of the an-
ti-corona coating is the windings of the power generator,
which is different from the high voltage level power
transmission line [4-5].
2. Selection of the Coating
The research on the an ti-corona coating is relatively l ittle,
the research mainly aims at the anti-corona of the wind-
ings of the power generator. After overall consider of the
performance of the coating and the cost, the anti-corona
coating should have the following characteristics: low
cost, the easy availability and no harm to the environ-
ment.
RTV coating is a widely used coating for its good heat
and cold resistant and electric insulation property. The
good hydrophobicity and migration of hydrophobicity
make it have the performance of pollution flashover cha-
racteristics, which is the best plan in solving the problem
of pollution flashover of the outer insulation of the power
equipment.
How to put the coating on the surface of the conductor
is another problem, because the shape of the coating will
greatly influence the effect of anti-corona. The methods
in GBT4585.2-91 artificial po llution test of the high vol-
tage insulators in AC systems: quantitative brush method,
pouring method, spray dyeing method, etc. the quantita-
tive brush method and pouring method could not make
the surface of the conductor un iform, so in the end spray
dyeing method is taken. The conductor with and with no
coating are shown in Figure 1 and F igure 2.
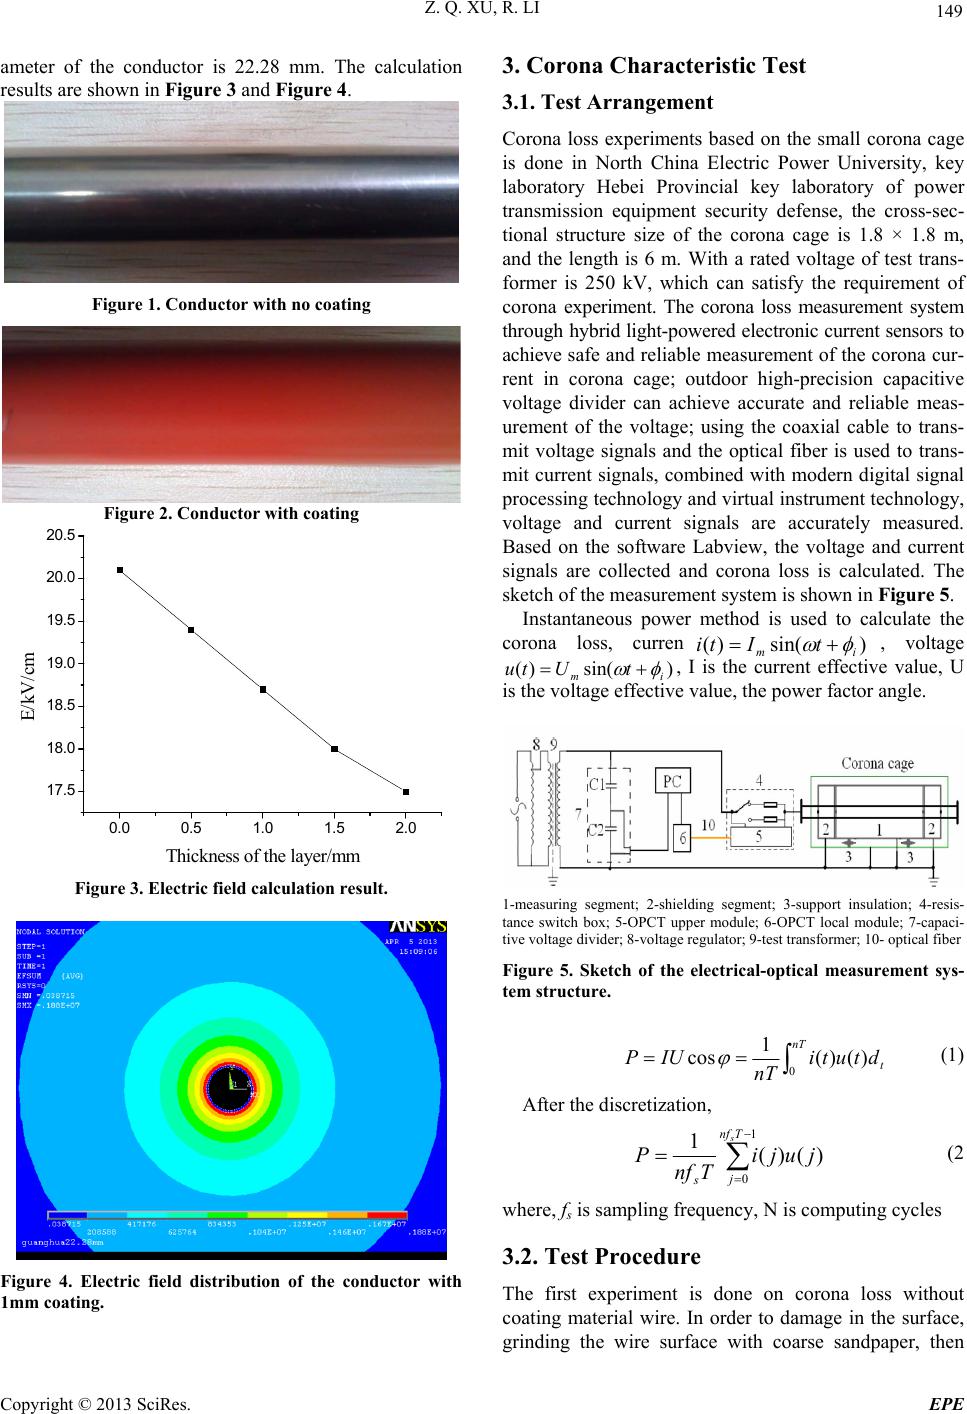
The surface electric field strength is calculated with
the finite element method with the software ANSYS, the
electric field strength decrease with the increase of the
thickness of the layer, the relative dielectric constant is 3 ,
and the electric field strength condition is much im-
proved after spraying the anti-corona coating. The di-
Copyright © 2013 SciRes. EPE
Z. Q. XU, R. LI 149
ameter of the conductor is 22.28 mm. The calculation
results are shown in Figure 3 and Figure 4.
Figure 1. Conductor with no coating
Figure 2. Conductor with coating
0.0 0.5 1.01.5 2.0
17.5
18.0
18.5
19.0
19.5
20.0
20.5
E/kV/cm
Thickness of the la
y
er/m
m
Figure 3. Electric field calculation result.
Figure 4. Electric field distribution of the conductor with
1mm coating.
3. Corona Characteristic Test
3.1. Test Arrangement
Corona loss experiments based on the small corona cage
is done in North China Electric Power University, key
laboratory Hebei Provincial key laboratory of power
transmission equipment security defense, the cross-sec-
tional structure size of the corona cage is 1.8 × 1.8 m,
and the length is 6 m. With a rated voltage of test trans-
former is 250 kV, which can satisfy the requirement of
corona experiment. The corona loss measurement system
through hybrid light-powered electronic current sensors to
achieve safe and reliable measurement of the corona cur-
rent in corona cage; outdoor high-precision capacitive
voltage divider can achieve accurate and reliable meas-
urement of the voltage; using the coaxial cable to trans-
mit voltage signals and the optical fiber is used to trans-
mit current signals, combined with modern digital signal
processing technology and virtual instrument technology,
voltage and current signals are accurately measured.
Based on the software Labview, the voltage and current
signals are collected and corona loss is calculated. The
sketch of the measurement system is shown in F igure 5.
Instantaneous power method is used to calculate the
corona loss, curren)sin()( im tIti
 , voltage
im , I is the current effective value, U
is the voltage effective value, the power factor angle.
)sin()( tUtu


1-measuring segment; 2-shielding segment; 3-support insulation; 4-resis-
tance switch box; 5-OPCT upper module; 6-OPCT local module; 7-capaci-
tive voltage d ivider; 8-v oltage regulator; 9-test transformer; 10- optical fiber
Figure 5. Sketch of the electrical-optical measurement sys-
tem structure.
 nT
t
dtuti
n
T
IUP 0)()(
1
cos
(1)
After the discretization,
1
0
)()(
1Tnf
j
s
sjuji
Tnf
P (2
where, fs is sampling frequency, N is computing cycles
3.2. Test Procedure
The first experiment is done on corona loss without
coating material wire. In order to damage in the surface,
grinding the wire surface with coarse sandpaper, then
Copyright © 2013 SciRes. EPE
Z. Q. XU, R. LI
Copyright © 2013 SciRes. EPE
150
4. Conclusions
spray dyeing coating on the wire and the thickness of the
layer is measured by vernier caliper, coating thickness is
about 1 mm, and the experiment is done on the conductor
with coating and without coating.
An anti-corona method is proposed in this paper by
spaying the RTV coating on the wear conductor.
The electric field strength with the coating is less than
that with no coating, and the thicker the coating is, the
less the electric field strength becomes.
The measurement results are shown in Figure 6. As
can be seen, conductor corona loss decreases with the
increase of coating thickness. From the point of the co-
rona loss changes, the corona inception voltage value can
be seen roughly, in the corona inception voltage can be
found to increase with the wire thickness. The anti-co-
rona coating effect is obvious; the thickness of the coat-
ing should depend on the practical situation of the con-
ductor.
The corona loss of the conductor with RTV coating is
less than that with no coating, which means the method
proposed in this paper is effective.
REFERENCES
[1] Z. Y. Liu: “Ultra-high Voltage Grid”, Beijing: China
Economic Publishing House, 2005, pp. 253-256.
[2] J. J. Clade and C. H. Gary: “Predetermination of Corona
Losses under Rain: Experimental Interpreting and Check-
ing of a Method to Calculate Corona Losses,” IEEE
Transactions on PAS, Vol. 89, No. 5, 1970, pp. 853-860.
[3] P. S. Maruvada: “Corona performance of high-voltage
transmission lines”, London, UK: Research Studies Press
Ltd, 2000.
[4] Y. P. Liu, S. H. You, Q. F. Wan, et al., “Design and Re-
alization of AC UHV Corona Loss Monitoring System,”
High Voltage Engineering, Vol. 34, No. 9, 2008, pp.
1797-1801.
[5] F. C. Lu, S. H. You, Y. P. Li u, Q. F. Wan and Z. B. Zhao,
“AC Conductors’ Corona-loss Calculation and Analysis,”
IEEE Transactions on Power Delivery, Vol. 27, No. 2,
2012, pp. 877-885.doi:10.1109/TPWRD.2012.2183681
Figure 6. Measurement results.