Paper Menu >>
Journal Menu >>
 Journal of Global Positioning Systems (2006) Vol. 5, No. 1-2:52-57 Spatio-temporal Characteristics of the Ionospheric TEC Variation for GPSnet-based Real-time Positioning in Victoria Suqin Wu[1], Kefei Zhang[1], Yunbin Yuan[1,2] and Falin Wu[1] [1] School of Mathematical and Geospatial Sciences, RMIT University, GPO Box 2476V, Victoria 3001, Australia [2] Institute of Geodesy and Geophysics, Chinese Academy of Sciences, 54 XuDong Road, Wuhan 43007, China Abstract. The atmospheric effects, especially the ionosphere, are the key limiting factors for real-time high accuracy positioning using the network RTK technique with a medium-to-long-range baseline separation. To investigate suitable approaches to improve ionospheric modeling towards a real-time CM- level positioning using the Victorian continuously operating reference stations network (i.e. GPSnet) system under various ionospheric conditions, this paper investigates both temporal and spatial variations of the ionospheric total electrons content (TEC) over Victoria through analysing GPS dual frequency data from the GPSnet over a period of two years. Diurnal and seasonal ionospheric variations, and winter anomaly of the ionosphere in Victoria are investigated based on GPS- derived TEC values. Results suggest that the temporal and spatial TEC variations over Victoria are complicated. This complex nature of the ionosphere suggests that it is a challenging task to precisely represent the behaviours of the ionosphere if only a single and simple ionospheric model is used for all the time for RTK uses. It is therefore, necessary to develop new mathematical models or new procedures for precise representation of the ionospheric TEC variations in Victoria using a long period of GPS dual frequency observations, particularly the predictability of the ionosphere changes. It is expected that the new approach will provide a better guidance for the state-wide network-RTK solutions. Keywords: Atmospheric modeling, Ionospheric delay, Ionospheric modeling, TEC, Network RTK 1 Introduction It is well known that the rapid development of GPS- based location based services (LBS) has opened new avenues for ubiquitous positioning and can potentially revolutionize almost all geospatial practice, such as surveying, mapping, geographical information systems, photogrammetry, risk management and emergency response, vehicle and asset tracking, machine control, workforce management and logistics. The key background facility of the LBS is a backbone ground- based GPS infrastructure - Continuously Operating Reference Stations (CORS). Located on the southern seaboard, Victoria is the second most populous State in Australia. Currently, a Victorian network RTK system is under intensive development and it will provide an integration of the post-processing service currently available and the new real-time network RTK service across the entire state (Zhang et al., 2006; Roberts et al., 2004). The main potential barriers to this development are long base station separations and the atmospheric effects, especially the ionospheric effects (Fotopoulos and Cannon, 2001; Gao and Liu, 2002; Wyllie and Zhang, 2003). The key issue to achieve real-time CM-level positioning accuracy for Victorian network RTK is, therefore, the precise modeling of the atmospheric effects, especially the ionospheric delay and variability under various atmospheric conditions (Zhang and Robert, 2003; Han, 1997). It is necessary to carry out systematic research of atmospheric effects in Victoria and characterise the nature and fine structure of the local/regional ionosphere (Yuan, 2002; Huo et al., 2005). This paper investigates approaches to improve the precision of ionospheric modeling for real-time positioning. A detailed analysis of temporal and spatial variations of the ionospheric TEC over Victoria is conducted using  Wu et al.: Spatio-temporal characteristics of the ionospheric TEC variation for GPSnet-based real-time positioning in Victoria 53 dual frequency GPSnet data over a period of two years. The analysis includes diurnal, seasonal and annual variations together with winter anomalies of the ionosphere based on a series of GPS-based TEC estimates. A complex ionospheric TEC pattern over Victoria is revealed. This demonstrates the difficulty to precisely represent the local/regional ionospheric behaviours in Victoria if only a simple, single ionospheric model is used. As a result, new development of adaptable mathematical models and algorithms is necessary for a precise representation and ultimate removal of the ionospheric effects. 2 Methodologies The ionosphere is part of the atmosphere and located approximately between 60 km to 1000 km above the Earth’s surface. The ionosphere is usually “condensed” onto a very thin spherical shell at a certain altitude (H) between 300 km and 400 km above the Earth’s surface in GPS research and applications communities. This is because the majority of the ionosphere free electrons are distributed at these altitudes. In this research, a thin ionospheric shell at a fixed altitude of 350 km is adopted (i.e. H=350 km). The vertical TEC is parameterized by using a spherical harmonics (SH) formula which is referred to a solar- geographical framework, and a trigonometric single- layer model (SLM) mapping function (i.e. the cosine function of the variable zenith angle) is used to project the vertical TEC onto slant directions along the line-of- sight between a receiver and a satellite (Odijk, 2002; Komjathy, 1997; Hofmann-Wellenhof et al., 1997). A 3 degrees and orders spherical harmonics (with 16 unknown parameters/coefficients to be estimated) is adopted in the calculation. GPS dual frequency data is used for the analyses. The unknown ionospheric parameters, along with the satellite and station’s instrumental biases (IBs), are estimated using the least squares technique. The IBs for the same base station and satellite pair are considered as a constant value for a day as both the receiver and the satellite hardware is relatively stable in the period of one day. As for the strategy of data selection, calculation, and analysis, certain periods of the GPSnet data are selected and processed to calculate daily, hourly, and/or two- hourly vertical TEC values for every base station to analyse temporal ionosphere variations. The temporal ionosphere variations include diurnal variations, seasonal variations and winter anomalies. To analyse the spatial variations of the ionosphere over Victoria, the GPS data from 13 GPSnet stations are used for the calculation and analyses. Figure 1 shows the current constellation and status of rural, regional and metropolitan GPSnet stations (Asmussen, 2005). In this paper, a preliminary investigation using the IGS and GPSnet co-located station called MOBS in Melbourne is conducted for the temporal ionosphere variations. The computation procedures and results using the MOBS data will be presented. This forms the first stage of the research. Detailed analyses over other GPSnet stations will be conducted at the second stage of the research, and real-time predictability and modelling and correction generation and distribution will form the third stage of the research. Fig. 1 GPSnet base station network at rural (top) and metropolitan areas (bottom) (Asmussen, 2005) 3 Data processing, results and analyses 3.1 The GPSnet -Victorian CORS system GPSnet is a state-wide CORS geospatial infrastructure that provides high accuracy and homogenous location information in Victoria primarily for post-processing service (Millner et al., 2004). It also provides the first state-wide DGPS correction service capable of achieving sub-meter accuracy and single base station RTK service within a nominal 20 km of selected GPSnet stations in Australia (see Fig. 1). GPSnet correction information is available from wireless Internet enabled devices and forms part of the integrated Vicmap products and services (Millner et al., 2004). The high accuracy network RTK correction is obtained with a suitable dual frequency GPS receiver via an internet connection. The simplest method of receiving the correction signals 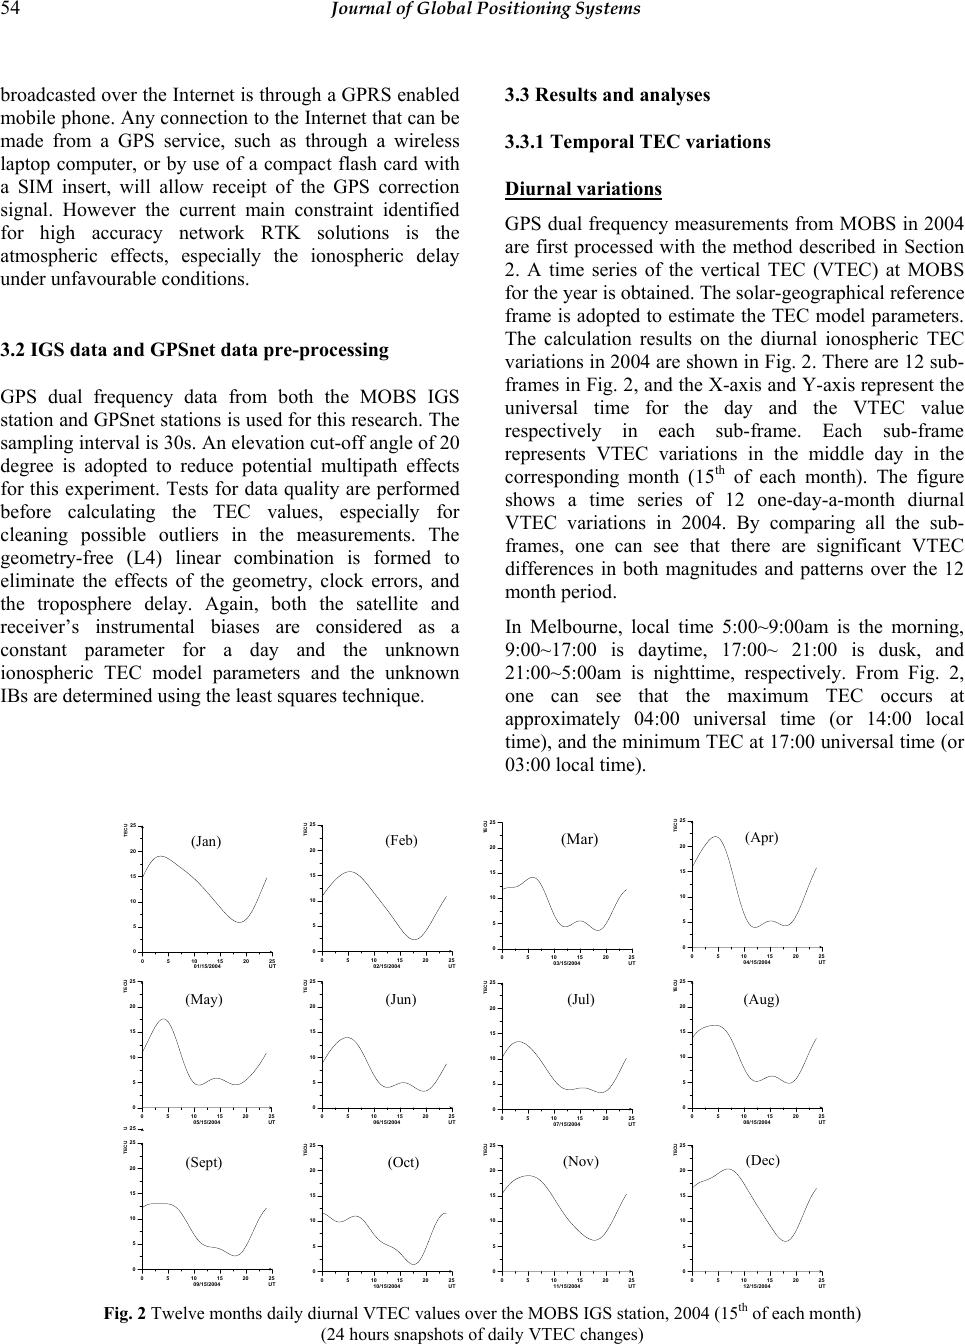 54 Journal of Global Positioning Systems broadcasted over the Internet is through a GPRS enabled mobile phone. Any connection to the Internet that can be made from a GPS service, such as through a wireless laptop computer, or by use of a compact flash card with a SIM insert, will allow receipt of the GPS correction signal. However the current main constraint identified for high accuracy network RTK solutions is the atmospheric effects, especially the ionospheric delay under unfavourable conditions. 3.2 IGS data and GPSnet data pre-processing GPS dual frequency data from both the MOBS IGS station and GPSnet stations is used for this research. The sampling interval is 30s. An elevation cut-off angle of 20 degree is adopted to reduce potential multipath effects for this experiment. Tests for data quality are performed before calculating the TEC values, especially for cleaning possible outliers in the measurements. The geometry-free (L4) linear combination is formed to eliminate the effects of the geometry, clock errors, and the troposphere delay. Again, both the satellite and receiver’s instrumental biases are considered as a constant parameter for a day and the unknown ionospheric TEC model parameters and the unknown IBs are determined using the least squares technique. 3.3 Results and analyses 3.3.1 Temporal TEC variations Diurnal variations GPS dual frequency measurements from MOBS in 2004 are first processed with the method described in Section 2. A time series of the vertical TEC (VTEC) at MOBS for the year is obtained. The solar-geographical reference frame is adopted to estimate the TEC model parameters. The calculation results on the diurnal ionospheric TEC variations in 2004 are shown in Fig. 2. There are 12 sub- frames in Fig. 2, and the X-axis and Y-axis represent the universal time for the day and the VTEC value respectively in each sub-frame. Each sub-frame represents VTEC variations in the middle day in the corresponding month (15th of each month). The figure shows a time series of 12 one-day-a-month diurnal VTEC variations in 2004. By comparing all the sub- frames, one can see that there are significant VTEC differences in both magnitudes and patterns over the 12 month period. In Melbourne, local time 5:00~9:00am is the morning, 9:00~17:00 is daytime, 17:00~ 21:00 is dusk, and 21:00~5:00am is nighttime, respectively. From Fig. 2, one can see that the maximum TEC occurs at approximately 04:00 universal time (or 14:00 local time), and the minimum TEC at 17:00 universal time (or 03:00 local time). Fig. 2 Twelve months daily diurnal VTEC values over the MOBS IGS station, 2004 (15th of each month) (24 hours snapshots of daily VTEC changes) 0510 15 20 25 07 / 15 / 200 4 U T 0 5 10 15 20 25 TECU 0510 15 20 25 08 / 15 / 200 4 U T 0 5 10 15 20 25 TECU 0510 15 20 25 09 / 15 / 200 4 U T 0 5 10 15 20 25 TECU 0510 15 20 25 10 / 15 / 200 4 U T 0 5 10 15 20 25 TECU 0510 15 20 25 11 / 15 / 200 4 U T 0 5 10 15 20 25 TECU 0510 15 20 25 12 / 15 / 200 4 U T 0 5 10 15 20 25 TECU 0510 15 20 25 01 / 15 / 200 4 U T 0 5 10 15 20 25 TECU 0510 15 20 25 02 / 15 / 200 4 U T 0 5 10 15 20 25 TECU 0510 15 20 25 03 / 15 / 200 4 U T 0 5 10 15 20 25 TECU 0510 15 20 25 05 / 15 / 200 4 U T 0 5 10 15 20 25 TECU 25 U 0510 15 20 25 06 / 15 / 200 4 U T 0 5 10 15 20 25 TECU 0510 15 20 25 0 4 / 15 / 200 4 U T 0 5 10 15 20 25 TECU (Oct) (Sept) (Nov) (Dec) (May) (Jun) (Jul) (Aug) (Jan) (Feb) (Mar) (Apr)  Wu et al.: Spatio-temporal characteristics of the ionospheric TEC variation for GPSnet-based real-time positioning in Victoria 55 The daytime TEC values are obviously larger than the nighttime values. However, the occurrence time of the maximum/minimum ionospheric TEC values varies with seasons. Also, the diurnal ionospheric TEC variations associated with different seasons and months, and both daytime and nighttime ionospheric TEC variations are different. This roughly represents the characteristics of the variations of the ionospheric TEC (and hence the ionospheric variations) over Victoria. A more detailed result can be found in Fig. 3 for diurnal variations of the ionospheric VTEC over MOBS in 2004. Seasonal variations and winter anomalies Fig. 3 shows the TEC values obtained from the MOBS station in 2004. In this figure, X-axis and Y-axis denote the universal time and the months respectively. This result can be considered as an approximate representation of a time series of the corresponding TEC snapshots for metropolitan Melbourne and regional Victoria. It shows both diurnal and seasonal ionospheric TEC variations in 2004. From Fig. 3, one can see that in the spring (September, October and November) and autumn (March, April and May) the daytime ionospheric TEC values are, generally speaking, greater than that of the other two seasons: summer (December, January and February) and winter (June, July and August). However in the summer season, the TEC values in December are as great as the Spring and Autumn and much greater than that of the other two months of the same season (Jan., Feb.), One can also see, from each day of November and December, high TEC values in a day last longer than that of all the rest months. The results from the winter season shows that the majority days of the TEC values are very small and much smaller than that of the other three seasons. However, the peak values occur in the winter season in late July and last for a few days. This phenomenon is called winter anomaly. It is also apparent that the winter anomaly is not the nighttime phenomenon but the daytime phenomenon. The corresponding detailed results for July are plotted in Fig. 4, which illustrates obvious different diurnal variations among all days in this month. Fig. 5 shows two types of sunspot number, daily and monthly sunspot respectively. By comparing the results above with Fig. 5, it can be found that there exist relatively large sunspot numbers in July 2004 (see the arrow in Fig. 5) in comparison with other months of this year. What is interesting is that, from Fig. 3 it can also be seen that winter anomaly happened to be in the period of July as well. However, this may be just coincident as it is not conclusive. According to Pulido and Garat (1997) winter anomaly is not necessarily correlated with solar activity (or sunspot number), especially in southern hemispheres. Fig. 3 Diurnal and seasonal ionospheric TEC variations at MOBS station in 2004 07/01/04 07/06/0407/11/04 07/16/04 07/21/04 07/26/04 07/31/04 MM/DD/YEAR 0 10 20 30 40 TECU Fig. 4 Detailed diurnal variations of the ionospheric VTEC at MOBS IGS station during July, 2004 2003 2004 2005 2006 0 40 80 120 160 200 2003 2004 2005 2006 Year 0 40 80 120 160 200 Sunspot Number Daily Sunspot Number Monthly Sunspot Number Fig. 5 Sunspot number over the last three years from May 2003 to September 2005 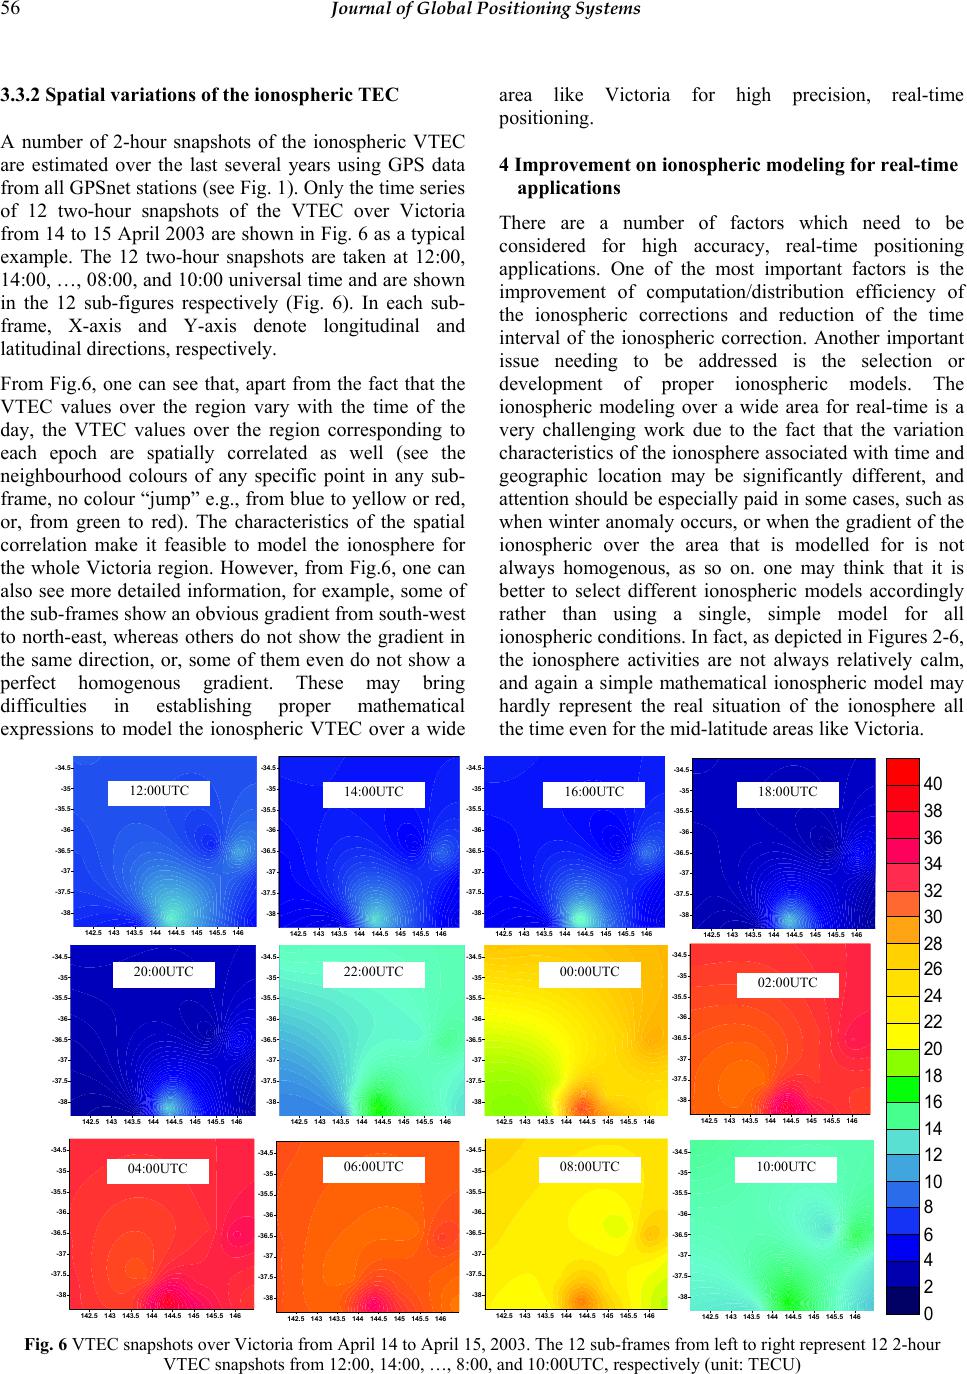 56 Journal of Global Positioning Systems 3.3.2 Spatial variations of the ionospheric TEC A number of 2-hour snapshots of the ionospheric VTEC are estimated over the last several years using GPS data from all GPSnet stations (see Fig. 1). Only the time series of 12 two-hour snapshots of the VTEC over Victoria from 14 to 15 April 2003 are shown in Fig. 6 as a typical example. The 12 two-hour snapshots are taken at 12:00, 14:00, …, 08:00, and 10:00 universal time and are shown in the 12 sub-figures respectively (Fig. 6). In each sub- frame, X-axis and Y-axis denote longitudinal and latitudinal directions, respectively. From Fig.6, one can see that, apart from the fact that the VTEC values over the region vary with the time of the day, the VTEC values over the region corresponding to each epoch are spatially correlated as well (see the neighbourhood colours of any specific point in any sub- frame, no colour “jump” e.g., from blue to yellow or red, or, from green to red). The characteristics of the spatial correlation make it feasible to model the ionosphere for the whole Victoria region. However, from Fig.6, one can also see more detailed information, for example, some of the sub-frames show an obvious gradient from south-west to north-east, whereas others do not show the gradient in the same direction, or, some of them even do not show a perfect homogenous gradient. These may bring difficulties in establishing proper mathematical expressions to model the ionospheric VTEC over a wide area like Victoria for high precision, real-time positioning. 4 Improvement on ionospheric modeling for real-time applications There are a number of factors which need to be considered for high accuracy, real-time positioning applications. One of the most important factors is the improvement of computation/distribution efficiency of the ionospheric corrections and reduction of the time interval of the ionospheric correction. Another important issue needing to be addressed is the selection or development of proper ionospheric models. The ionospheric modeling over a wide area for real-time is a very challenging work due to the fact that the variation characteristics of the ionosphere associated with time and geographic location may be significantly different, and attention should be especially paid in some cases, such as when winter anomaly occurs, or when the gradient of the ionospheric over the area that is modelled for is not always homogenous, as so on. one may think that it is better to select different ionospheric models accordingly rather than using a single, simple model for all ionospheric conditions. In fact, as depicted in Figures 2-6, the ionosphere activities are not always relatively calm, and again a simple mathematical ionospheric model may hardly represent the real situation of the ionosphere all the time even for the mid-latitude areas like Victoria. Fig. 6 VTEC snapshots over Victoria from April 14 to April 15, 2003. The 12 sub-frames from left to right represent 12 2-hour VTEC snapshots from 12:00, 14:00, …, 8:00, and 10:00UTC, respectively (unit: TECU) 142.5 14 3 143.5 144 144. 5 145 145.5 14 6 -38 -37.5 -37 -36.5 -36 -35.5 -35 -34.5 142. 5 143 143. 5 144 144. 5 145145. 5 14 6 -38 -37.5 -37 -36.5 -36 -35.5 -35 -34.5 142. 5 143143. 5 144 144. 5 14 5 145 . 5 14 6 -38 -37.5 -37 -36.5 -36 -35.5 -35 -34.5 142. 5 143143. 5 144 144. 5 14 5 145 . 5 14 6 -38 -37.5 -37 -36.5 -36 -35.5 -35 -34.5 142.5 14 3 143.5 144 144. 5 145 145.5 14 6 -38 -37.5 -37 -36.5 -36 -35.5 -35 -34.5 142. 5 143 143. 5 144 144. 5 145145. 5 14 6 -38 -37.5 -37 -36.5 -36 -35.5 -35 -34.5 142. 5 143143. 5 144 144. 5 14 5 145 . 5 14 6 -38 -37.5 -37 -36.5 -36 -35.5 -35 -34.5 142.5 14 3 143.5 144 144. 5 145 145.5 14 6 -38 -37.5 -37 -36.5 -36 -35.5 -35 -34.5 142.5 14 3 143.5 144 144. 5 145 145.5 14 6 -38 -37.5 -37 -36.5 -36 -35.5 -35 -34.5 142. 5 143 143. 5 144 144. 5 145145. 5 14 6 -38 -37.5 -37 -36.5 -36 -35.5 -35 -34.5 142.5 14 3 143.5 144 144. 5 145 145.5 14 6 -38 -37.5 -37 -36.5 -36 -35.5 -35 -34.5 142.5 14 3 143.5 144 144. 5 145 145.5 14 6 -38 -37.5 -37 -36.5 -36 -35.5 -35 -34.5 0 2 4 6 8 10 12 14 16 18 20 22 24 26 28 30 32 34 36 38 40 12:00UTC 14:00UTC 16:00UTC 18:00UTC 20:00UTC 22:00UTC 00:00UTC 02:00UTC 04:00UTC 06:00UTC 08:00UTC 10:00UTC  Wu et al.: Spatio-temporal characteristics of the ionospheric TEC variation for GPSnet-based real-time positioning in Victoria 57 5 Conclusions This preliminary research investigates both temporal and spatial characteristics of the ionospheric TEC variations in the State of Victoria based on GPS measurements. The purpose of this research is to investigate an appropriate model / algorithm / approach for improving local ionospheric modelling to support network RTK service for wide areas. Diurnal, seasonal variations and winter anomalies of the regional ionosphere in Victoria are investigated and preliminary results are given. It is concluded that proper ionospheric modeling are needed to support regional network RTK positioning over a wide area. The new approaches may involve a selection of different ionospheric mathematical models for different ionosphere variations of different time of day, time of month, time of year. The availability of the long observation data from GPSnet is a rich resource and an ideal testbed for further development of network RTK algorithms. It is essential to study the regular and irregular variations, medium and long term trends, and statistical properties of irregular variations which will provide a detailed picture of super-short (mins) to short (1 hour) scale ionospheric changes. We are aiming to develop new network RTK algorithms that are capable of providing reliable, seamless, high-accuracy positioning services across the state of Victoria. Acknowledgements This research is supported by the Victoria Partnership for Advanced Computing through its e-Research Grant Scheme (Round 9) and The Australian Research Council grant through its Linkage Scheme (LP0669259 and LP0455170). The research consortium (LP0455170) consists of RMIT University (leading institution), University of NSW, University of Melbourne, Department of Sustainability and Environment (Victoria) and Department of Lands (NSW). The research consortium (LP04669259) consists of RMIT University and EOS Space Systems Pty Limited. Dr Ron Grenfell from the School of Mathematical and Geospatial Sciences, RMIT University is thanked for his contribution for an early version of the paper which was presented at GPS/GNSS2005 HK conference. References Asmussen H. (2005) An Introduction of GPSnet, VICpos & MELBpos, invited presentation at School of Mathematical and Geospatial Sciences, RMIT University, 18 Oct. Fotopoulos G., Cannon M. (2001) An Overview of Multi- reference Station Methods for Cm-level Positioning, GPS Solutions, 4(3):1-10. Gao Y., Liu Z. (2002) Precise Ionosphere Modeling Using Regional GPS Network Data, Journal of Global Positioning Systems, 1(1): 18-24. Han S. (1997) Carrier Phase-Based Long-range GPS Kinematic Positioning, PhD thesis, School of Geomatics Engineering, The University of New South Wales, Sydney, Australia. Hofmann-Wellenhof B., Lichtenegger H. and Collins J. (1997) GPS Theory and Practice, Springer Wien New York, Fourth Edition. Huo X., Yuan Y., Ou J., Wen D. and Luo X. (2005) The Diurnal Variations, Seasonal Variations and Winter Anomalies of the Ionospheric TEC Based on GPS Data in China. Progress in Natural Science, 15(1): 56-60. Komjathy A. (1997) Global Ionospheric Total Electron Content Mapping Using the Global Positioning System, PhD thesis, Technical Report No.188, Department of Geodesy and Geomatics Engineering, the University of New Brunswick, New Brunswick. Millner J., Hale M., Standen P. and Talbot N. (2004) The Development and Enhancement of GPS/GNSS Infrastructure to Support Location Based Service Positioning Systems in Victoria, Proceedings of GPS/GNSS conference, Sydney, 16 pages. Odijk D. (2002) Fast Precise GPS Positioning in the Presence of Ionospheric Delays, PhD thesis, Dept of Mathematical Geodesy and Positioning, Delft University of Technology, Delft, The Netherlands. Pulido A.M. and Garat E.F. (1997) The Ionospheric F2 Region Winter Anomaly and Its Dependence on Solar Activity in the Northern and Southern Hemispheres, GEOFISICA INTERNACIONAL, 36 (2), also available at http://serpiente.dgsca.unam.mx/ serv_hem/revistas/fisica/1997/02/martnez.html. Roberts, C., Zhang, K., Rizos, C., Kealy, A. and Ge, L. (2004) Real-time Atmospheric Modelling for Centimetre-level Positioning Based on Global Navigation Satellite System (GNSS) Continuously Operating Reference Station Networks, Journal of GPS, Vol.3, No.1-2, pp.218-225. Yuan Y. (2002) Study on Theories and Methods of Correcting Ionospheric Delay and Monitoring, PhD thesis, Institute of Geodes and Geophysics, Chinese Academy of Science. Wyllie S. and Zhang K. (2003) A Comparison of Ionospheric Models for Precise Positioning in Victoria, Proceedings of the 6th International Symposium on Satellite Navigation Technology, Melbourne, Australia, pp1-18, Zhang K. and Roberts C. (2003) Network-based Real-time Kinematic Positioning System: Current Research in Australia, Proceedings of Geoinformatics and Surveying Conference, pp 1~12. Zhang K., Wu F., Wu S., Rizos C., Roberts C., Ge L., Yan T., Gordini C., Kealy A., Hale M., Ramm P., Asmussen H., Kinlyside D. and Harcombe P. (2006) Sparse or Dense: Challenges of Australian Network RTK. Proceedings of IGNSS Conference 2006, July 18-21, 2006, Queensland, Australia. |