Paper Menu >>
Journal Menu >>
 Journal of Global Positioning Systems (2004) Vol. 3, No. 1-2: 322-330 Mitigating Residual Tropospheric Delay to Improve User’s Network- Based Positioning Tajul A. Musa, Jinling Wang, Chris Rizos, Young-Jin Lee School of Surveying and Spatial Information Systems, the University of New South Wales, NSW, Australia e-mail: Tajul.Musa@student.unsw.edu.au; Tel: +61-2-9385 4208; Fax: +61-2-9313 7493 Azhari Mohamed Department of Survey and Mapping, Malaysia, Jalan Semarak, 50578 Kuala Lumpur, Malaysia e-mail: azhari@jupem.gov.my; Tel: +60-3-26170971; Fax: 03-26912757 Received: 15 November 2004 / Accepted: 3 February 2005 Abstract. Existing apriori tropospheric models are not sufficiently accurate to remove tropospheric delay from GPS observations. Remaining effects of residual tropospheric delay need to be estimated to ensure high accuracy and reliability of GPS positioning. Other researchers have shown that implementations of network- based positioning techniques can adequately model the residual tropospheric delay as well as ionospheric delay and orbit biases. However, the effectiveness in removing residual tropospheric delay is highly dependent on the degree to which the wet component from the troposphere can be estimated or mitigated, an effect which shows strong variation with time and space. The aim of this paper is to illustrate the performance of an existing apriori tropospheric model and to discuss some issues concerning the estimation of the (total) tropospheric delay in the equatorial area. Finally, the network approach is applied to mitigate the effect of residual tropospheric delay. Some preliminary results from test experiments using GPS network data from an equatorial region, a location with the highest effect of tropospheric delay, are presented. Key words: Residual tropospheric delay, zenith path delay, network-based GPS positioning 1 Introduction The two propagation mediums which contribute to signal delay of satellite observations are the ionosphere and the neutral atmosphere. The ionosphere is a dispersive medium for microwave, i.e the refractivity depends on the frequency of the propagation signal. The ionosphere delay can be determined and eliminated (at least to first order) by making observations on both GPS frequencies. Meanwhile the neutral atmosphere delay is mainly attributed to the earth’s troposphere layer. The troposphere consists of dry gases and water vapour, and is a non-dispersive medium to radio frequency. Therefore the delay effect cannot be estimated in the same way as that of the ionosphere. The neutral atmospheric delay can be estimated by integrating the tropospheric refractivity along the GPS signal path through the atmosphere. This is referred to as the tropospheric path delay. It is possible to separate tropospheric refractivity into a hydrostatic component (or simply known as “dry”) and a wet component, where the former is due to the dry atmosphere and the latter due to the presence of water vapour in the atmosphere. The (total) troposphere path delay needs to be mapped along a path of arbitrary orientation, which can be represented as the product of zenith delay and a specified mapping function. The simplest mapping function is approximated by cosec of the elevation angle. There is a difference in mapping of wet and dry components, but they differ very slightly and in practice usually they are lumped into a single mapping function. The (total) Zenith Path Delay (ZPD) can be written as: )()( θθ mZmZZPDwetdry += (1) where Zdry and Zwet are the zenith dry delay and zenith wet delay respectively, m(θ) is the mapping function with θ as the satellite elevation angle (for m(θ)≈cosec(θ)). There are many troposphere models that have been developed, e.g, Saastamoinen, Hopfield, Davis, Lanyi and Chao. Most of these models effectively model the zenith dry  Tajul: Mitigating Residual Tropospheric Delay to Improve User’s Network-Based Positioning 323 delay, which contributes about 80%-90% of the total delay (Hoffman-Wellenholf et al., 1994). However, all the models have difficulty in modelling the wet delay due to the high spatial and temporal variability of the water vapour . As a result, a residual tropospheric delay remains in the measurements after application of the model. Over the past few years network-based GPS positioning has been widely discussed in the literature (e.g. Wanninger, 2002; Chen et al., 2000; Landau et al., 2002; Rizos and Han, 2003). External information about the GPS measurement biases provided by the network technique has enabled the performance of conventional single reference station, carrier phase-based techniques to be extended over longer baselines. This is possible because the network technique attempts to model distance-dependent errors (i.e, atmospheric and orbit effects) in the local network (Han, 1997; Chen, 2001). First section on this paper discusses the performance of two apriori tropospheric delay models. Secondly, problems of residual tropospheric delay are discussed and some issues concerning the estimation of the (total) tropospheric delay are mentioned. A review of the GPS network-based positioning approach is given in the third section. Section four describes how the network approach can be used in order to mitigate the residual tropospheric delay. 2 Testing on apriori tropospheric delay modelling To test the performance of the apriori tropospheric delay model, tests were conducted using GPS datasets in a near-equatorial region of the earth. The data was collected by stations of the Malaysia Active GPS System (MASS) (Figure 1). The GPS double-differenced (DD) measurement model based on the ionosphere-free (IF) carrier phase combination is used to eliminate the ionospheric delay effect. The data processing methodology resolves the “wide-lane ambiguity” first and then fixes the “narrow-lane ambiguity” during subsequent processing (Rothacher and Mervart, 1996; Sun et al., 1999). Therefore for long baselines, the tropospheric delay will dominate the DD IF residual errors, assuming that other errors (geometric errors and multipath) are minimised (for example by using the precise GPS orbit data, multipath-free location and precise receiver coordinates). GPS data of Day of Year (DoY) 29/03 for a 24 hours span was processed by the method described above. A Satellite elevation cut-off angle of 15º was used for the analyses. Station IPOH is excluded in the test due to bad observations. Fig. 1 Part of the MASS (Peninsular Malaysia) Two apriori tropospheric delay models were chosen for the test: the Saastamoinen model and the Modified Hopfield model. Both models used values that are derived from a standard atmosphere model. The test methodology is as follows; Test 1: no apriori model is applied; Test 2: applying only the dry model; and Test 3: applying both the dry and wet troposphere models. Time series of the above tests are shown in Figure 2, Figure 3(a) and 3(b), and Figure 4(a) and 4(b) for a selected baseline KTPK- ARAU. Table 1 and Table 2 give details of the results. KTPK-ARA U (396km ) No Tropo Model -2 -1 0 1 2 5266852668.2552668.5 52668.7552669 MJD DD IF Residuals (m) Fig. 2 Test 1 (no apriori troposphere model) From Figure 2 and Table 1, the differential tropospheric delay can be observed as being as large as 1.5m and a RMS of up to 0.3m if no apriori troposphere model is applied. Comparing Figure 1 to Figure 3 and Figures 4, it is clear that both apriori models can mitigate the tropospheric delay, as the maximum value decreases to 0.2m and the RMS of DD IF residuals is 0.05m. This is also true for the other baselines in the tests. The test statistic in Table 1 also shows that the error increases with baseline length, which confirms that the residual (DD) tropospheric delay can be categorised as a distance- dependent error. Results in Table 2 show that a 73%-87% improvement is achieved after applying the dry model. Only a small improvement (1%-2%) is observed by  324 Journal of Global Positioning Systems applying both the dry and wet models. In general, the DD IF residuals after applying the apriori model are between 0.03m to 0.05m, mostly due to the wet component. There is no significant difference in the test results between the two apriori troposphere models. KTPK-A RAU ( 396km) Dry Model Only (Mod. Hopfield) -0.4 -0.2 0 0.2 0.4 5266852668.25 52668.5 52668.7552669 MJD DD IF Residuals (m) KTPK-ARAU (39 6k m ) Dry Mode l Only (Saas tom oin en) -0.4 -0.2 0 0.2 0.4 5266852668.25 52668.5 52668.7552669 MJD DD IF Residuals (m) Fig. 3 Test 3(a) left, dry Modified Hopfiled model and Test 3(b) right, dry Saastamoinen model KTPK-ARAU (396k m) Dr y & We t Mo d e l (Mo d. Hopf ield ) -0. 4 -0. 2 0 0. 2 0. 4 5266852668.25 52668.552668.7552669 MJD DD IF Residuals (m) KTPK-ARAU (396km) Dry & Wet M odel ( Saas t omoinen) -0.4 -0.2 0 0. 2 0. 4 5266852668.25 52668.552668.7552669 MJD DD IF Residuals (m) Fig. 4 Test 4(a) left, dry and wet Modified Hopfiled model. Test 4(b) right, dry and wet Saastamoinen model Tab. 1 Statistic of Test 1, Test 2 and Test 3 of DD IF measurements.Station KTPK as reference and station height is 99m Stn KTPK to: Length (km) Stn HEIGHT (m) DD IF RMS NO MODEL (m) DD IF RMS DRY SAAS (m) DD IF RMS DRY M. HOPFIELD (m) DD IF RMS DRY&WET SAAS (m) DD IF RMS DRY&WET M.HOPFILED (m) ARAU 396 82 0.310 0.054 0.053 0.049 0.048 GETI 341 100 0.373 0.057 0.056 0.049 0.048 USMP 288 80 0.267 0.048 0.048 0.045 0.044 KUAL 285 45 0.254 0.040 0.040 0.034 0.034 UTMJ 278 19 0.221 0.053 0.052 0.047 0.047 KUAN 196 74 0.127 0.027 0.027 0.025 0.025 SEGA 136 75 0.104 0.028 0.028 0.025 0.025 Tab. 2 Percentage improvement after applying dry model only and dry & wet model for DD IF measurements Stn KTPK to: DRY SAAS (%) DRY M.HOPFILED (%) DRY&WET SAAS (%) DRY&WET M.HOPFIELD (%) ARAU 82.6 82.9 84.2 84.5 GETI 84.7 85.0 86.9 87.1 USMP 82.0 82.0 83.1 83.5 KUAL 84.3 84.3 86.6 86.6 UTMJ 76.0 76.5 78.7 78.7 KUAN 78.7 78.7 80.3 80.3 SEGA 73.1 73.1 76.0 76.0  Tajul: Mitigating Residual Tropospheric Delay to Improve User’s Network-Based Positioning 325 3 Issues on residuals tropospheric delay At this stage, it is clear that the apriori troposphere model cannot effectively handle the residual tropospheric delay. High accuracy GPS positioning requires the residuals to be reduced through appropriate modelling. The approach usually is to introduce additional unknown parameters in the least square estimation process, and to, for example, solve for one scale factor for every station per session. The estimation of the scale factor tends to average the residual tropospheric delay, thus improving the results. However, the scale factor is only a constant offset to the apriori model and does not reflect the time varying nature of the atmosphere. Alternatively, a time-varying polynomial scale factor can be introduced to estimate several troposphere parameters per session. Another viable approach is to use stochastic estimation to model using a first-order Gauss-Markov or random walk process (Dodson et al., 1996). To this extent, it is convenient to discuss the residual tropospheric delay in the context of the total ZPD. The estimated troposphere parameter together with the apriori model value and associated mapping function gives the GPS derived (total) ZPD. Typically the process of GPS ZPD estimation requires a large network of GPS reference stations to achieve a stable value of absolute ZPD (discussion in next section). A good example is the global network of the International GPS Service (IGS) which already is in use, publishing 2 hour absolute ZPD values. This IGS estimate should be included in the processing of regional/local GPS network data to benchmark the ZPD value derived from regional/local solution. 3.1 Absolute vs relative tropospheric delay Relative delay is more important than absolute delay for GPS positioning. Beutler et al. (1988) gave a rule of thumb that relative delay causes height errors which are amplified by the factor of cosec(θmin) (2.9 for θmin =20°). Meanwhile an absolute delay of 10cm will cause scale biases of 0.05ppm in the estimated baseline lengths (Rothacher and Mervart, 1996). However, an accurate and absolute ZPD value is crucial for GPS meteorology applications. Equation 1 indicates that one of the important factors in total ZPD estimation is the satellite elevation angle. Duan et al. (1996) have shown that for small sized GPS networks, the total ZPD is sensitive to relative ZPD but not to absolute ZPD. This is due to the small elevation angle difference observed between two GPS receivers in the network. On the other hand, a large network is needed to have large elevation angle variations in order to get a better estimation of the absolute ZPD. To analyse the relationship between absolute and relative delay and the network size, a few regional IGS stations around the local MASS network were used (Figure 5). IGS station NTUS however is treated as a local station because of the small distance to the MASS network (KTPK-NTUS is only 297km). This will give an advantage to the MASS network analysis in order to benchmark the absolute ZPD value to the IGS estimate. Fig. 5 Regional GPS network Two weeks data were selected for the test, DoY204- 210/03 (Jul23-Jul29 03), i.e. during a dry month, and DoY323-329/09 (Nov19-Nov25 03), i.e. during a wet month. For this analysis, the precise IGS orbits were used; satellite elevation cut-off angle was set at 10°, 15° and 20°; a simple cosec mapping function was used and the precise coordinates of all the reference stations were supplied by the network operator. Tropospheric parameters were estimated as piecewise linear functions at two hour intervals for all the stations, using the BERNESE software (Rothacher and Mervart, 1996). Only results for the case of 15° cut-off elevation angle for station NTUS is shown in Figures 6 (a) & 6(b), 7(a) & 7(b) and 8(a) & 8(b), for both weeks. Table 3 and Table 4 give the statistics of all the test results for station NTUS. Inspecting Figures 6(a) and 6(b) and Table 3, it can be found that the absolute ZPD value (compared to the IGS value) derived from the regional network is accurate to about 3mm (in the dry season) and 5mm (in the wet season), in terms of RMS values when compared to the local network. Figures 7(a) and 7(b) show the extracted values of absolute ZPD for both networks. All tests (different 20°, 15°, 10° cut-off elevation angles) show that the differences between the regional and local absolute ZPD are within 1-3mm (in the dry season) and 5-8mm (in the wet season). The higher elevation angle observed from regional network can provide a better estimation of absolute ZPD. Both local and regional absolute ZPD estimates differ by about 18mm-32mm in their RMS to the IGS values, where the maximum difference occurs during the wet season for the 10° cut-off elevation angle. 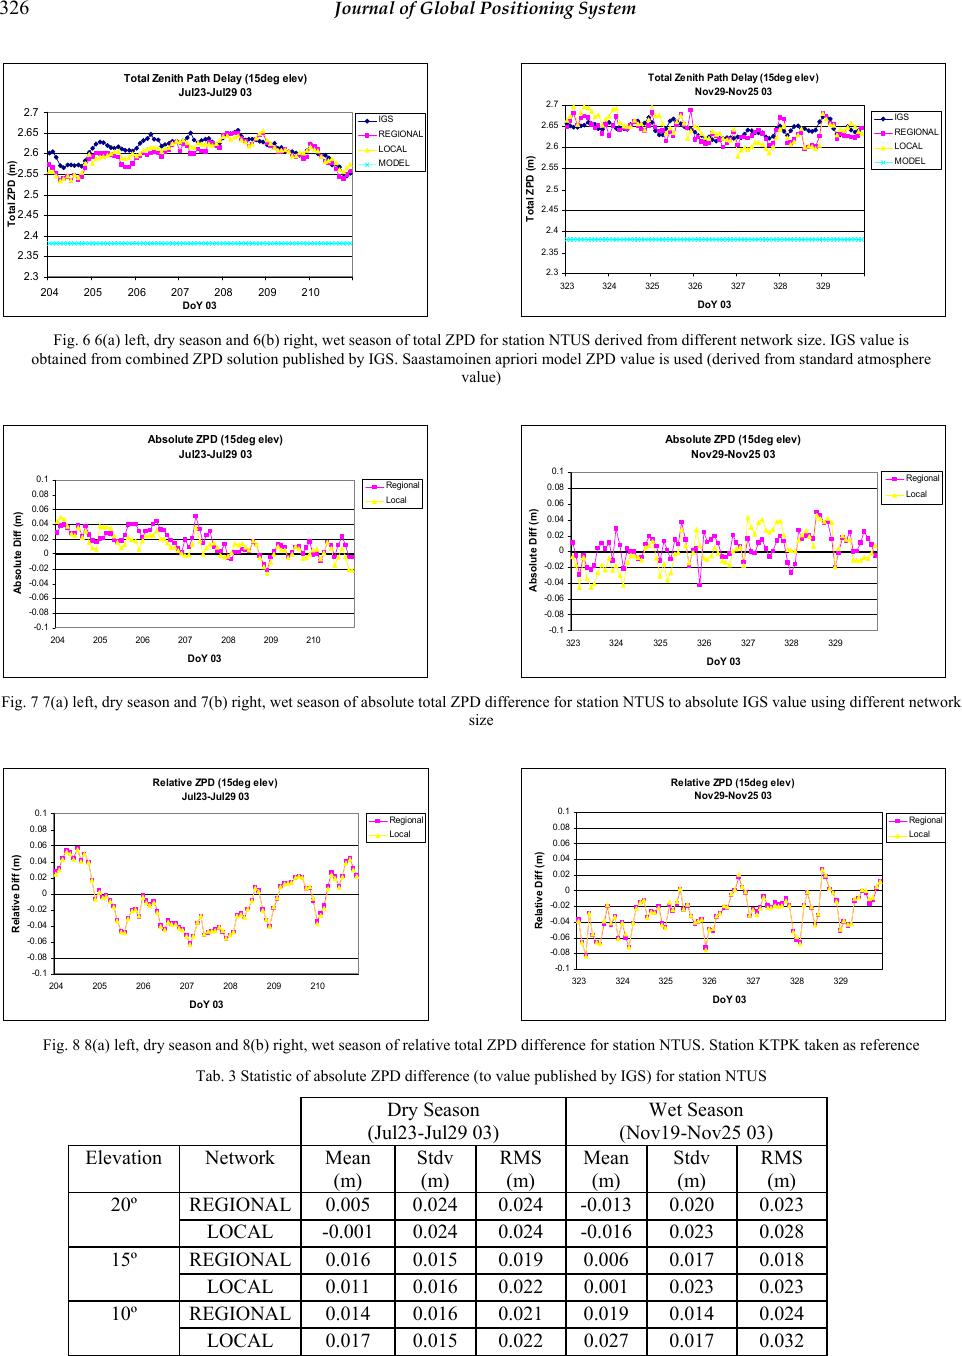 326 Journal of Global Positioning System Total Zenith Path Delay (15deg elev) Jul23- Jul 29 03 2.3 2.35 2.4 2.45 2.5 2.55 2.6 2.65 2.7 204 205206 207 208209 210 DoY 03 Total ZPD (m) IGS REGIONAL LOCAL MODEL Total Zenith Path Delay (15deg elev) Nov29-Nov25 03 2. 3 2. 35 2. 4 2. 45 2. 5 2. 55 2. 6 2. 65 2. 7 323324 325 326327328 329 DoY 03 Total ZPD (m) IGS REGIONAL LOCAL MODEL Fig. 6 6(a) left, dry season and 6(b) right, wet season of total ZPD for station NTUS derived from different network size. IGS value is obtained from combined ZPD solution published by IGS. Saastamoinen apriori model ZPD value is used (derived from standard atmosphere value) Absol ut e ZPD (15deg el ev) Jul23-Jul29 03 -0.1 -0. 08 -0. 06 -0. 04 -0. 02 0 0. 02 0. 04 0. 06 0. 08 0.1 204 205 206207208 209 210 DoY 03 Absolute Diff (m) Regional Local Absolute Z PD (15deg elev) Nov29-Nov25 03 -0.1 -0. 08 -0. 06 -0. 04 -0. 02 0 0. 02 0. 04 0. 06 0. 08 0.1 323324 325 326 327328 329 DoY 03 Absolute Diff (m) Region al Local Fig. 7 7(a) left, dry season and 7(b) right, wet season of absolute total ZPD difference for station NTUS to absolute IGS value using different network size Relati ve ZPD (15deg elev) Jul23-Jul29 03 -0. 1 -0.08 -0.06 -0.04 -0.02 0 0.02 0.04 0.06 0.08 0.1 204 205 206 207 208 209 210 DoY 0 3 Relative Diff (m) Regional Local Relat ive ZPD (15deg el ev) Nov29-Nov25 03 -0.1 -0.08 -0.06 -0.04 -0.02 0 0.02 0.04 0.06 0.08 0.1 323 324325 326 327 328 329 DoY 03 Relative Diff (m ) Regional Loc al Fig. 8 8(a) left, dry season and 8(b) right, wet season of relative total ZPD difference for station NTUS. Station KTPK taken as reference Tab. 3 Statistic of absolute ZPD difference (to value published by IGS) for station NTUS Dry Season (Jul23-Jul29 03) Wet Season (Nov19-Nov25 03) Elevation Network Mean (m) Stdv (m) RMS (m) Mean (m) Stdv (m) RMS (m) REGIONAL 0.005 0.024 0.024 -0.013 0.020 0.023 20º LOCAL -0.001 0.024 0.024 -0.016 0.023 0.028 REGIONAL 0.016 0.015 0.019 0.006 0.017 0.018 15º LOCAL 0.011 0.016 0.022 0.001 0.023 0.023 REGIONAL 0.014 0.016 0.021 0.019 0.014 0.024 10º LOCAL 0.017 0.015 0.022 0.027 0.017 0.032 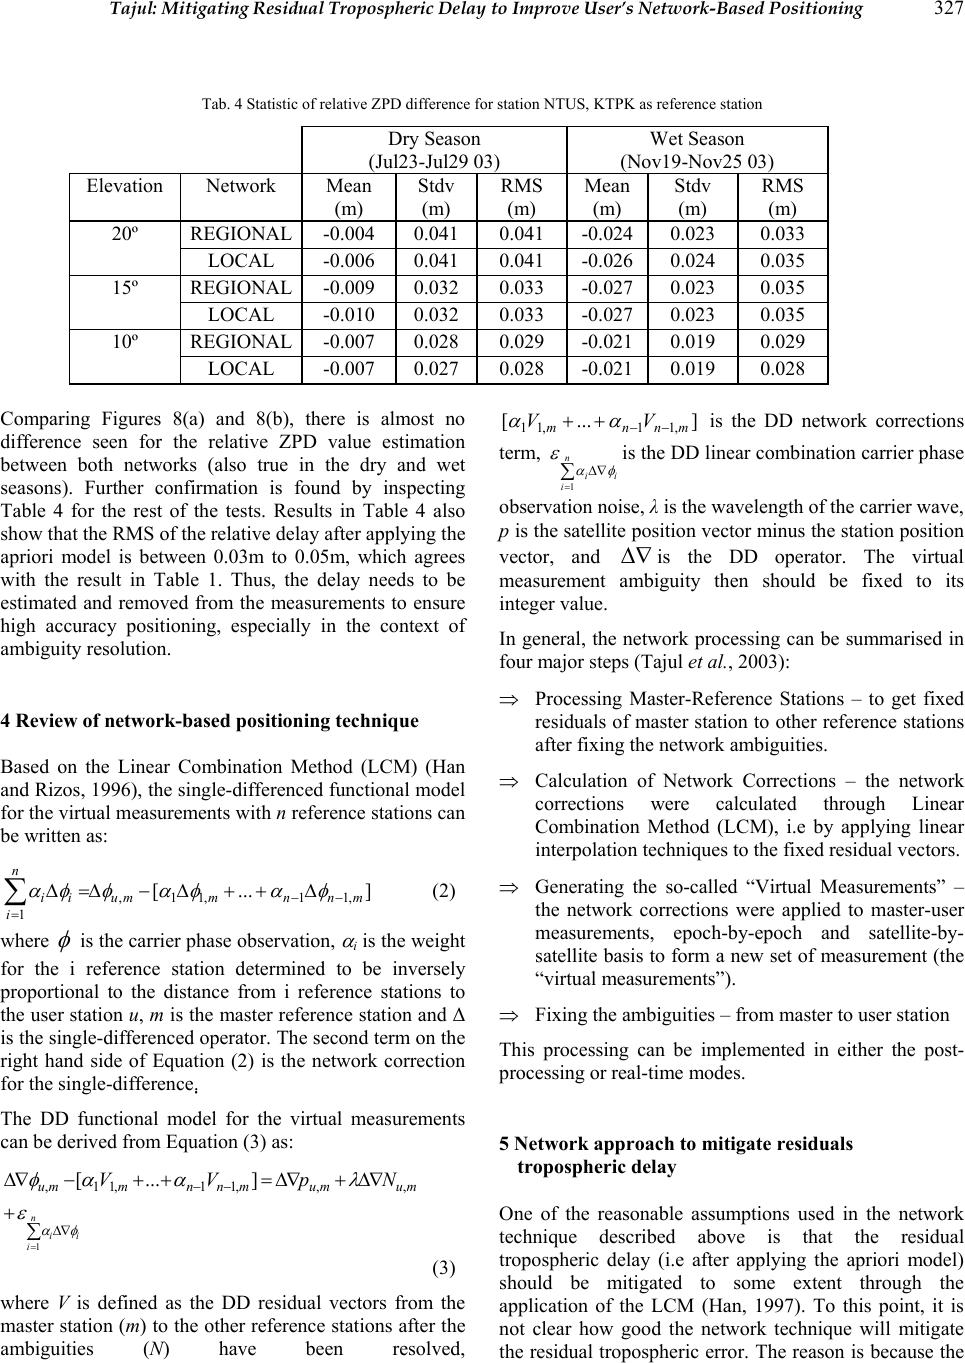 Tajul: Mitigating Residual Tropospheric Delay to Improve User’s Network-Based Positioning 327 Tab. 4 Statistic of relative ZPD difference for station NTUS, KTPK as reference station Dry Season (Jul23-Jul29 03) Wet Season (Nov19-Nov25 03) Elevation Network Mean (m) Stdv (m) RMS (m) Mean (m) Stdv (m) RMS (m) REGIONAL -0.004 0.041 0.041 -0.024 0.023 0.033 20º LOCAL -0.006 0.041 0.041 -0.026 0.024 0.035 REGIONAL -0.009 0.032 0.033 -0.027 0.023 0.035 15º LOCAL -0.010 0.032 0.033 -0.027 0.023 0.035 REGIONAL -0.007 0.028 0.029 -0.021 0.019 0.029 10º LOCAL -0.007 0.027 0.028 -0.021 0.019 0.028 Comparing Figures 8(a) and 8(b), there is almost no difference seen for the relative ZPD value estimation between both networks (also true in the dry and wet seasons). Further confirmation is found by inspecting Table 4 for the rest of the tests. Results in Table 4 also show that the RMS of the relative delay after applying the apriori model is between 0.03m to 0.05m, which agrees with the result in Table 1. Thus, the delay needs to be estimated and removed from the measurements to ensure high accuracy positioning, especially in the context of ambiguity resolution. 4 Review of n et w or k-based positioning technique Based on the Linear Combination Method (LCM) (Han and Rizos, 1996), the single-differenced functional model for the virtual measurements with n reference stations can be written as: ]...[ ,11,11, 1 mnnmmu n i ii −− = ∆++∆−∆=∆ ∑ φαφαφφα (2) where φ is the carrier phase observation, α i is the weight for the i reference station determined to be inversely proportional to the distance from i reference stations to the user station u, m is the master reference station and ∆ is the single-differenced operator. The second term on the right hand side of Equation (2) is the network correction for the single-difference. The DD functional model for the virtual measurements can be derived from Equation (3) as: ∑ + ∇∆+∇∆=++−∇∆ = ∇∆ −− n i ii mumumnnmmu NpVV 1 ,,,11,11, ]...[ φα ε λααφ (3) where V is defined as the DD residual vectors from the master station (m) to the other reference stations after the ambiguities (N) have been resolved, ]...[ ,11,11 mnnm VV −− + + α α is the DD network corrections term, ∑ = ∇∆ n i ii 1 φα ε is the DD linear combination carrier phase observation noise, λ is the wavelength of the carrier wave, p is the satellite position vector minus the station position vector, and ∇ ∆ is the DD operator. The virtual measurement ambiguity then should be fixed to its integer value. In general, the network processing can be summarised in four major steps (Tajul et al., 2003): ⇒ Processing Master-Reference Stations – to get fixed residuals of master station to other reference stations after fixing the network ambiguities. ⇒ Calculation of Network Corrections – the network corrections were calculated through Linear Combination Method (LCM), i.e by applying linear interpolation techniques to the fixed residual vectors. ⇒ Generating the so-called “Virtual Measurements” – the network corrections were applied to master-user measurements, epoch-by-epoch and satellite-by- satellite basis to form a new set of measurement (the “virtual measurements”). ⇒ Fixing the ambiguities – from master to user station This processing can be implemented in either the post- processing or real-time modes. 5 Network ap p ro ach t o mitigate residuals tropospheric delay One of the reasonable assumptions used in the network technique described above is that the residual tropospheric delay (i.e after applying the apriori model) should be mitigated to some extent through the application of the LCM (Han, 1997). To this point, it is not clear how good the network technique will mitigate the residual tropospheric error. The reason is because the 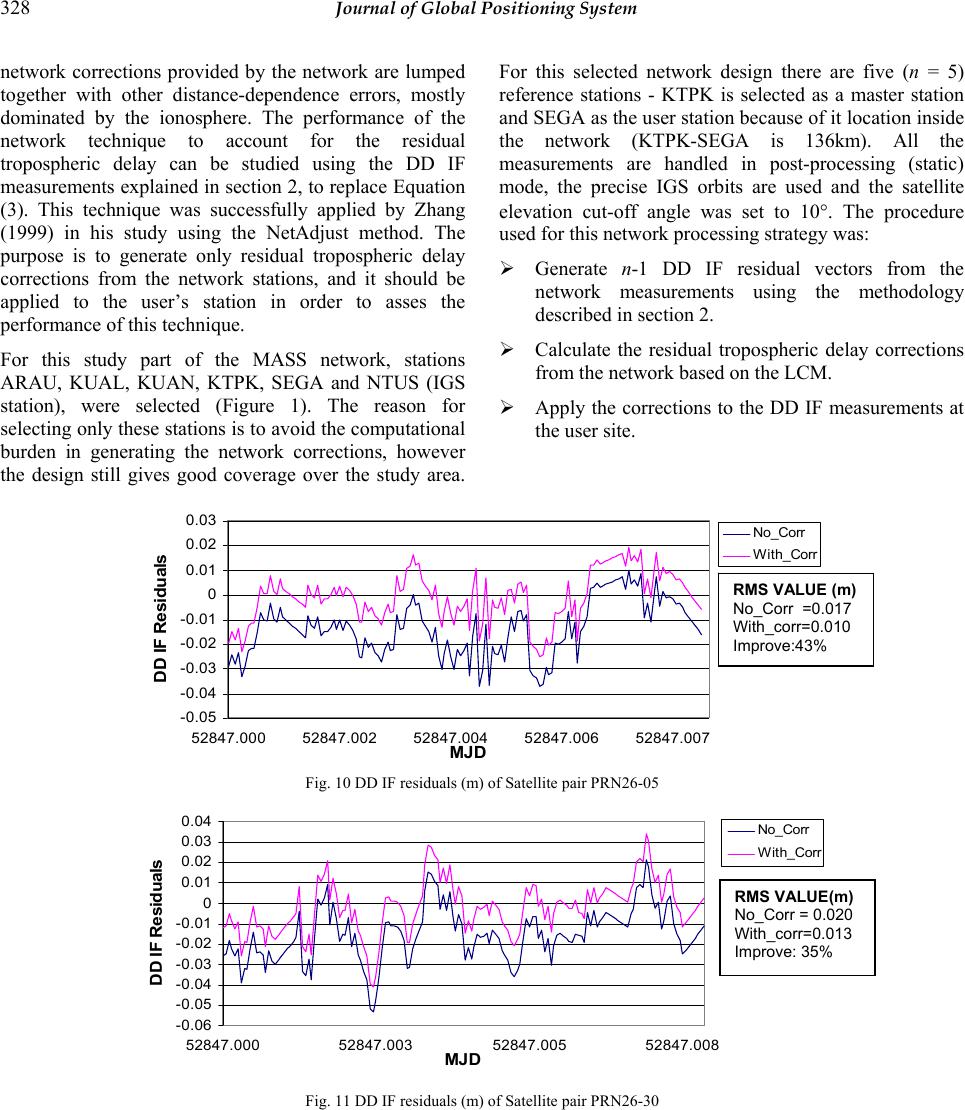 328 Journal of Global Positioning System network corrections provided by the network are lumped together with other distance-dependence errors, mostly dominated by the ionosphere. The performance of the network technique to account for the residual tropospheric delay can be studied using the DD IF measurements explained in section 2, to replace Equation (3). This technique was successfully applied by Zhang (1999) in his study using the NetAdjust method. The purpose is to generate only residual tropospheric delay corrections from the network stations, and it should be applied to the user’s station in order to asses the performance of this technique. For this study part of the MASS network, stations ARAU, KUAL, KUAN, KTPK, SEGA and NTUS (IGS station), were selected (Figure 1). The reason for selecting only these stations is to avoid the computational burden in generating the network corrections, however the design still gives good coverage over the study area. For this selected network design there are five (n = 5) reference stations - KTPK is selected as a master station and SEGA as the user station because of it location inside the network (KTPK-SEGA is 136km). All the measurements are handled in post-processing (static) mode, the precise IGS orbits are used and the satellite elevation cut-off angle was set to 10°. The procedure used for this network processing strategy was: ¾ Generate n-1 DD IF residual vectors from the network measurements using the methodology described in section 2. ¾ Calculate the residual tropospheric delay corrections from the network based on the LCM. ¾ Apply the corrections to the DD IF measurements at the user site. -0.05 -0.04 -0.03 -0.02 -0.01 0 0.01 0.02 0.03 52847.000 52847.002 52847.004 52847.006 52847.007 MJD DD IF Residuals No_Corr With_Corr Fig. 10 DD IF residuals (m) of Satellite pair PRN26-05 -0.06 -0.05 -0.04 -0.03 -0.02 -0.01 0 0.01 0.02 0.03 0.04 52847.000 52847.00352847.005 52847.008 MJD DD IF Residuals No_Corr With_Corr Fig. 11 DD IF residuals (m) of Satellite pair PRN26-30 RMS VALUE (m) No_Corr =0.017 With_corr=0.010 Improve:43% RMS VALUE(m) No_Corr = 0.020 With_corr=0.013 Improve: 35% 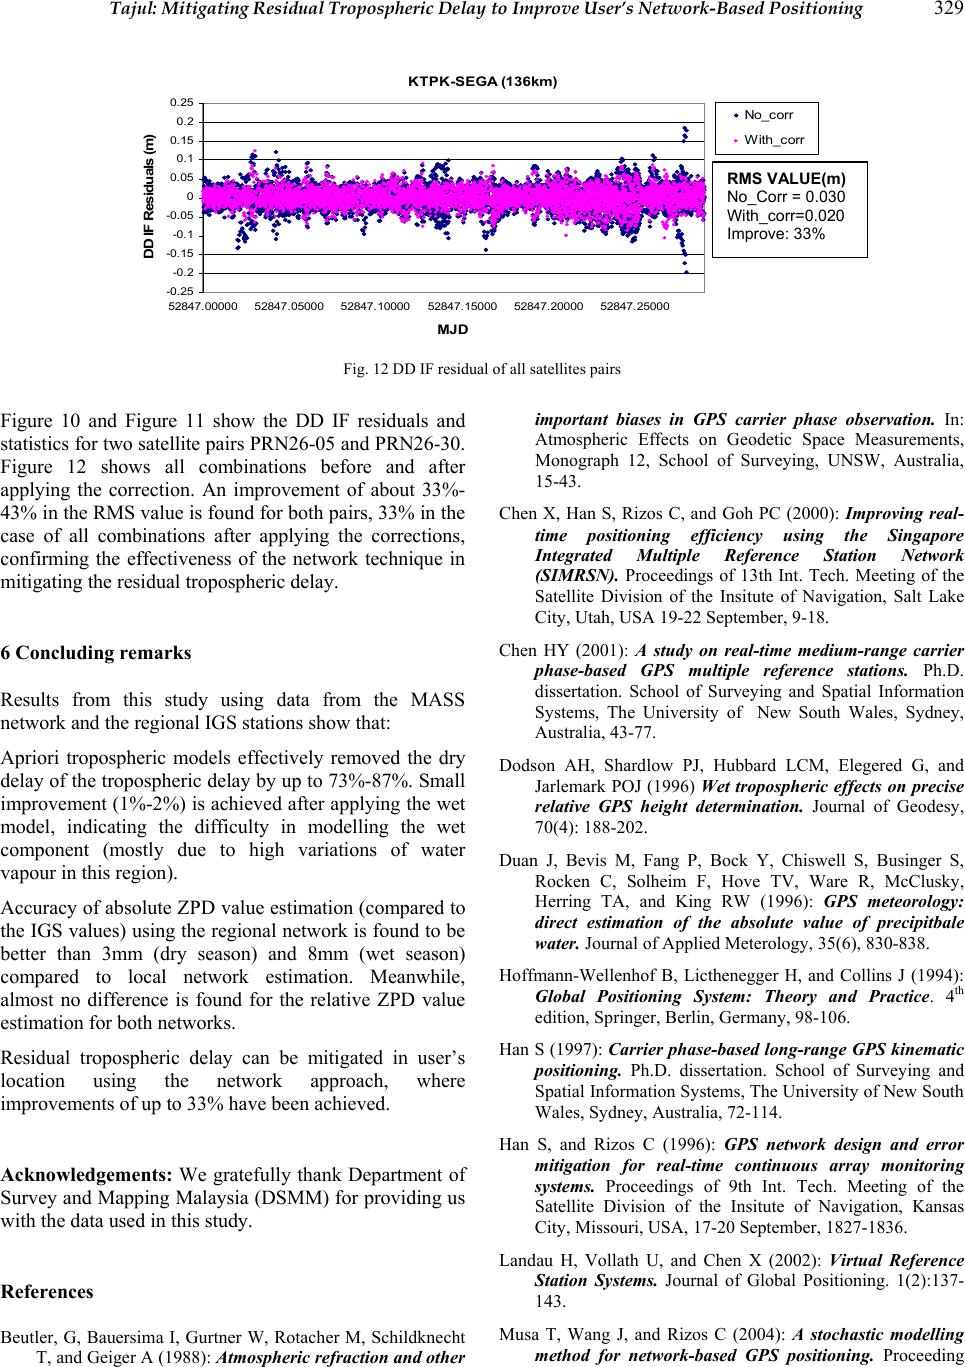 Tajul: Mitigating Residual Tropospheric Delay to Improve User’s Network-Based Positioning 329 KTPK-SEGA (1 3 6k m ) -0.25 -0.2 -0.15 -0.1 -0.05 0 0.05 0.1 0.15 0.2 0.25 52847.00000 52847.05000 52847.1000052847.15000 52847.20000 52847.25000 MJD DD IF Residuals (m ) No_corr With_corr Fig. 12 DD IF residual of all satellites pairs Figure 10 and Figure 11 show the DD IF residuals and statistics for two satellite pairs PRN26-05 and PRN26-30. Figure 12 shows all combinations before and after applying the correction. An improvement of about 33%- 43% in the RMS value is found for both pairs, 33% in the case of all combinations after applying the corrections, confirming the effectiveness of the network technique in mitigating the residual tropospheric delay. 6 Concluding remarks Results from this study using data from the MASS network and the regional IGS stations show that: Apriori tropospheric models effectively removed the dry delay of the tropospheric delay by up to 73%-87%. Small improvement (1%-2%) is achieved after applying the wet model, indicating the difficulty in modelling the wet component (mostly due to high variations of water vapour in this region). Accuracy of absolute ZPD value estimation (compared to the IGS values) using the regional network is found to be better than 3mm (dry season) and 8mm (wet season) compared to local network estimation. Meanwhile, almost no difference is found for the relative ZPD value estimation for both networks. Residual tropospheric delay can be mitigated in user’s location using the network approach, where improvements of up to 33% have been achieved. Acknowledgements: We gratefully thank Department of Survey and Mapping Malaysia (DSMM) for providing us with the data used in this study. References Beutler, G, Bauersima I, Gurtner W, Rotacher M, Schildknecht T, and Geiger A (1988): Atmospheric refraction and other important biases in GPS carrier phase observation. In: Atmospheric Effects on Geodetic Space Measurements, Monograph 12, School of Surveying, UNSW, Australia, 15-43. Chen X, Han S, Rizos C, and Goh PC (2000): Improving real- time positioning efficiency using the Singapore Integrated Multiple Reference Station Network (SIMRSN). Proceedings of 13th Int. Tech. Meeting of the Satellite Division of the Insitute of Navigation, Salt Lake City, Utah, USA 19-22 September, 9-18. Chen HY (2001): A study on real-time medium-range carrier phase-based GPS multiple reference stations. Ph.D. dissertation. School of Surveying and Spatial Information Systems, The University of New South Wales, Sydney, Australia, 43-77. Dodson AH, Shardlow PJ, Hubbard LCM, Elegered G, and Jarlemark POJ (1996) Wet tropospheric effects on precise relative GPS height determination. Journal of Geodesy, 70(4): 188-202. Duan J, Bevis M, Fang P, Bock Y, Chiswell S, Businger S, Rocken C, Solheim F, Hove TV, Ware R, McClusky, Herring TA, and King RW (1996): GPS meteorology: direct estimation of the absolute value of precipitbale water. Journal of Applied Meterology, 35(6), 830-838. Hoffmann-Wellenhof B, Licthenegger H, and Collins J (1994): Global Positioning System: Theory and Practice. 4th edition, Springer, Berlin, Germany, 98-106. Han S (1997): Carrier phase-based long-range GPS kinematic positioning. Ph.D. dissertation. School of Surveying and Spatial Information Systems, The University of New South Wales, Sydney, Australia, 72-114. Han S, and Rizos C (1996): GPS network design and error mitigation for real-time continuous array monitoring systems. Proceedings of 9th Int. Tech. Meeting of the Satellite Division of the Insitute of Navigation, Kansas City, Missouri, USA, 17-20 September, 1827-1836. Landau H, Vollath U, and Chen X (2002): Virtual Reference Station Systems. Journal of Global Positioning. 1(2):137- 143. Musa T, Wang J, and Rizos C (2004): A stochastic modelling method for network-based GPS positioning. Proceeding RMS VALUE(m) No_Corr = 0.030 With_corr=0.020 Improve: 33%  330 Journal of Global Positioning System of European GNSS Conference 2004, Rotterdam, The Netherlands, 16-19 May, CD-Rom proc. Rothacher M, and Mervart L (1996): Manual of Bernese GPS Software. Version 4.0, Astronomical Institute, University of Berne, 159-188. Rizos C, and Han S (2003): Reference station network based RTK systems - Concepts & progress. Wuhan University Journal of Nature Sciences, 8(2B): 566-574. Sun H, Melgard T, and Cannon ME (1999): Real-time GPS Reference Network Carrier Phase Ambiguity Resolution. Proceedings of the ION National Technical Meeting, San Diego, California, 25-27 January, 193-199. Wanninger L (2002): Virtual reference stations for centimeter- level kinematic positioning. Proceedings of 15th Int. Tech. Meeting Satellite Division of the Institute of Navigation, Portland, Oregon, USA, 24-27 September, 1400-1407. Zhang J (1999): Investigation into the estimation of residuals tropospheric delay in a GPS network. Ph.D. dissertation. Department of Gematics Engineering, University of Calgary, Alberta, Canada, 53-125. |