Paper Menu >>
Journal Menu >>
 American Journal of Plant Sciences, 2010, 1, 38-46 doi:10.4236/ajps.2010.11006 Published Online September 2010 (http://www.SciRP.org/journal/ajps) Copyright © 2010 SciRes. AJPS Nutrient Flows in Perennial Crop-Based Farming Systems in the Humid Forests of Cameroon Eugene Ejolle Ehabe1*, Nomo Lucien Bidzanga2, Charles-Magloire Mba1, Jetro Nkengafac Njukeng1, Inacio de Barros3, Frank Enjalric4 1Institute of Agricultural Research for Development (IRAD), Ekona Regional Research Centre, PMB 25 Buea, Cameroon; 2Institute of Agricultural Research for Development (IRAD), Nkolbisson, Yaounde, Cameroon; 3INRA Antilles-Guyana, URAPC, Guadeloupe (FWI); 4Unité Mixte de Recherche Système, CIRAD Cultures Pérennes, Montpellier, France . Email: *e_ehabe@yahoo.com Received August 4th, 2010; revised August 24th, 2010; accepted September 11th, 2010 ABSTRACT A study was conducted in some perennial crop-based farms in the humid forests of South West Cameroon, to better un- derstand their soil fertility patterns and management and identify factors that contribute most to nutrient depletion trends in such multi-storey farmholdings. The main pe rennial crops were the para rubber tree (Hev ea brasiliensis), co- coa (Theobroma cacao) and oil palm (Eleais guineensis) whose ages ranged from immature to very old (senescence). Data were collected over a two-year period (2007 and 2008) and modelled using the farm NUTrient MONitoring (NUTMON) tool. Results showed that the farming systems played key roles in the overall exploitation strategies. Plan- tain and cassava (annual crops) and cocoa (perennial) were the most associated crops, accounting for more than half of intercropped frequ encies. Whereas nutrient flows within an d between farm units were confirmed , the net loss in soil N, P and K nutrient balances differed with the main perennial crop - being highest for the oil palm and lowest for the rubber tree. The average nutrient balance of each farm was markedly negative for N but positive for P and K. Partial nutrient balance (ignoring biophysical flows like N-fixation, leaching and erosion) was positive for the three nutrients indicating therefore that the biophysical flows accounted more for N depletion. Nitrogen loss was mainly due to, leach- ing (~70%), volatilization (~20%), and exported crops and their residues. Keywords: Soil Fertility, Nutrient Monitoring, Depletion, Nutmon 1. Introduction Crop production practices within peasant farm holdings in sub-Saharan Africa often progress at the expense of su- stainable land use as farmers are primarily concerned ab- out crop and animal production, for the forthcoming sea- son. Hence, long-term processes that adversely affect su- stainability, such as decrease and eventual depletion of soil nutrient stocks, are less visible and receive a lower priority. Most often, these soils are progressively being mined of their nutrients [1] whereas there is need to se- cure present productivity and ensure the sustainability of these farming systems. These farmers have to manage the fertility of their soils by manipulating the flows of nutri- ents into, out of and within the farm. Indeed, decisions concerning soil productivity are determined by house- hold objectives (food security, profit or cash maximiza- tion, risk aversion, long term security of livelihood , etc.), available resources (labour, cash, implements, natural re- sources, etc.) and the socio-economic environment. Soil fertility in sub-Saharan Africa is today regarded as a major survival issue, especially in peasant perennial crop-based systems in the humid forests of Cameroon. This project was initially undertaken to ensure a better understanding and improvement of soil fertility in these cropping systems, to determine the possible role of integ- rated nutrient management in reversing present trends of nutrient depletion at each farm-level, and to integrate qu- antitative and qualitative assessment approaches in man- aging soil fertility. The complexity of peasant farms does not always all- ow for quantification of all flows and stocks. Nutrient monitoring (NUTMON) is a multi-scale modelling app- roach that was conceived to assess stocks and flows of certain nutrients in a well defined geographical unit foll- owing a strict monitoring of all farm inputs (mineral fer- tilizers, manures, atmospheric deposition and sedimenta- tion) and outputs (h arvested crop produces, residues, lea- ching, denitrification, erosion losses). The NUTMON-  Nutrient Flows in Perennial Crop-Based Farming Systems in the Humid Forests of Cameroon Copyright © 2010 SciRes. AJPS 39 Toolbox was developed with three modules to quantify nutrient flows, nutrient stocks and economic performance indicators for farms. It provides guidelines for data gath- ering in the field, data entry, calculation of flows and balances and data interpretation. Application of the tools from the toolbox results in a thor ough analysis providing insight into nutrient flows between the various activities within the farm as well as between the farm and its sur- roundings [2]. The specific objectives of this study were therefore to evaluate variations of soil nutrient stocks at farm level, measure and estimate the major nutrient flows at farm level as a means to describe current farm nutrient manag- ement, to identify the k ey factors influencing land mana- gement in perennial crop-based farms in the humid fore- sts of South West Cameroon in a bid to discover some of the underlying causes of so il fertility depletion. This was particularly supposed to be done using the Nutrient Mo- nitoring Programme (NUTMON) or software, a tool that was developed to assess nutrient balances (stocks and fl- ows of some macro-nutrients - N, P and K), biomass fl- ow and economic performance at farm level [2]. NUTMON has been suggested as a decision-support model to monitor the effects of chang ing land us e and su- ggest interventions that improve the nutrient balance [4]. As input and output determinants can not all be qu antified equally well, the model recognizes primary data, estima- tes and assumptions. The NUTMON determinants are mostly scale-neutral and can therefore be used to monitor nutrient balances at farm, regional, national and supra- national levels. NUTMON is fed by a number of basic data, and by nutrient input and output data [2]. Basic data include the surface area of the arable land, and the spatial patterns of land use systems (LUS). Nutrient input and output data are reflections of different processes, each of which has a certain value (the nutrient balance) which is specific for a given LUS at a given time. A second monitoring exercise at a later stage may yield different results, which may be due to changes in the LUS, or changes in the individual nutrient input and output values. As the changes have eit- her aggravated or ameliorated the nutrient balance, NU- TMON can support decision-making in the interest of sustainable forms of agriculture [3,5]. 2. Methodology 2.1. The Study Area Field observations were carried out on 19 typical peren- nial crop-based agroforestry farms, distributed around Ku- mba and extending to the Bombe-Malende zones (4°25’- 4°80’N and 9°25’- 9°35’E) in the South West Region of Cameroon (Figure 1). This region falls within the rain- forest area (mean rainfall of 2,852 mm/yr), with a mark- ed rainy season (March to October), and high mean ann- ual temperatures (~23˚C) evenly distributed throughout the year [6], Soils are ferrallitic with patches of fertile vol- canic areas, and altitudes varying from 25 to 400 m to- ward the North. The agro-forestry exploitations existing in the area are typically characterized as home gardens [7], that is, permanently occupied (no fallow) small areas, usually adjacent to the farmers’ houses, integrating main perennials (oil palm, rubber trees and cocoa), food crops (yams, cassava, maize, banana, plantain, cocoyam, etc.), and native trees (as well as ornamentals and medicinal plants not considered in the surveys). The farm holdings had been judged homogeneous in terms of their farm and non-farm economic activities as well as the presence of some perennials as main crop in association with other crops. These farm types ranged from small-scale holdings with mostly food crops, indus- trial plantations for export crops and intercropped farms having various combinations of perennial and food crops [8,9]. The main crops, their development stages and basic characteristics of the terrain of the studied farms are pre- sented in Table 1. The parent material of all the so ils was of a volcanic/basement complex [1,10]. Prior to the survey, each farm was characterised for its location, altitude, rainfall and surface area, relief, soil mo- rphology (depth, texture or clay content, colour, parent material) and composition (moisture status, rooting status, etc.). 2.2. Soil Analyses For each plot, three to five representative samples were collected, following the procedure described latter on, and bulked. A soil observ ation was made at 100-m inter- vals using a soil auger to examine the soil down to a de- pth of 50 cm or more, when feasible. During such obser- vations, several soil/land characteristics were noted, no- tably the slope, horizon differentiation, soil depth, texture, colour, coarse fragments, drainage conditions, etc. These were later on sorted into groups of similar soils and ter- rain. Similar soils were bulked, labelled and packaged for eventual laboratory analysis. In the laboratory, the soils were dried under ambient conditions for about 2 weeks, crushed and siev ed through a 2-mm mesh. The throughs were subjected to several standard soil analytical procedures, notably for their: - texture (particle size) using the pipette method to ob- tain the relative proportions of sand, silt and clay; - pH (water and KCl), measured potentiometrically in a soil suspension (1:2.5) after 24 h; - Total Nitrogen (N) by the Kjeldahl semi-micro meth- od [11]; - Available Phosphorus (P) by the Bray II me t hod [ 12] ;  Nutrient Flows in Perennial Crop-Based Farming Systems in the Humid Forests of Cameroon Copyright © 2010 SciRes. AJPS 40 Figure 1. Map of Cameroon showing the study site.  Nutrient Flows in Perennial Crop-Based Farming Systems in the Humid Forests of Cameroon Copyright © 2010 SciRes. AJPS 41 Table 1. Farmholdings covered during the study. Plot Village Main crop Development of main crop Altitude (m) Slope (%) Clay (%) FSU 18 Bombe Oil palm In production 208 1 35 A 21 Bombe Cocoa Immature 45 3 30 A 22 Malende Cocoa Immature 67 5 35 A 23 Bombe Cocoa Immature 89 3 40 C 24 Malende Cocoa Immature 38 3 30 A 25 Bombe Cocoa In production 45 0 40 C 26 Bombe Cocoa In production 28 0 40 C 27 Bombe Cocoa In production 56 20 40 D 28 Malende Oil palm Immature 87 13 30 B 29 Malende Oil palm Immature 56 3 30 A 30 Bombe Oil palm Immature 34 4 30 A 31 Bombe Oil palm In production 25 5 30 A 32 Bombe Oil palm In production 56 3 25 A 33 Bombe Oil palm In production 85 3 30 A 34 Bombe Rubber Immature 82 3 30 A 35 Bombe Rubber Immature 67 1 30 A 36 Bombe Rubber Immature 65 2 30 A 37 Bombe Rubber In production 69 1 30 A 38 Bombe Rubber In production 70 25 40 D - Exchangeable bases calcium (Ca), magnesium (Mg), potassium (K) and sodium (Na) by the neutral ammo- nium acetate leaching method [13,14]; - Aluminium and hydrogen ions (Al+ H) by leaching with 1M KCl [13,14]; - The soil bulk dens ity was determined from soil cores using the Cylinder method [15,16 ]. Soil samples were dr- ied at 105˚C to constant weight, and th e bulk density was recorded as the ratio of the mass of the dried so il (in g) to the internal volume of the core cutter (in cm3). 2.3. Data Collection and Analysis Using NUTMON ® The NUTMON ® tool, applied at both the farm and ac- tivity levels, included a structured questionnaire, a data- base, and two static models - NUTCAL for calculation of nutrient flows and the ECCAL for calculation of econ- omic parameters [17]. A user interface facilitated data entry, data manipulation and data extraction to produce input for both models. An initial inventory of household composition, farm and field layout, agricultural activ ities an d nutrient sto cks was completed for each farm. This inventory was follo- wed by a monthly monitoring of on-f arm agricultural ac- tivities that affect nutrient flows. The activities of the fa- rm family, their cash income and the allocation of labour were also recorded. Based on the algorithm of the NUTMON ® software, the obtained data were modelled to obtain nutrient bala- nces (inputs less outputs) for all the farms. Nutrient outp- ut included harvested crop products and residues, nutria- nts leached out below the root zone, gaseous losses from the top soil, erosion and human excreta lost because it ends up in deep pit latrin es far below the root zone. Nut- rient inputs into the system were mineral fertilisers, org- anic inputs (manure, imported crop residues and feeds), air-borne deposition, biological N-fixation by plants, sed- imentation and nutrients extracted from the sub-soil by deep-rooting crops and trees. 3. Results and Discussion 3.1. Characterisation of Farm Sections Initial assessment as shown in Figure 2 (not derived us- ing the NUTMON ®), showed that plantain and cassava were the most intercropped annual crops while cocoa, and to a slightly lesser extent, o il palm were the most in- tercropped perennial crops in the study area. In effect, the two respective crops in each categ ory accounted for more that 50% of observed intercropped frequencies. Interviews confirmed that the farmers were aware of the progressive decline in land productivity over the yea- rs, a phenomenon attributed to continuous cropping on the same fields, soil erosion and most especially the dim- inishing supplies of manure. However, they were not aw- are of the fate of macro nutrients in these processes and/  Nutrient Flows in Perennial Crop-Based Farming Systems in the Humid Forests of Cameroon Copyright © 2010 SciRes. AJPS 42 or how this affected their soil productivity. 3.2. Analysis of Nutrient Flows in Farm Units The overall N-P-K nutrient flows showed that these flo- ws varied with the n utrien ts un der consid eratio n an d with the distribution factors considered (Figure 3). N, P and K in-flows seemed to be evenly distributed between imported organic fertiliser (IN1a), wet and dry atmospheric deposition (IN3), N-fixation (IN4) and to a lesser extent the minerals in harvested produce. This, ho- wever, was not the case for out-flows as the proportions varied considerably with the nutrients considered. First, the greatest nutrient loss was that of nitrogen, and this was mainly attributed to leaching (~70%), volatilization (~20%), and to exported crops and crop residues. Very little of P and K were lost from the farms. Instead, these 0 10 20 30 40 50 Plantain Cas sava Pumpkin Maize Maize Rice Pineapple Taro/Cocoyam Yam Banana Bean Frequency (%) a 0 10 20 30 40 50 Cocoa Oil palm Rubber Avocado Njansang Papaya Cas hew Guava Ma ngo Oranges Plum Frequency (%) b Figure 2. Frequency of occurrence of the main (a) annual crops and (b) perennial crops associated in the perennial crop based smallholdings. 0 5000 10000 15000 20000 25000 30000 Mineral fertiliser, IN1 Imported organic fertilise r, IN2a Imported manure, IN2b At m ospheric depos it ion, IN3 N-fixation, IN4 Harvests, OUT1 Exported crop residues, OUT2a Manure excr etion outside f arm, OUT 2b Leaching, O UT 3 Gaseous loss, O U T4 E rosi o n, O UT5 Qua ntity o f nutrients tra nsfe r re d, g -40000 -30000 -20000 -10000 0 10000 20000 Full balancePartial balance Nutrients transferred ( kg/ha) NP K Figure 3. Overall N-P-K nutrient flows for the farms studied, as well as the specific full and partial balance of N-P-K nutrient transfers (insert).  Nutrient Flows in Perennial Crop-Based Farming Systems in the Humid Forests of Cameroon Copyright © 2010 SciRes. AJPS 43 nutrients were mostly obtained from imported organic fe- rtilisers and atmospheric deposition. These figures were confirmed by the rather different overall balances, nega- tive for nitrogen and positive for phosphorus and potass- ium (Figure 3(a)). On ignoring all losses due to leaching (partial nutrient balance), the overall figures became pos- itive for the three elements, especially for N (Figure 3, insert). This demonstrated that farmers may have inadv- ertently compensated for depletion provoked by harvest- ing of farm produce by returning global biomass at the plot level. 3.3. Nutrient Flows between Farm Units Full and partial balances of the nutrients showed larg e di- fferences between farm units (Figure 4). Whereas all fa- rm units had negative full balances for nitrogen (Figure 4(a)), only about one-quarter of them had a negative par- tial balance for that nutrient (Figure 4(b)). This situation was slightly different for K transferred, but much differ- ent for P. Indeed, almost all the farm units had positive full and partial balances for P wh ile a small proportion of them continued to have negative values for K for both the full and partial balances. These results indicate clearly that leaching might be the most important factor contributing to loss of soil nutrien ts, especially nitrogen. When all the farms were considered as a farm section unit (FSU), the contribution of various modelled factors to the overall nutrient status (Figure 5) as well as to the full and partial nutrient balances (Figure 5, insert) chan- ged considerably. From these, it could be shown that at- mospheric deposition was responsible for most of the N- nutrient transferred into the FSU, followed by N fixation and imported organic fertiliser. Once more, leaching and gaseous loss accounted for most of the N loss while har- vested produce and the exported crop residues accounted for P and K loss. Net nutrient losses in soil N, P and K were much more pronounced in cocoa and oil palm based fields than the Hevea ones. This will certainly be related to the multi- plicity of products harvested from the oil palm and cocoa fields compared to the rubber fields which give essen- tially C, captured though photosynthesis. -90 -60 -30 0 30 60 21 22 23 24 25 26 27 28 2930 31 32 33 34 35 36 37 38 Full balance of nutrients transferred, kg/h a - N -- P -- K - a -40 -20 0 20 40 60 80 21 22 23 24 25 26 27 28 29 30 31 32 33 34 35 36 37 38 Partial balance of nutrients transferred, kg/h a - N -- P -- K - b Figure 4. Specific full and partial balance of overall N-P-K nutrient transfers for the individual farm units. 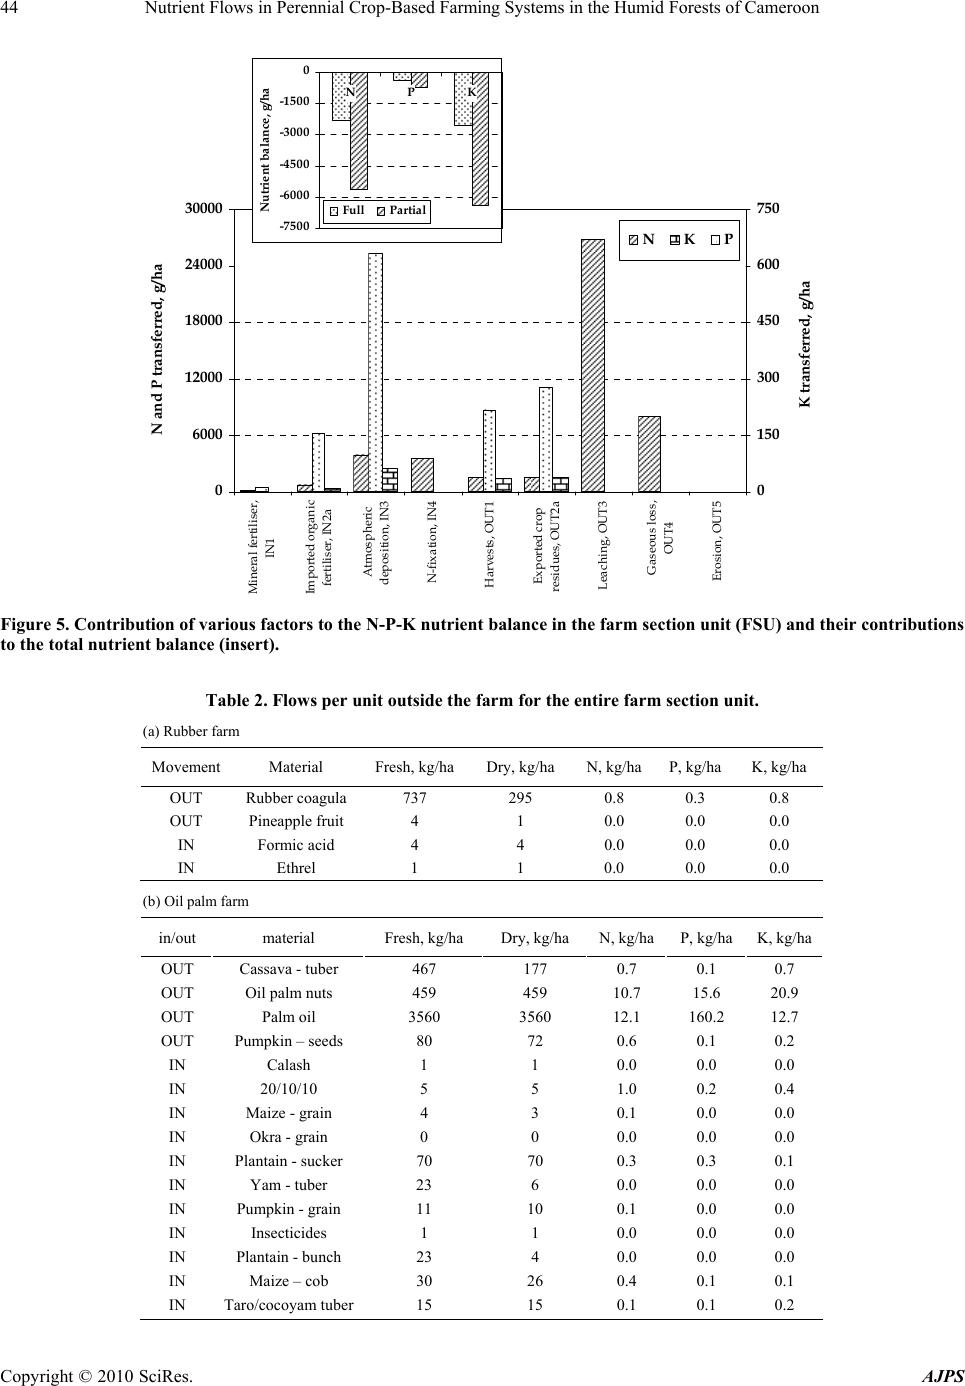 Nutrient Flows in Perennial Crop-Based Farming Systems in the Humid Forests of Cameroon Copyright © 2010 SciRes. AJPS 44 0 6000 12000 18000 24000 30000 Mineral fertiliser, IN1 Imported organic fertiliser, IN2a Atm osph eric deposition, IN3 N-fixation, IN4 Harvests, OUT1 Exported crop residues, OUT2a Leaching, OUT3 Gaseous loss, OUT4 Erosion, OUT5 N and P transferred, g/ha 0 150 300 450 600 750 K transferred, g/ha N K P -7500 -6000 -4500 -3000 -1500 0 N PK Nutrient balance, g/ha Full Pa rtial Figure 5. Contribution of various fac tor s to the N-P-K nutrient balance in the farm section unit (FSU) and their contributions to the total nutrient balance (insert). Table 2. Flows per unit outside the farm for the entire farm section unit. (a) Rubber farm Movement Material Fresh, kg/haDry, kg/ha N, kg/haP, kg/haK, kg/ha OUT Rubber coagula 737 295 0.8 0.3 0.8 OUT Pineapple fruit 4 1 0.0 0.0 0.0 IN Formic acid 4 4 0.0 0.0 0.0 IN Ethrel 1 1 0.0 0.0 0.0 (b) Oil palm farm in/out material Fresh, kg/ha Dry, kg/ha N, kg/haP, kg/ha K, kg/ha OUT Cassava - tuber 467 177 0.7 0.1 0.7 OUT Oil palm nu t s 459 459 10.7 15.6 20.9 OUT Palm oil 3560 3560 12.1 160.2 12.7 OUT Pumpkin – seeds 80 72 0.6 0.1 0.2 IN Calash 1 1 0.0 0.0 0.0 IN 20/10/10 5 5 1.0 0.2 0.4 IN Maize - grain 4 3 0.1 0.0 0.0 IN Okra - grain 0 0 0.0 0.0 0.0 IN Plantain - suck e r 70 70 0.3 0.3 0.1 IN Yam - tuber 23 6 0.0 0.0 0.0 IN Pumpkin - gr ain 11 10 0.1 0.0 0.0 IN Insecticides 1 1 0.0 0.0 0.0 IN Plantain - bunch 23 4 0.0 0.0 0.0 IN Maize – cob 30 26 0.4 0.1 0.1 IN Taro/cocoyam tuber 15 15 0.1 0.1 0.2 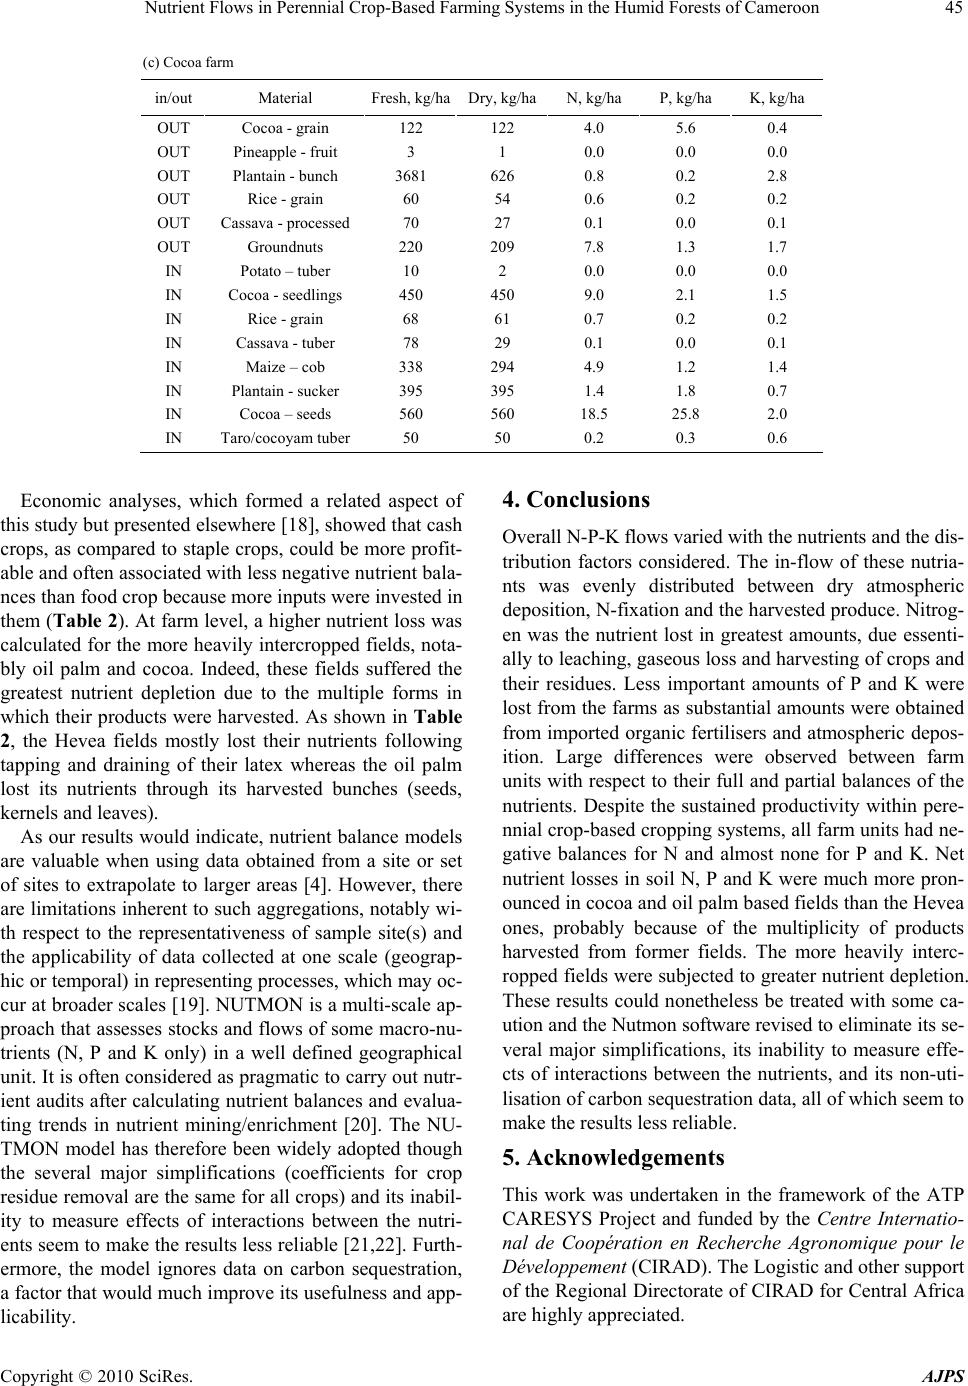 Nutrient Flows in Perennial Crop-Based Farming Systems in the Humid Forests of Cameroon Copyright © 2010 SciRes. AJPS 45 (c) Cocoa farm in/out Material Fresh, kg/haDry, kg/haN, kg/ha P, kg/ha K, kg/ha OUT Cocoa - grain 122 122 4.0 5.6 0.4 OUT Pineapple - fruit 3 1 0.0 0.0 0.0 OUT Plantain - bunch 3681 626 0.8 0.2 2.8 OUT Rice - grain 60 54 0.6 0.2 0.2 OUT Cassava - processed 70 27 0 .1 0.0 0.1 OUT Groundnuts 220 209 7.8 1.3 1.7 IN Potato – tuber 10 2 0.0 0.0 0.0 IN Cocoa - seedlings 450 450 9.0 2.1 1.5 IN Rice - grain 68 61 0.7 0.2 0.2 IN Cassava - tuber 78 29 0 .1 0.0 0.1 IN Maize – cob 338 294 4.9 1.2 1.4 IN Plantain - sucker 395 395 1.4 1.8 0.7 IN Cocoa – seeds 5 60 560 18.5 25.8 2.0 IN Taro/cocoyam tuber 50 50 0.2 0.3 0.6 Economic analyses, which formed a related aspect of this study but presented elsewh ere [18], show ed that cash crops, as compared to staple crops, could be more profit- able and often associated with less negative nutrien t bala- nces than food crop because more inputs were invested in them (Table 2). At farm level, a higher nutrient loss was calculated for the more heavily intercropped fields, nota- bly oil palm and cocoa. Indeed, these fields suffered the greatest nutrient depletion due to the multiple forms in which their products were harvested. As shown in Table 2, the Hevea fields mostly lost their nutrients following tapping and draining of their latex whereas the oil palm lost its nutrients through its harvested bunches (seeds, kernels and leaves ). As our results would indicate, nutrient balance models are valuable when using data obtained from a site or set of sites to extrapolate to larger areas [4]. However, there are limitations inherent to su ch aggregations, notably wi- th respect to the representativeness of sample site(s) and the applicability of data collected at one scale (geograp- hic or temporal) in representing processes, which may oc- cur at broader scales [19]. NUTMON is a multi-scale ap- proach that assesses stocks and flows of some macro-nu- trients (N, P and K only) in a well defined geographical unit. It is often considered as pragmatic to carry out nu tr- ient audits after calculating nutrien t balances and evalua- ting trends in nutrient mining/enrichment [20]. The NU- TMON model has therefore been widely adopted though the several major simplifications (coefficients for crop residue removal are the same for all crops) and its inabil- ity to measure effects of interactions between the nutri- ents seem to make the results less reliable [21,22]. Furth- ermore, the model ignores data on carbon sequestration, a factor that would much improve its usefulness and app- licability. 4. Conclusions Overall N-P-K flows varied with the nutrients an d the d is- tribution factors considered. The in-flow of these nutria- nts was evenly distributed between dry atmospheric deposition, N-fixa tion and the harvested produce. Nitrog- en was the nutrient lost in greatest amounts, due essenti- ally to leaching, gaseous loss and harvesting of crops and their residues. Less important amounts of P and K were lost from the farms as substantial amounts were obtained from imported organic fertilisers and atmospheric depos- ition. Large differences were observed between farm units with respect to their full and partial balances of the nutrients. Despite the sustained productivity within pere- nnial crop-based cropping systems, all farm units had ne- gative balances for N and almost none for P and K. Net nutrient losses in soil N, P and K were much more pron- ounced in cocoa and oil palm based fields than the Hevea ones, probably because of the multiplicity of products harvested from former fields. The more heavily interc- ropped fields were subjected to greater nutrient depletion. These results could nonetheless be treated with some ca- ution and the Nutmon software revised to eli minate its se- veral major simplifications, its inability to measure effe- cts of interactions between the nutrients, and its non-uti- lisation of carbon sequestration data, all of which seem to make the results less reliable. 5. Acknowledgements This work was undertaken in the framework of the ATP CARESYS Project and funded by the Centre Internatio- nal de Coopération en Recherche Agronomique pour le Développement (CIRAD). The Logistic and other support of the Regional Directorate of CIRAD for Central Africa are highly appreciated. 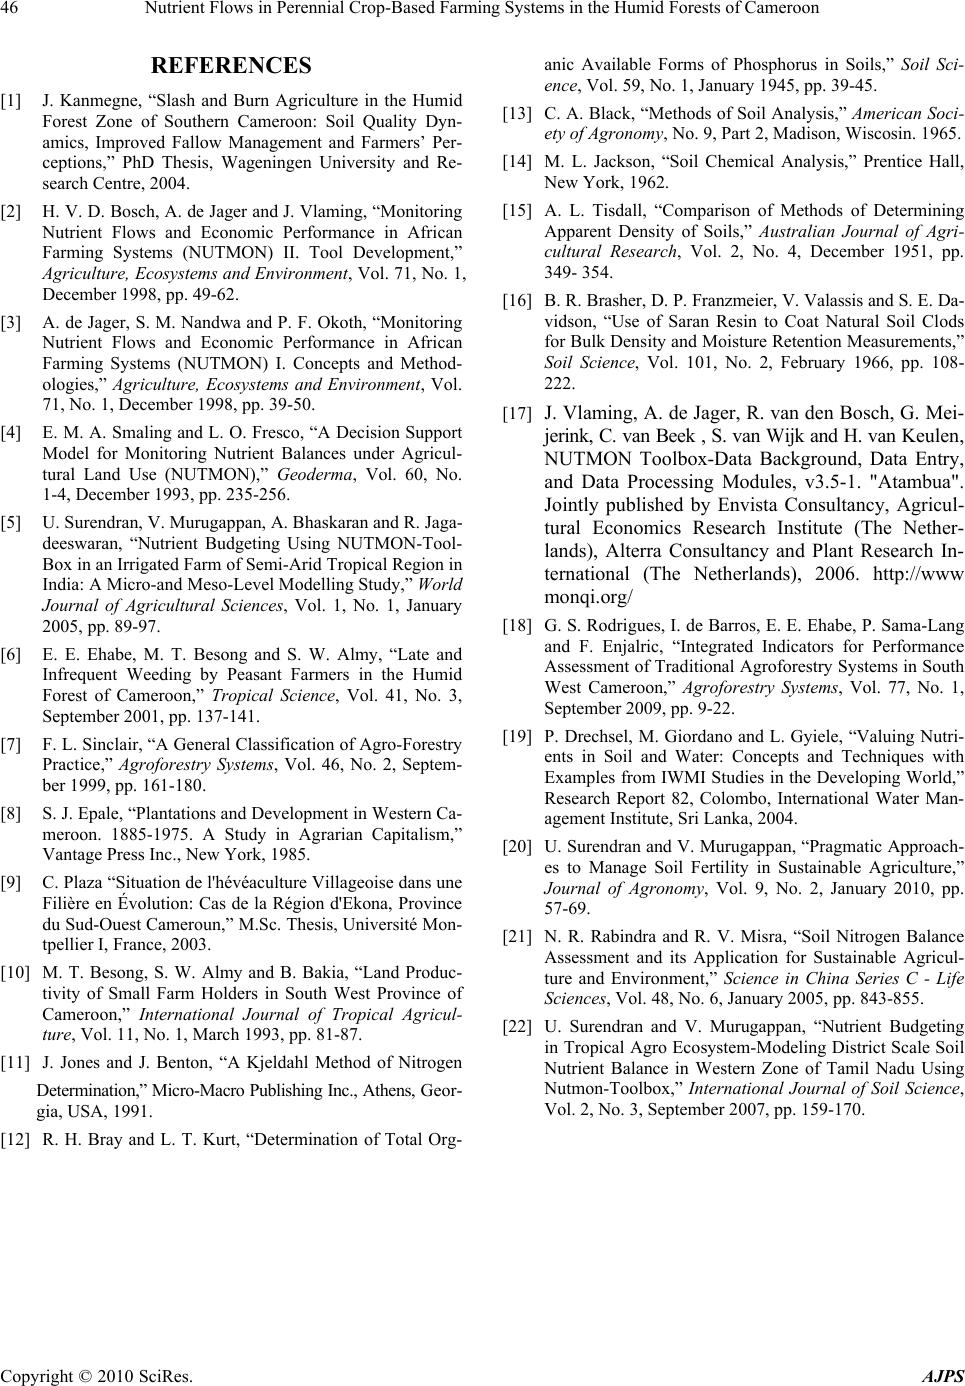 Nutrient Flows in Perennial Crop-Based Farming Systems in the Humid Forests of Cameroon Copyright © 2010 SciRes. AJPS 46 REFERENCES [1] J. Kanmegne, “Slash and Burn Agriculture in the Humid Forest Zone of Southern Cameroon: Soil Quality Dyn- amics, Improved Fallow Management and Farmers’ Per- ceptions,” PhD Thesis, Wageningen University and Re- search Centre, 2004. [2] H. V. D. Bosch, A. de Jager and J. Vlaming, “Monitoring Nutrient Flows and Economic Performance in African Farming Systems (NUTMON) II. Tool Development,” Agriculture, Ecosystems and Environment, Vol. 71, No. 1, December 1998, pp. 49-62. [3] A. de Jager, S. M. Nandwa and P. F. Okoth, “Monitoring Nutrient Flows and Economic Performance in African Farming Systems (NUTMON) I. Concepts and Method- ologies,” Agriculture, Ecosystems and Environment, Vol. 71, No. 1, December 1998, pp. 39-50. [4] E. M. A. Smaling and L. O. Fresco, “A Decision Support Model for Monitoring Nutrient Balances under Agricul- tural Land Use (NUTMON),” Geoderma, Vol. 60, No. 1-4, December 1993, pp. 235-256. [5] U. Surendran, V. Murugappan, A. Bhaskaran and R. Jaga- deeswaran, “Nutrient Budgeting Using NUTMON-Tool- Box in an Irrigated Farm of Semi-Arid Tropical Region in India: A Micro-and Meso-Level Modelling Study,” World Journal of Agricultural Sciences, Vol. 1, No. 1, January 2005, pp. 89-97. [6] E. E. Ehabe, M. T. Besong and S. W. Almy, “Late and Infrequent Weeding by Peasant Farmers in the Humid Forest of Cameroon,” Tropical Science, Vol. 41, No. 3, September 2001, pp. 137-141. [7] F. L. Sinclair, “A Genera l Classification of Agro-Forestry Practice,” Agroforestry Systems, Vol. 46, No. 2, Septem- ber 1999, pp. 161-180. [8] S. J. Epale, “Plantations and Development in Western Ca- meroon. 1885-1975. A Study in Agrarian Capitalism,” Vantage Press Inc., New York, 1985. [9] C. Plaza “Situation de l'hévéaculture Villageoise dans une Filière en Évolution: Cas de la Région d'Ekona, Province du Sud-Ouest Cameroun,” M.Sc. Thesis, Université Mon- tpellier I, France, 2003. [10] M. T. Besong, S. W. Almy and B. Bakia, “Land Produc- tivity of Small Farm Holders in South West Province of Cameroon,” International Journal of Tropical Agricul- ture, Vol. 11, No. 1, March 1993, pp. 81-87. [11] J. Jones and J. Benton, “A Kjeldahl Method of Nitrogen Determination,” Micro-Macro Publishing Inc., Athens, Ge o r - gia, USA, 1991. [12] R. H. Bray and L. T. Kurt, “Determination of Total Org- anic Available Forms of Phosphorus in Soils,” Soil Sci- ence, Vol. 59, No. 1, January 1945, pp. 39-45. [13] C. A. Black, “Methods of Soil Analysis,” American Soci- ety of Agronomy, No. 9, Part 2, Madison, Wiscosin. 1965. [14] M. L. Jackson, “Soil Chemical Analysis,” Prentice Hall, New York, 1962. [15] A. L. Tisdall, “Comparison of Methods of Determining Apparent Density of Soils,” Australian Journal of Agri- cultural Research, Vol. 2, No. 4, December 1951, pp. 349- 354. [16] B. R. Brasher, D. P. Franzmeier, V. Valassis and S. E. Da- vidson, “Use of Saran Resin to Coat Natural Soil Clods for Bulk Density and Moisture Retention Measurements,” Soil Science, Vol. 101, No. 2, February 1966, pp. 108- 222. [17] J. Vlaming, A. de Jager, R. van den Bosch, G. Mei- jerink, C. van Beek , S. van Wijk and H. v an Ke ul en , NUTMON Toolbox-Data Background, Data Entry, and Data Processing Modules, v3.5-1. "Atambua". Jointly published by Envista Consultancy, Agricul- tural Economics Research Institute (The Nether- lands), Alterra Consultancy and Plant Research In- ternational (The Netherlands), 2006. http://www monqi.org/ [18] G. S. Rodrigues, I. de Barros, E. E. Ehabe, P. Sama-Lang and F. Enjalric, “Integrated Indicators for Performance Assessment of Traditional Agroforestry Systems in South West Cameroon,” Agroforestry Systems, Vol. 77, No. 1, September 2009, pp. 9-22. [19] P. Drechsel, M. Giordano and L. Gyiele, “Valuing Nutri- ents in Soil and Water: Concepts and Techniques with Examples from IWMI Studies in the Developing World,” Research Report 82, Colombo, International Water Man- agement Institute, Sri Lanka, 2004. [20] U. Surendran and V. Murugappan, “Pragmatic Approach- es to Manage Soil Fertility in Sustainable Agriculture,” Journal of Agronomy, Vol. 9, No. 2, January 2010, pp. 57-69. [21] N. R. Rabindra and R. V. Misra, “Soil Nitrogen Balance Assessment and its Application for Sustainable Agricul- ture and Environment,” Science in China Series C - Life Sciences, Vol. 48, No. 6, January 2005, pp. 843-855. [22] U. Surendran and V. Murugappan, “Nutrient Budgeting in Tropical Agro Ecosystem-Modeling District Scale Soil Nutrient Balance in Western Zone of Tamil Nadu Using Nutmon-Toolbox,” International Journal of Soil Science, Vol. 2, No. 3, September 2007, pp. 159-170. |

