Theoretical Economics Letters
Vol.09 No.06(2019), Article ID:94776,13 pages
10.4236/tel.2019.96134
Is the Socio-Economic Status of the Households below Poverty Line a Key Indicator towards the Choice of Cooking Fuel as LPG?
Suchitra Pal1* , Satyasiba Das2
1Xavier School of Human Resource Management, Xavier University, Bhubaneswar, India
2Indian Institute of Management, Raipur, India

Copyright © 2019 by author(s) and Scientific Research Publishing Inc.
This work is licensed under the Creative Commons Attribution International License (CC BY 4.0).
http://creativecommons.org/licenses/by/4.0/


Received: July 1, 2019; Accepted: August 27, 2019; Published: August 30, 2019
ABSTRACT
This study explores the factors that make an impact on the choice of cooking fuel, in our case, Liquefied Petroleum Gas (LPG) among the urban poor in the smart city, Bhubaneswar, Odisha, India. In earlier studies, multiple socio-economic and market-related factors (e.g. distribution and pricing), are discussed as determinants which ultimately determine the households cooking fuel choice. This study focuses on household characteristics that can impact the choice of cooking fuel. Primary data collection was carried out in 3036 households in three urban-slums of Bhubaneswar, Odisha, India and was used as a sample for the study. The analysis revealed that along with income and socioeconomic status, other household characteristics are also important in determining the choice of cooking fuel. A major finding of the study is that unaffordability is not the only criteria in the choice of cooking fuel. The choice of cooking fuel of a family is basically a function of external and household specific factors.
Keywords:
LPG, BPL, Cooking Fuel, Urban

1. Introduction
Usage of traditional biomass fuels for cooking has become an old-age practice in many developing countries. While large scale urbanization, societal awareness and increased per capita income have encouraged the use of cleaner sources of energy [1] in many developing countries traditional biomass-based fuels are still predominantly used for domestic cooking [2] . Traditional energy forms such as firewood, charcoal and agricultural residues are still easily available and widely used as cooking fuel in India [3] . The 2011 report of the International Energy Agency (IEA) reported that over 2.7 billion people are depending on traditional biomass for cooking and by 2030 the number will reach close to 100 million or more [4] [5] . Many studies like this are focusing on the energy choices of rural India [6] [7] . So in this present paper, the focus is shifted from rural households to urban below poverty line household’s residing in slums and their choice towards LPG as cooking fuel choice.
Literature Review
There have been extensive studies done in the field of household energy consumption. The traditional view on fuel choice has been the energy ladder approach [8] . Fuel laddering, as a concept, emphasizes on the fact that households move to cleaner and better energy sources as their income level rises [3] . This approach was critiqued partially by [9] who observed the pattern of Mexican household energy consumption. The authors suggest that household energy consumption follows more of a stacking pattern rather than an incremental ladder pattern. Households switch to or include cleaner and more convenient fuels with the other fuels they use as their income and socioeconomic status rises. This process is often called fuel switching [10] or fuel stacking [9] to reflect the fact that several fuels are often used concurrently in the same household. Fuel switching generally occurs faster in urban areas compared to rural areas [10] [11] [12] . Possible explanations for the lower rate of fuel switching in the rural areas include a lack of infrastructure for modern fuels [8] , lower or non-monetary sporadic income, a traditional lifestyle and smaller opportunities in the cost of time, in addition to the higher availability of collectible fuels and the decision-making status of women in the household. Additionally, the availability of biomass strongly influences the path of urban fuel switching [13] . For Indian consumers [14] , their income and the location i.e., whether they are rural or urban, are the most significant factors in determining a household’s energy consumption.
There has been extensive research in the fields of household fuel consumption and factors predicting the same. While studies have been focusing around many developing economies such as Ghana, Ethiopia, Mexico and Vietnam, few empirical studies are available in India. The major focus of this paper is whether the findings from other countries are consistent with India or are there are different factors in India, which determine the energy choices in urban slum households. 20 years ago, the study by [15] suggested that the underlying fuel transition of India is consistent with the other developing countries. The study by [15] was conducted 20 years ago and, from that time, India has undergone a massive transformation in terms of urbanization, change in per capita income and availability of fuel options. The present study will focus on understanding the current day today scenario of household energy consumption and whether it is different from the previous studies.
[8] focused on the traditional view on the choice of cooking fuel i.e., the energy ladder, whereas households move towards cleaner and better energy sources as their income rises. Past studies consistently indicate a strong correlation between household income levels and the types and amounts of fuel used for cooking [8] [16] . However, subsequent studies defy the findings; the findings were presented based on Mexican households by [12] , which focused on fuel stacking which is where households include cleaner energy options in their fuel basket as their income rises.
A study by [17] proved that fuel choices by households are determined by socio-economic factors. This study suggested that economic status and price of alternative energy sources are important determinants of fuel choice in urban Ethiopia. The study also suggested the use of multiple fuels or “fuel stacking” behaviour in households. Consistent with the above literature review by Mekonnen and Köhlin and in a study on Ghanaian households by [18] , it was again reiterated that the fuel ladder concept is not robust. From the Ghana living standards survey, it was found that the most preferred fuel is LPG, followed by charcoal, and kerosene is the least preferred option. While Kerosene has price-elastic demand, the price elasticity of demand for other types of fuels examined is inelastic. Households tend to follow the fuel stacking method since it helps them to mitigate the potential vulnerability in case of dynamic fuel prices and it ensures energy stability.
While the literature review clearly indicates the significance of the economic perspective of the decision-making process, in this study we will try to identify potential psychosocial factors which emerge from household characteristics which are also elementary in determining a household’s energy choice. The survey of BPL households revealed various reasons for preferring or not preferring LPG as a source of cooking fuel. The objective of this study is to understand whether income continues to dominate the choice of fuel in households or are there other characteristics of a household which affect a household’s energy choice. There are a set of factors which came out as a part of the survey and can be demarcated as internal and external factors. We will particularly focus on testing the hypothesis of usage of LPG versus social status, economic status; type of house they live in and the approximate time spent on cooking and analyse the characteristics of which are the most important in determining the choice of fuel. The hypothesis to be tested would be whether or not household characteristics have an impact on LPG usage.
Research Aim 1: Is the size of a family i.e. number of members in a family, a factor in determining the fuel choice of a household?
Research Aim 2: Does the type of the house, i.e. pukka (house made of brick and concrete, structurally strong), semi pukka or kuccha (made of bamboo, and earthy materials, generally temporary in nature) impact the choice of fuel by a household?
Research Aim 3: Can the characteristic of a household’s using or not using LPG be grouped in homogenous clusters based on social status, economic status, monthly income, and time spent on cooking?
2. Method
2.1. Data and Sample
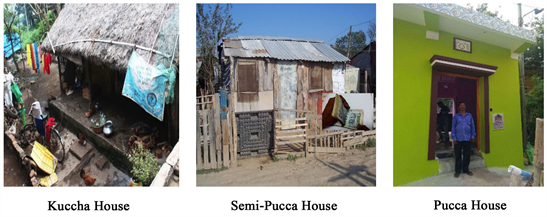
Primary data collection was carried out amongst 3036 households in three urban slums in Bhubaneswar, Odisha. The sample is of the urban poor who were distributed across various socio-economic strata. A majority of the respondents were males (61%). The respondents live in three kinds of houses i.e., kuccha (10.3%), semi pucca (73.4%) and pucca (16.3%). Kuccha houses are made of materials such as mud, dry leaves, straw, and bamboo. In a semi pucca structure either the roof or walls but not both are made of pucca materials like burnt bricks, stone, cement, concrete or timber while pucca houses both roof and wall are made of such material. The houses may or may not have a separate cooking area.
In terms of occupation (reported in Figure 1), most of the respondents were labourers (43.49%) followed by small business (14.36%), drivers (11.39%), and masons (5.83%). In terms of economic status, the sample can be divided into Above Poverty Line (1%), Below Poverty Line (40%), Ration Card Holders (54%) and members of the Antyodaya Program (5%). The economic concept of being below the poverty line is used to demarcate individuals and households who live below a certain income level and require assistance from the state for their survival. Internationally 1.90 dollars per day per head of purchasing power parity is the stated benchmark for the poverty line. Ration cards are an official document which entitles the holder to a ration of various goods ranging from food to fuel which is issued by the Government of India. The Indian government works out the Public Distribution System in the country by the help of the ration card which helps in establishing the eligibility and entitlement for the goods. Antyodaya Anna Yojana is a Government of India sponsored scheme to provide subsidized food to the poorest of the poor of India. The Government has provisions up to 35 kilograms of rice and wheat at a highly subsidized cost of three rupees per kilogram of rice and two rupees per kilogram of wheat.

Figure 1. Occupation of the respondents.
In terms of social status (see Figure 1), the sample is divided into Scheduled Caste (20%), Scheduled Tribe (12%), Other Backward Classes (31%), General Category (36%) and Minorities (1%). The Scheduled Caste and Scheduled Tribe are officially classified by the Government of India as classes or sections of the society who are underdeveloped, socially and educationally disadvantaged. The general class in India are groups who do not have any special status and are not entitled to any reservation benefits and are often referred to as the forward classes. Minority status is for religious communities in India which include Muslims, Sikhs, Christians, Buddhists, Zoroastrians, and Jains. In terms of the economic condition of the sample population, 12% of the households have an average income from 2000 to 5000 Indian rupees, 58% have an income from 5000 to 10,000 Indian rupees and 31% of the households have an income above 10,000 Indian rupees.
2.2. Statistical Techniques Used
In this study, our aim is to find if the variables relating to the household characteristics are of utmost importance in determining a household’s energy choices and what drives their decision. We use regression techniques to arrive at the importance of the variables. The data is more on the categorical side hence we use the logistic and multinomial logistic regression method to arrive at the results. We also used the cluster analysis technique to build homogenous clusters of users and non-users of LPG, based on the household characteristics.
3. Results and Analysis
Logistic Regression is used to analyze the data with an independent variable, that is, whether or not a family uses LPG as cooking fuel. The independent variable used in this regression model is the number of members in the family, intuitively, larger families would have more cooking requirements and hence traditional forms of cooking fuel would entail more time consumption in cooking. Our aim is to determine the probability of a family using LPG given we have the number of family members that they have. The average number of members in the family as per the data is four while the minimum is one and the maximum is twenty. We will determine the probability of LPG usage given we have the number of family members. On attempting logistic regression while it is found that it is not highly significant in terms of determining LPG usage or non-usage (Although it does have a slight impact in terms of probabilities), it is however of utmost importance in determining behaviours related to fuel stacking which is consistent with previous research.
The equation of the Logit model is given by:
(1)
where P is the Probability of the family using LPG (odd of y being equal to 1). The Probability of the participant is calculated using the following formula:
(2)
On examining the probabilities, it is noticed that there is a slight drop in the probability of using LPG as a source of fuel as the number of members in the family increase. The reasons attributed to this are more the number of people, the more the cooking requirement hence more requirement of fuel ultimately leading to higher cooking costs. Families hence engage in fuel stacking to keep a check on their expenditure in terms of cooking fuel. The graph reported in Figure 2 highlights indicative probabilities of a household using LPG as a fuel and the decreasing trend in the probabilities as the number of family members increase.
In terms of fuel choice, it is found that LPG, Firewood and Kerosene are highly used with 42%, 29% and 22% households using them as primary fuel while electric heaters, charcoal is least preferred with a negligible percentage of households using those. Past studies on fuel choice highlight the importance of

Figure 2. Graphical representation of the probability of using LPG as cooking fuel based on the household size.
household characteristics in determining the fuel options used. Most studies have hinted towards household size as being an important metric in determining the fuel choice.
Multinomial logistic regression was used to understand how significant types of houses are in determining the usage or non-usage of LPG. There are 3 kinds of houses which the families live in kuccha, pukka and semi pukka houses. A key finding in terms of trends in LPG usage amongst the BPL population revealed that the consumers are concerned about the safety issues which are associated with the usage of LPG. In kuccha and semi pukka households, there are cases where there is no separate kitchen facility available and cooking is done inside or outside the house. The fear is that young children might have access to such places and hence it is considered to be unsafe. By means of logistic regression, we will arrive at probabilities of using or not using LPG based on the type of the house. In this case, we conduct a multinomial logistic regression where we use the number of members in the family as a continuous independent variable.
Dependent Variable: Users and Non-users of LPG coded as 1 and 0 respectively (categorical) independent variable: number of members in the family (continuous) independent variable: type of house-pukka, semi pukka and kuchha (categorical). Firstly, we test the null hypothesis, that, whether there is any difference between the null and the final model. The null model contains the intercept only and does not consider the independent variables whilst the final model consists of the intercept and the independent variables. On testing the level of significance, we see that there is a significant difference between the null and the final model and hence we reject the null hypothesis concluding that there is a significant difference between the null and final model.
From the Model Fitting Information, we conduct the likelihood ratio test of the final model against the null model (see Table 1). The Chi-square statistic value of 73.955 is the difference between −2 log likelihoods of the Null and the final models. In this case, the significance level is less than 0.05 hence we can conclude that the final model with all the parameters, is better than the null model.
From the Pseudo r square values reported in Table 2, we can understand that the independent variables (types of house and the number of members in the family is not the only predictor of user or non-user of LPG) are not enough to build the predictive model and we need to consider more/other independent variables to build a robust model.
From the likelihood ratio test results (see Table 3), we can determine which variables in logistic regression are highly significant in determining the usage and non-usage of LPG. While as we noticed earlier, the number of members in the household does have a major impact on the usage of LPG, the type of house that they stay in does have a major impact on their decision because it is also tied to their economic status.
From the parameter estimation reported in Table 4, we can determine the regression equation and the probability of LPG usage as it changes as there is a

Table 1. Model fitting information based on multinomial logistic regression.
Table 2. Pseudo R square values.
Table 3. Goodness of fit results based on multinomial logistic regression.
change in the type of house and the number of family members. The parameter estimates come up to be −1.932 for Pukka House and −1.830 for Semi Pukka. The significance level of these estimates is 0.00, hence they are highly significant.
Cluster analysis was done to create homogenous groups of LPG users and non-users as reported in Table 5. Cluster Analysis is a grouping technique wherein based on a given set of conditions, we divide the sample into homogenous subgroups based on a few independent variables. Cluster analysis coupled with discriminant analysis helps us in determining the variables which are keys in determining the composition of the homogenous groups. Such independent variables are called cluster variants and are very clear from Table 5. In this study, we attempt cluster analysis where we build two clusters using SPSS based on usage and non-usage of LPG. The variables used for clustering are:
1) Social status i.e. Scheduled Caste, Scheduled Tribe, Other Backward Caste, General and Minority; 2) Monthly Income i.e., more than 2000, more than 5000 and more than 10000; 3) Economic Status i.e., Above Poverty Line, Below Poverty Line, Ration Card holders, Antodaya and others; 4) Approximate Time spent on cooking is as per the data shared by the households.
The final cluster centres (see Table 6) after considering the iterations focus on two clusters. The non-users of LPG are the low-income group households from the scheduled tribe and the users of LPG are the medium- to higher-income households from the other backward caste categories. The first cluster is more prone towards using firewood as the primary means of cooking while there is a significant population which uses LPG as well but that is one of the multiple fuel choices that they keep available for themselves. These findings are consistent with the past studies although social status was not used as a metric; the reason is that most of the studies were conducted in regions other than India where social status is not as profound. Social status in Indian households determines the ghettos that they reside in and also their tastes and preferences.
Table 4. Likelihood ratio test results based on multinomial logistic regression.
a. This reduced model is equivalent to the final model because omitting the effect does not increase the degrees of freedom.
Table 5. Parameter estimates from the multinomial logistic regression.
Table 6. Cluster analysis results.
4. Discussion
Research Aim 1: Is the size of a family i.e. number of members in a family, a factor in determining the fuel choice of a household?
By statistical analysis we arrive at the conclusion that family size is not a significant factor in determining a household’s energy choice, however, the probability of a household using LPG as a cooking fuel reduces as the family size increases. The reason attributed to this finding could be that households indulge in fuel stacking more when the family size is bigger. While households do use LPG as a source of cooking fuel, it is not the only source of cooking fuel. However, the impact of this variable is not highly significant, although this variable cannot be rejected outright as a deterministic variable. When the size of the household increases, they tend to stack different fuel types such as charcoal or kerosene to meet the increasing energy demand [19] . A household which is larger and has many females often means that the opportunity cost to collect firewood is low and there is an increased potential of fuel stacking [10] [20] [21] .
Further examining the data, we also found that amongst the households who use LPG as a cooking source, 40% of the households use 5-kilogram LPG cylinders while 60% use 14.2-kilogram cylinders. The extensive use of small cylinders is also an indication of the household’s fuel stacking. While they use LPG as one source, it may or may not be their primary source of cooking fuel. The findings from this study are consistent with the past surveys and we can safely conclude that household size continues to be a metric which determines the options for fuel choice of the households. Households continue stacking fuel options which ensure energy stability and reduce vulnerability towards fluctuating disposable income and fuel prices.
Research Aim 2: Does the type of the house i.e., pukka, semi pukka or kuccha, impact the choice of fuel by a household?
Naturally, we could say that a household’s income determines the type of house that they live in. However, this is not completely true in case of this survey and probably in the case of BPL population residing in the slums of the studied sample. The reason attributed to this finding could be that families sometimes tend to stay in the same house even if their income increases. There is a kind of social inertia and geographical affinity to the locality in these cases, which prevent them from moving to other areas. Hence, economic status at times cannot be deterministic of the type of house that a family resides in. This variable is important in determining whether the household would use LPG or not since they cited safety as a reason for not using LPG. In semi pukka and kuccha houses, there are at times no separate kitchen or cooking area and cooking is primarily done outside the house which prevents the household from using LPG. They also believe that it is not safe to cook within the house while children are around and hence the results also predicted that the probability of using LPG is highest in pukka houses followed by semi pukka and lastly kuccha houses. In a study by [22] in the Kisumu District of Kenya, the findings were that the household fuel choice depends on whether the household-dwelling unit is traditional or modern and also whether or not the household dwelling is owned.
Research Aim 3: Can the household’s using or not using LPG be grouped in homogenous clusters based on social status, economic status, monthly income, and time spent on cooking?
Basically, to answer this question, households would fall into two homogenous clusters; we use a set of variables to understand which ones are significant in determining whether the household would or would not use LPG as cooking fuel. Social status and monthly income came out as significant variables while approximate time spent on cooking and economic status was not significant in determining the household’s energy choice. Social status is important in homogenous grouping because households below the poverty line tend to live in common ghettos and have similar taste and preferences in cooking. Hence, they could be grouped into categories based on the parameter. Similarly, various income brackets tend to have similar behaviour and hence there is homogeneity in such brackets. Understanding occupation as a metric is important because by qualitative analysis, we can determine that the majority of these occupations have a sporadic income flow. We will use this understanding later in our study. Only 3% of the sample is occupied by government jobs and 7% by a private job which ensures a stable income. Around 58% of the sample’s households earn between 5000 to 10,000 Indian rupees per months while 12% of the households are earning around 2000 to 5000 Indian rupees per month. Hence, we can conclude that most of the households are in the low-income bracket and have a low per capita income given the household size of the sample.
However, it should come as a surprise that economic status is not significant, while monthly income is significant in determining the household’s energy choice. The reason being the economic status i.e., BPL, ration card, Antodaya, etc. is not always authentic and people tend to forget documentation to receive the benefits and many a time these statuses are not updated as per the latest economic condition of the families. Hence, they cannot be used as a determining variable in such studies. Lastly, approximate time spent on cooking is also not a driving factor because the families may not have reported the right time durations and sometimes cooking is done in phases which make it difficult for any household to report the right time for the survey and they tend to approximate the time.
By performing a K mean cluster analysis, we arrive at the conclusion that along with the type of social status, the monthly income is significant in determining the fuel choice. While in previous studies it was highlighted that households consider the opportunity of cost of time in determining fuel choices, in our study that is highly insignificant, and the approximate time spent on cooking does not influence a household’s energy choice in any way. Social status is a key determinant of the household characteristics i.e., taste and preferences in cooking, type of cooking, etc. and hence from the level of significance, we can clearly conclude that it is of great importance in determining the fuel choice. Economic Status of the APL, BPL, Ration Card, etc., in the poorer households, is sometimes not correctly assessed, the reasons being sporadic income, lack of appropriate data, etc., and hence that cannot be used as a metric to arrive at any conclusions. The findings are consistent with the study on urban households in Bauchi Metropolis in Nigeria [23] where the type of dwelling and socio-economic status was the key to determine the fuel choice of households.
5. Conclusion and Future Implications
From this study, we can safely arrive at the conclusion that household characteristics (For e.g., number of members in the family, type of houses and size of the houses) are of great importance in determining the fuel choice of the household in urban BPL families. Previous studies by [3] [24] [25] reported that in rural household income plays a significant role in the adoption and use of LPG. The likeliness that a household would start using LPG once increases in their income but as we have seen in our analysis, household characteristics play a major role in determining the fuel choice. Socioeconomic conditions govern the fuel choice of the household. Size of the household and social status is important in this study since they model the attitude of the household towards cleaner fuel choice. Fuel stacking came as a strong behaviour given lower-income households tend to stack multiple sources of energy to add on to their energy security and reduce their vulnerability towards fluctuations in fuel prices. Policymakers would have to focus on socio-economic characteristics to reach the bottom of the issue of probing lower-income household’s usage of fuel for cooking. The study has also shed light on the awareness aspect of the households where they have cited reasons like “unsure about safety”, in using LPG. Policymakers would have to focus on all these aspects to promote the usage of cleaner fuels. In the same time, if the income of the BPL households and the size of the houses will not increase, they will not get motivated towards cleaner cooking fuel use.
Conflicts of Interest
The authors declare no conflicts of interest regarding the publication of this paper.
Cite this paper
Pal, S. and Das, S. (2019) Is the Socio-Economic Status of the Households below Poverty Line a Key Indicator towards the Choice of Cooking Fuel as LPG? Theoretical Economics Letters, 9, 2126-2138. https://doi.org/10.4236/tel.2019.96134
References
- 1. IEA (International Energy Agency) (2004) World Energy Outlook 2004. International Energy Agency, Paris.
- 2. Foell, W., Pachauri, S., Spreng, D. and Zerrffi, H. (2011) Household Cooking Fuels and Technologies in Developing Economies. Energy Policy, 39, 7487-7498. https://doi.org/10.1016/j.enpol.2011.08.016
- 3. Jain, A., Agrawal, S. and Ganesan, K. (2014) Rationalizing Subsidies, Reaching the Underserved. Council of Energy, Environment and Water, New Delhi.
- 4. IEA (International Energy Agency) (2010) World Energy Outlook 2004. International Energy Agency, Paris.
- 5. IEA (International Energy Agency) (2011) Energy for All-Financing Access for the Poor. IEA, Paris, France.
- 6. Sinha, C.S., Sinha, S. and Joshi, V. (1998) Energy Use in the Rural Areas of India: Setting up a Rural Energy Data Base. Biomass & Bioenergy, 14, 489-503. https://doi.org/10.1016/S0961-9534(97)10059-9
- 7. Gould, C.F. and Urpelainen, J. (2018) LPG as a Clean Cooking Fuel: Adoption, Use and Impact in Rural India. Energy Policy, 122, 395-408. https://doi.org/10.1016/j.enpol.2018.07.042
- 8. Leach, G. (1992) The Energy Transitions. Energy Policy, 20, 116-123. https://doi.org/10.1016/0301-4215(92)90105-B
- 9. Masera, O., Saatkanp, B. and Kammen, D. (2000) From Linear Fuel Switching to Multiple Cooking Strategies: A Critique and Alternative to the Energy Ladder Model. World Development, 28, 2083-2103. https://doi.org/10.1016/S0305-750X(00)00076-0
- 10. Heltberg, R. (2004) Fuel Switching: Evidence from Eight Developing Countries. Energy Economics, 26, 869-887.
- 11. Heltberg, R. (2005) Factors Determining Household Fuel Choice in Guatemala. Environment and Development Economics, 10, 337-361.
- 12. Gundimeda, H. and Kohlin, G. (2008) Fuel Demand Elasticities for Energy and Environmental Policies: Indian Sample Survey Evidence. Energy Economics, 30, 517-546. https://doi.org/10.1016/j.eneco.2006.10.014
- 13. Barnes, D.F., Krutilla, K. and Hyde, W. (2005) The Urban Household Energy Transition: Energy, Poverty, and the Environment in the Developing World. World Bank, Washington DC.
- 14. Pachauri, S. (2004) An Analysis of Cross-Sectional Variations in Total Household Energy Requirements in India Using Micro Survey Data. Energy Policy, 32, 1723-1735. https://doi.org/10.1016/S0301-4215(03)00162-9
- 15. Alam, M., Sathaye, J. and Barnes, D. (1998) Urban Household Energy Use in India: Efficiency and Policy Implications. Energy Policy, 26, 885-891. https://doi.org/10.1016/S0301-4215(98)00008-1
- 16. Cecelski, E., Dunkerley, J. and Ramsay, W. (1979) Household Energy and the Poor in the Third World. Resources for the Future, Washington DC.
- 17. Mekonnen, A. and Kohlin, G. (2008) Determinants of Household Fuel Choice in Major Cities of Ethiopia. Environment for Development Discussion Paper Series, 36, 8-18.
- 18. Akpalu, W, Dasmani, I. and Aglobitse, P. B. (2011) Demand for Cooking Fuel in Developing Country. To What Extent Do Taste and Preference Matter? Energy Policy, 39, 6525-6531. https://doi.org/10.1016/j.enpol.2011.07.054
- 19. Ngui, D., Osiolo, H., Mutua, J. and Aligula, E. (2011) Household Energy Demands in Kenya: An Application of the Linear Approximate Almost Ideal Demand System (CA-AIDS). Energy Policy, 39, 7084-7094. https://doi.org/10.1016/j.enpol.2011.08.015
- 20. Van der Karoon, B., Brouwer, R. and Van Beukering, P.J.H. (2013) The Energy Ladder: Theoretical Myth or Empirical Truth? Results from a Meta-Analysis. Renewable & Sustainable Energy Reviews, 20, 504-513. https://doi.org/10.1016/j.rser.2012.11.045
- 21. Rao, M.N. and Reddy, B. (2007) Variations in Energy Use by Indian Households. An Analysis of Micro Level Data. Energy, 32, 143-153. https://doi.org/10.1016/j.energy.2006.03.012
- 22. Pundo, M. and Fraser, G. (2006) Multinomial Logit Analysis of Household Cooking Fuel Choice in Rural Kenya: The Case of Kisumu District. Agrekon, 45, 24-37. https://doi.org/10.1080/03031853.2006.9523731
- 23. Bisu, Y., Kuhe, A. and Lortyer, H. (2016) Urban Household Cooking Energy Choice: An Example of Bauchi Metropolis, Nigeria. Energy, Sustainability and Society, 6, 15-18. https://doi.org/10.1186/s13705-016-0080-1
- 24. Lucon, O., Coelho, S.T. and Goldemberg, J. (2004) LPG in Brazil: Lessons and Challenges. Energy for Sustainable Development, 8, 82-90. https://doi.org/10.1016/S0973-0826(08)60470-6
- 25. Yadama, G.N. (2013) Fires, Fuel, and the Fate of 3 Billion: The State of the Energy Impoverished. Oxford University Press, Oxford.