International Journal of Astronomy and Astrophysics, 2012, 2, 119-124
http://dx.doi.org/10.4236/ijaa.2012.23016 Published Online September 2012 (http://www.SciRP.org/journal/ijaa)
Copyright © 2012 SciRes. IJAA
Numerical Investigations of a New N-Body Simulation
Method
E. Vilkoviskij
Fesenkov Astrophysical Institute, Observatory, Almaty, Kazakhstan
Email: vilk@aphi.kz
Received July 4, 2012; revised August 10, 2012; accepted August 17, 2012
ABSTRACT
Numerical investigation of a new similarity method (the Aldar-Kose method) for N-body simulations is described. Us-
ing this method we have carried out numerical simulations for two tasks: 1) Calculation of the temporal behavior of dif-
ferent physical parameters of active galactic nuclei (AGN) containing a super massive black hole (SMBH), an accretion
disk, and a compact stellar cluster; 2) Calculation of the stellar capture rate to the central SMBH without accretion disk.
The calculations show good perspectives for applications of the similarity method to optimize the evolution model cal-
culations of large stellar systems and of AGN.
Keywords: N-Body Simulations; Numerical Methods
1. Introduction
In the paper [1] a new similarity method (the Aldar-Kose
method) for N-body simulations was proposed. Here we
present numerical examples of the applications of this
method to N-body simulations of AGN evolution, taking
into account the star-disk dissipative interactions, and to
simulations of the star capture rate to the central SMBH in
AGN without accretion disk. The aim of the calculations
is to determine the accuracy of the new method and its
application limits.
Formally, the essence of the A-K method is simple and
can be reduced to the following:
A real stellar system (the “large” one with N1 > 106
stars) is modeled as an ensemble of m = N1/N2 “small”
systems, each containing N2 = N1/m gravitating parti-
cles. The initial conditions for the coordinates and
velocities in the large and in each of the small systems
are obtained from a random number procedure de-
signed to imitate the initial quasi-equilibrium distri-
bution functions of the stars-particles;
The usual direct N-body simulations is provided for
every member of the ensemble of m = N1/N2 small
systems, and then (as is shown in [1]) the resulting
physical characteristics of the large system can be
obtained as those averaged over the ensemble of small
systems;
As shown in the paper [1], the resulting averaged
values are equivalent to a single solution, obtained
with the direct calculation for the large system, if all
the solutions are taken at identical moments of the
evolution time Tev, equally defined in both the large
and the small systems. This means that the physical
characteristics at equal Tev are equal to the mean-
square deviations, defined with the total number of
stars in the large system.
It was shown also that the result is valid for dissipative
systems as well, in particular, for AGN models, where
the dissipative interactions of stars with the accretion
disk are taken into account. In this case, the dissipative
acceleration of a particle in the small systems has to be
multiplied by a similarity scaling coefficient, SC(N1,N2,Tev)
[1].
2. Comparisons of the A-K Method with
Direct N-Body Simulations of the AGN
Dissipative Evolution
With our computer we can perform direct N-body simu-
lations for systems with maximum number of particles
Nmax ~ 32 × 103 = 32 K. But in real AGN, the typical total
number of stars in the surrounding compact stellar clusters
are about N1 ~ 106 - 109, which are ~ (32 - 32 K) times
larger than our Nmax. So, to test the A-K method, we use
the “ladder” approach to the comparison of model simu-
lations with different N2 < N1. The main idea of the ap-
proach is to substitute the comparison of the two systems
with 21
NN with the comparison of a sequence of
systems with N3 < N2 < N1. As deduced in [1], the
inaccuracy of the calculations in the row is increased
(from right to left!) non-linearly with mi = Ni/Ni+1. So, if
the accuracy of calculations of the N2 system, using the
E. VILKOVISKIJ
Copyright © 2012 SciRes. IJAA
120
A-K method with the ensemble of m = N2/N3 subsystems
is acceptable, it (supposedly) will be acceptable for the
representation of any larger systems with N = mN2 =
m2N3… particles and so on, up to N1. This “Aldar-Kose
axiom” needs to be established for any specific task to
find the minimal number of particles N2(min) in the sys-
tems which can safely (with an acceptable precision) be
used in the ensemble of m = N1/N2, representing the larger
N1 system.
The main aims of our model simulations were as fol-
lows:
1) Comparison of the solutions obtained with “usual”
direct N-body simulations for N1 = 32 K and N1 = 16 K to
the solutions for the ensembles of m systems with N2 =
N1/m (the A-K method);
2) Estimation of the dependences of the precision and
time consumption of both methods from different model
parameters.
We compared the following physical parameters of the
models:
a) The growth rates of the central BH mass under dif-
ferent conditions;
b) The distribution functions of the stellar orbits’ in-
clination angles (cos(i)) in two regions, one inside the size
of the accretion disk and the other in the whole stellar
system;
c) The distribution functions of the particle orbits’ ec-
centricities

2
22
1bh
eELmM

 

of the stars (par-
ticles) in the same regions (

22bh
EvmM r is the
energy and L is the angular momentum of a star in the
gravitational field of the BH).
The comparisons were performed for the models with
two different rates of growth of the central SMBH (pure
stellar accretion and “stellar plus gas” accretion rates), to
compare the evolution of the system in the cases. (Both
cases are presented with some “toy” models, acceptable
for the formal testing of two different accretions rate cases
only.)
The following simulations were fulfilled and compared
to each other:
А. The direct N-body simulations for the particle num-
bers N1 = 32 K and 16 K (in the figures below the cases
are labeled as 1 × 32 K and 1 × 16 K).
В. The model simulations using the А-K method for the
same systems as the result of averaging over m = N1/N2
“small” systems with different m values (labeled in the
figures as m × N2).
The results of the calculations are presented in Figures
1-8. As it was shown in [1], one has to compare parame-
ters of the systems in the equivalent moments of evolution,
the “evolution times”
 
0
ev rx
Tt tTt due to vari-
able (diminishing due to accretion and evaporation) par-
ticle numbers. The larger is the evolution time, the bigger
the accuracy gain with this correction.
Figure 1. Evolution of the black hole mass due to the accre-
tion of stars. The dashed (upper) lines represent the case
Trx = const, and solid lines represent the case with the time-
dependent Trx(t) (i.e., the BH mass at the Tev(t) moments).
The green lines are for direct calculation (m = 1). Results of
the A-K method are shown with blue lines for m = 4, and
with red lines for m = 16 representing systems.
Figure 2. Distribution of inclination cosines for inner stars’
orbits in 3 simulations at the moments t = 0 (dashed lines)
and t = 1.5Trx(t) (solid lines). Green lines are for direct 32 K
N-body simulation, and blue and red ones are for the A-K
method with m = 4 and m = 16.
Figure 3. Distribution of inclination cosines for all stars in
three simulations with different numbers m of systems in
A-K ensemble (notations are as in Figure 2).
E. VILKOVISKIJ
Copyright © 2012 SciRes. IJAA
121
Figure 4. Distribution of eccentricities for all stars (notations
are as in Figure 2).
Figure 5. Distribution of eccentricities for inner stars (nota-
tions are as in Figure 2).
Figure 6. Growth of the SMBH mass due to both stellar and
gas accretion, obtained with direct simulations (dashed lines)
and A-K method (smooth lines). Green lines present more
exact dependences on Tev.
In Figures 1-5 the evolution of physical parameters is
presented, supposing that the SMBH mass is growing as
the mass of the stars, crossing some “accretion radius” Rac =
0.01. The foundation of the supposition is the inflow of
stars to the center of the AD due to star-disk interactions
[2]. Though the stellar capture rate to the central BH can
Figure 7. Distribution of inclination cosines for inner stars at
three moments of evolution, Tev = 0 (red), Tev = 1 (green) and
Tev = 2 (blue), calculated with the direct (broken lines) and
the A-K (solid lines) methods.
Figure 8. Distribution of eccentricities for inner stars with
the gas accretion switched on. Notations are as in Figure 7.
be diminished with the process of “melting” of the stars
close to the BH due to the star-disk interactions [2], in the
present paper we permit the arbitrary suppositions about
the stellar and gas accretion rates just for the sake of a
formal testing of the new N-body solution methods with
different growth rates of the central BH. (The more rea-
listic calculations of the Mbh(t) behavior would demand
much more detailed model calculations of the star-disk
interactions, which will be done in following works.)
In Figure 1 the difference of the dashed and solid green
lines is “artificial” (due to different scales of the t/trx axes,
the dashed line for trx = const, and the solid one for trx =
f(t)). But the differences of the lines with different colors
are real, depending on the A-K approximation defined
with m representing “small” systems. One can see that the
deviations of the blue and red lines (the A-K calculations
with different m) from the green lines (the direct calcula-
tions) are slightly smaller for solid lines (the time-de-
pendent relaxation time units). In this case deviations are
the real characteristics of the A-K precision. One can see
that the deviations of the A-K method from the direct
E. VILKOVISKIJ
Copyright © 2012 SciRes. IJAA
122
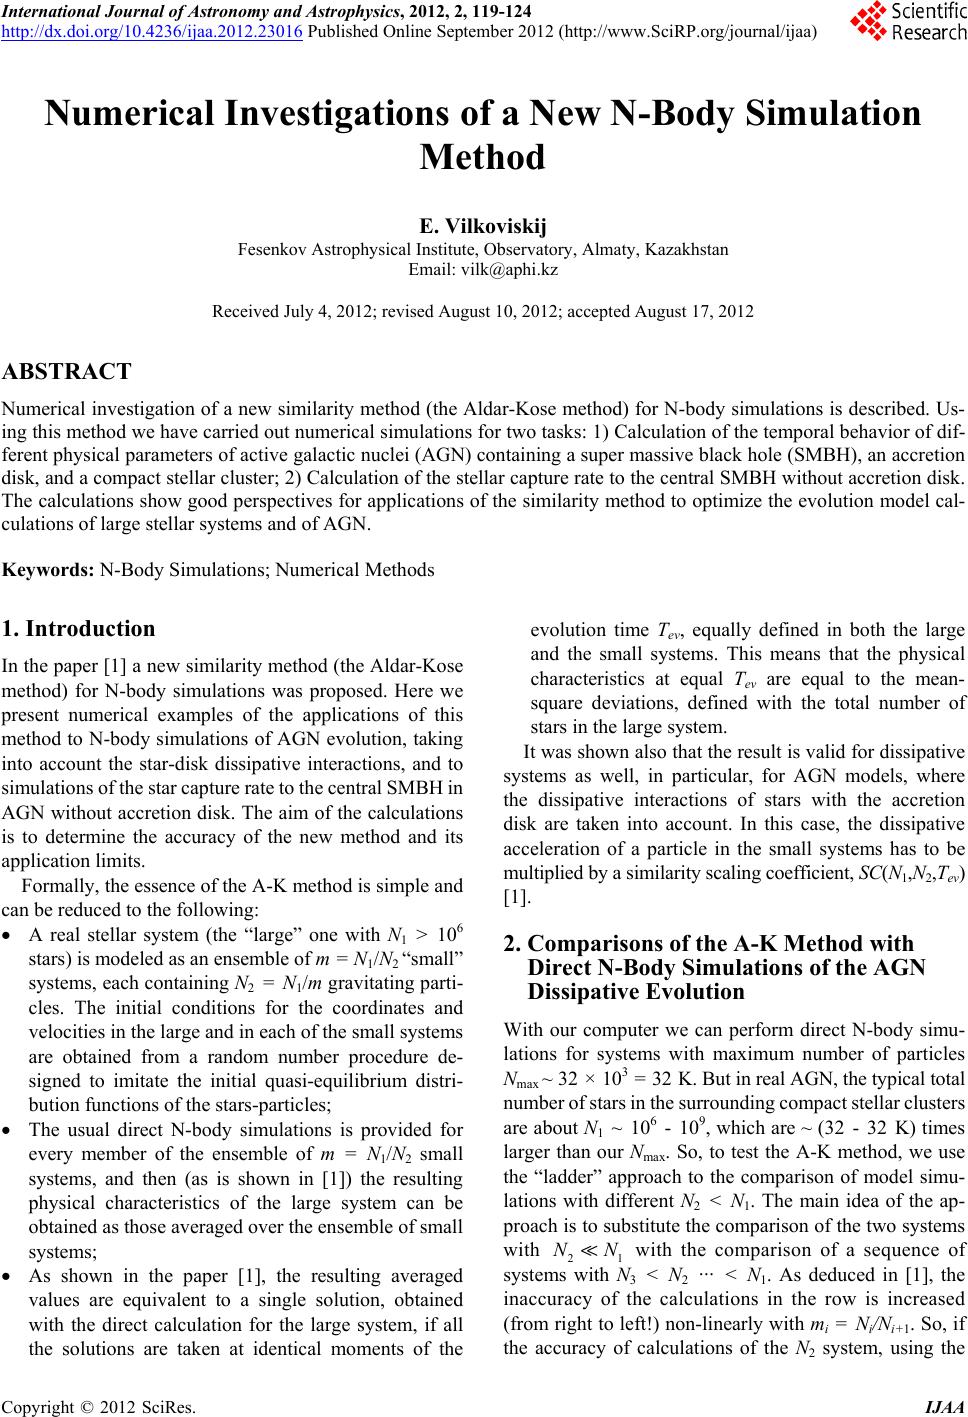
simulation (1 × 32 K, the green lines) are in the both cases
smaller for m = 4 (N2 = 8 K, blue lines) and larger for m =
16 (N2 = 2 K, red lines), where m is the number of the
representing systems in the A-K ensemble. So, N2 = 8 K
can be taken as the minimal number of particles in the
small systems to represent the N1 = 32 K large system,
and (admittedly) to represent any N > N1 system with
m=N/N2 subsystems having each N2 particles. We also
find out that both the inaccuracy and the duration of the
A-K simulations are strongly increased with N < Nmin = 2
K (that is m > 16).
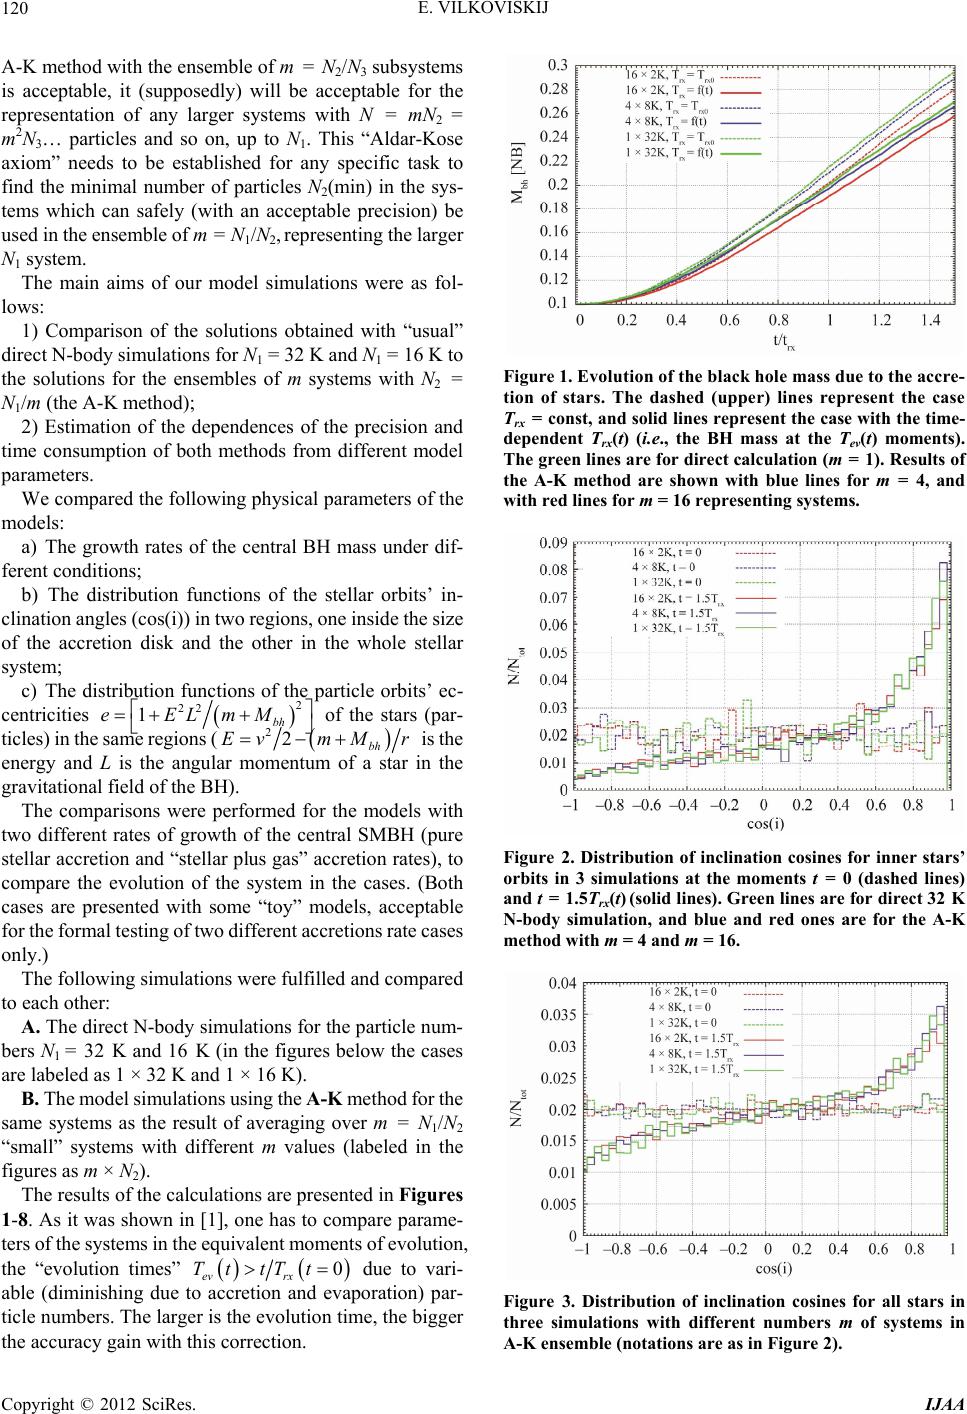
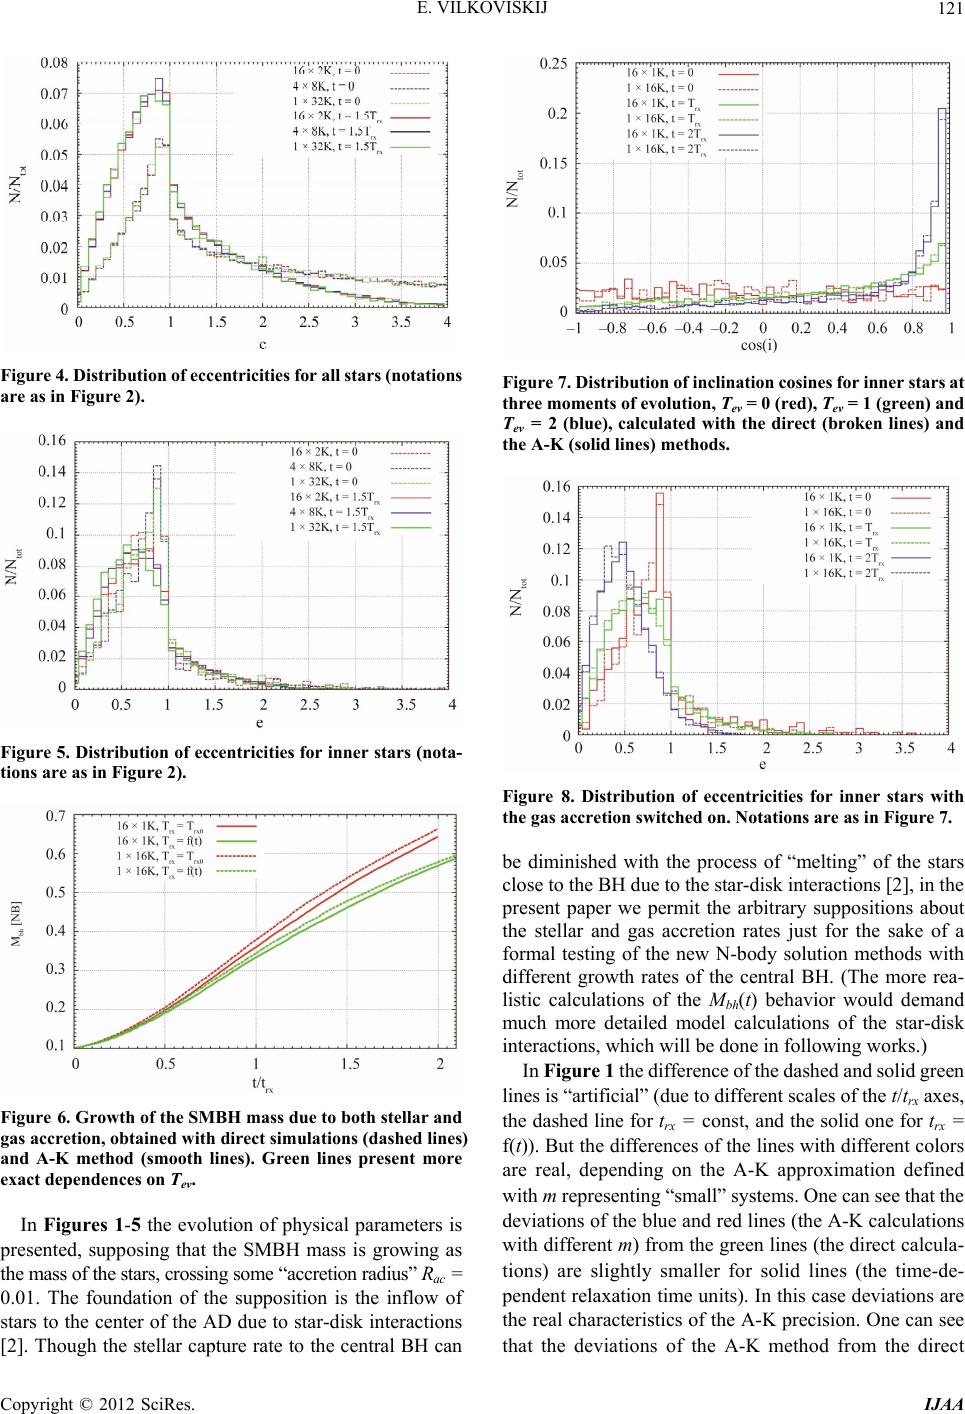
The calculated distributions of cosines of the orbital
inclination angle’s to the accretion disc plane, and the
distributions of particle’s eccentricities both for the inner
orbits (in the region of size equal to the accretion disk size)
and for the whole system are shown in Figures 2-5.
To check the A-K method in more details, we varied the
mass accretion rate. For the case presented in Figures 1-5,
we supposed that all growth of the SMBH mass is due to
stellar captures only (the absence of the gas inflow from
the gas disc to the black hole is an artificial admission,
acceptable for the formal testing of our tasks only). Below
we show results of investigations of another case: The
SMBH mass is increased with both the accreted gas and
captured stars (which supposedly are the stars crossing the
sphere with radius R = 0.01). In that case the gas supply
during one relaxation time was supposed to gain mass ΔM =
Mbh0, where Mbh0 is the initial mass of the black hole (Mbh0 =
0.1 NBU in our model). The results of the calculations are
shown in Figures 6-8.
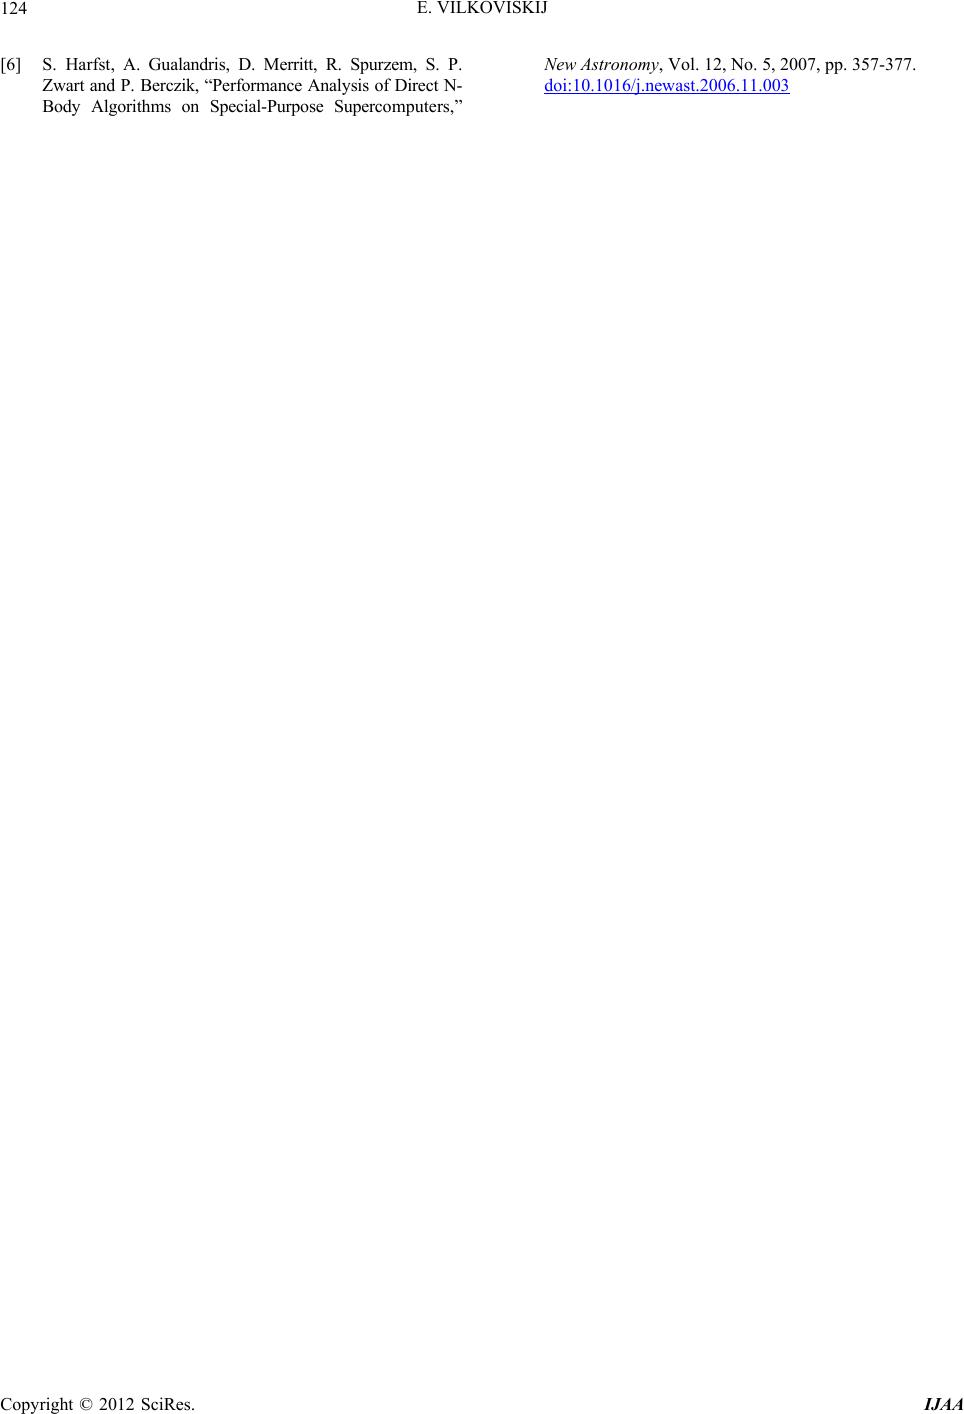
One can see from Figures 7 and 8 that in this case (in-
creased mass inflow to the SMBH) the stellar orbits tend
to be more circular in the inner region of the system, and
eccentricities are diminished due to the increased BH
mass. The A-K results are presented with solid lines, and
direct calculations with dashed lines; both go close to
each other.
3. Application of the A-K Method to N-Body
Simulations of AGN without Accretion
Disk
Another interesting task is calculations of the star capture
rates to the central SMBH without accretion disk in the
stellar systems with zero rotational moment. This drasti-
cally diminishes the accretion rate of the stars. The reason
is that the disruption radii (DR) of stars by the central
SMBH are small and the “loss cone” (the region of the
orbits inside the DR) has to be filled by the stars’ moment
diffusion [3]. We adopt DR = 8.0e–07 from [4] to calcu-
late the stellar capture rate using the A-K method. The
total number of stars in the system was taken N1 = 105 and
the central BH mass MBH = 0.01 (as in the [4]), but in our
case the initial structure of the stellar system is defined
with the Plummer distribution.
As the direct N-body simulation of N = 105 particles
would take too much time with our computer, we per-
formed the simulations using the A-K method only, that is
the simulations of evolution of the ensemble of m = 50
“small” stellar systems with the central BH (each con-
taining N2 = N1/m = 2 K stars-particles), representing the
evolution of the “large” systems with N1 = 100 K equal-
mass stars, surrounding the SMBH with MBH = 0.01 (one
percent of the stellar system’s mass in NBU, as was
supposed in [4]). We choose the “capture radius” of stars
to the central BH rcap = DR = 8e–7 to compare our result
to that of [4]. The results of calculations are shown in
Figures 9 and 10.
As seen from Figure 9, each individual run with N = 2
K particles yields a few accretion events, presented with
vertical “jumps” at the ladder-like thin lines. In every
capture event, the BH mass increases by m = N1/N2 = 50
stars, equal to 5 × 10⁻² of the initial BH mass, which gives
the jumps. We had 15 colors only to draw the 50 “ladder-
tracks”, so the resulting picture is a very tangled one. But
averaging over 50 such runs (the A-K method) produces a
rather smooth curve (shown with the red thick line) with
small enough fluctuations, since it is equal to one run with
100 K particles, in accordance with the A-K paradigm.
In the Figure 9, each ladder-like track represents an
evolution of the BH mass in each of the “small” subsys-
tem of the ensemble. The deviations from the average
thick red line characterize the mean-square deviations of
the individual evolution tracks of the small systems. One
can see that in spite of the large deviations in the behavior
of the “small” subsystems of the A-K ensemble, the ave-
raged curve remains smooth enough.
We remind that in the Figures 9 and 10 the time scale is
presented in units of the “evolution time”, Tev = t/trx,
equally defined for the systems with any different num-
bers of particles (see [1]), which permits to plot and com-
pare them at the same pictures, where the essence of A-K
approach is quite visible.
Figure 10 shows how the fluctuations vary with dif-
ferent numbers of runs m, taken for averaging, which
permits comparison of the “full” (complete) A-K simula-
tion (red line) with the “truncated” A-K simulations, ave-
raged correspondently over 30 (green line), 10 (blue) and
5 (agenda) representing subsystems. The average slope of
the lines (well visible in the red and green lines) looks
evidently increased at the moment of evolution time close
to one relaxation time, possibly as a result of a cusp for-
mation in the stellar system. Note, that all the “evolution
tracks” are close enough at the moments of the evolution
time Tev = t/trx ~ 1.5 - 2, which points to possible applica-
tion of the “truncated” A-K method for the snap-shot
estimations of the large stellar system evolution rate.
From this result, we have calculated the star capture
rates CR per N-body time unit (one crossing time, as was
E. VILKOVISKIJ
Copyright © 2012 SciRes. IJAA
123
Figure 9. The evolution track of the black hole mass (red
thick line) averaged over 50 runs (which is equal to the result
of N1 = 100 K particles evolution), as compared to the evo-
lution tracks of each of the small systems of the ensemble
with N2 = 2 K particles in each (the thin ladder-like lines of
different colors).
Figure 10. The evolution of the black hole mass, averaged
over different numbers of runs m (each run with N2 = 2 K).
done in [4]). We obtain CR~1.5 stars/tcr in the time in-
terval T < 1 Tev and CR~6 stars/tcr at T > 1 Tev. The first
result is close enough to the result obtained in [4] with the
direct N-body simulations for the same particle number (N =
105) and time interval smaller than T < Tev.
For our full A-K variant (m = 50) we spent t~83 hours
with the GPU computer (using 2 Tesla cards and CPU 2.5
GHz), and for the “truncated” (m = 5) case we spent t~8.3
hours only. The direct N-body simulations of N = 105
particles with our computer would demand calculation
time t > 1 year.
4. Conclusions
To estimate possible applications of the new similarity
method (the A-K method), suggested in [1], we have
performed simulations of two physically different model
tasks:
1) We use the A-K method to compare the direct simu-
lations of the N1 = 32 K and N1 = 16 K (labeled in the
Figures 1-8 as 1 × 32 and 1 × 16) to the calculations with
the A-K method, using different numbers m of small
systems in the ensembles (m = 2, 4) (labeled in Figures as
2 × 16, 4 × 8 and 2 × 8, 4 × 4). We show that the calcula-
tion error increases with increasing m, and conclude that
particle numbers around N2 4 K in the A-K modeled
“small” systems (representing any larger N1 systems) are
enough to calculate the real evolution of AGN containing
the compact stellar clusters with N1 30 K stars and with
the masses of the accretion disks Md 0.01 M1. To obtain
more realistic lower limit of N2 and upper limits of N1, the
direct calculations of the models with larger N1 have to be
fulfilled;
2) We use the A-K method to calculate the star capture
rates by the central SMBH for the case where there is no
accretion disk in the stellar system with zero rotational
moment. The A-K method in this case seems to give re-
sults close to those obtained with the direct simulations [4].
The scaling problem of the task (see [5]) needs addition
investigations.
All simulations were performed with the phiGRAPE +
GPU code [6].
Our main preliminary conclusions about possibilities of
the A-K method are quite optimistic, though the method
certainly needs further investigations and testing with
more advanced computers. The preliminary results of our
investigation promise good prospects of the A-K method
applications to the calculation of various evolution sce-
narios of AGNs with compact stellar clusters and to other
evolution models of large stellar systems.
We hope that the A-K method will open new ways to
more detailed physical models of stellar systems and
AGN evolution due to economy of time for the pure stel-
lar-dynamical calculation.
REFERENCES
[1] E. Vilkoviskij, “On the New Method of N-Body Simula-
tions,” IJAA, 2012, in Press.
[2] E. Vilkoviskij and B. Czerny, “The Role of the Central
Stellar Cluster in AGN,” Astronomy and Astrophysics,
Vol. 387, No. 3, 2002, pp. 804-819.
doi:10.1051/0004-6361:20020255
[3] J. Frank and M. Rees, “Effects of Massive Central Black
Holes on Dense Stellar Systems,” Monthly Notices of the
Royal Astronomical Society, Vol. 176, 1976, pp. 633-647.
[4] M. Brockamp, H. Baumgardt and P. Kroupa, “Tidal Dis-
ruption Rate of Stars by Supermassive Black Holes Ob-
tained by Direct N-Body Simulations,” arXiv: 1108.2270v1,
2011.
[5] S. Aarseth and D. Heggie, “Basic N-Body Modelling of
the Evolution of Globular Clusters. I. Time Scaling,”
arXiv: astro-ph /9805344V1, 1998.
E. VILKOVISKIJ
Copyright © 2012 SciRes. IJAA
124
[6] S. Harfst, A. Gualandris, D. Merritt, R. Spurzem, S. P.
Zwart and P. Berczik, “Performance Analysis of Direct N-
Body Algorithms on Special-Purpose Supercomputers,”
New Astronomy, Vol. 12, No. 5, 2007, pp. 357-377.
doi:10.1016/j.newast.2006.11.003