 Journal of Minerals & Materials Characterization & Engineering, Vol. 11, No.2 pp.117-131, 2012 jmmce.org Printed in the USA. All rights reserved 117 The Effect of Time, Percen t of Copper and Nickel on Naturally Aged Al-Cu- Ni Cast Alloys Mohammad M. Hamasha1*, Ahmad T. Mayyas2, Adel M. Hassan3, Mohammed T. Hayajneh3 1 Center for Autonomous Solar Power, State University of New York at Binghamton, Binghamton, NY 13850, USA 2 Clemson University International Center for Automotive Research (CU-ICAR), 4 Research Drive, Greenville, SC 29607, USA 3 Industrial Engineering Department, Jordan University of Science and Technology, P.O. Box 3030, Irbid 22110 Jordan ∗ Corresponding Author: mhamash1@binghamton.edu ABSTRACT In this paper, the hardness property during natural age hardening phenomenon for aluminum based alloy has been studied. Different factors play role in aging hardening of aluminum. In this study, the chosen factors were percentages of copper and nickel in aluminum alloys. The specimens were manufactured using casting process, and then heat treatment was carried out for all produced samples together at 550 °C for 3 h before quenching in water. Finally, the specimens were left at room temperature for 936 hours (39days) to allow solute atoms to defuse and form coherent phases to allow the age hardening to take place. The results show that the hardness increased with time in the first 300 hour after the quenching time, and then it remained constant for the rest of the 936 hours. Furthermore, the hardness did not drop until the end of 936 hours which means the over-aging status was not achieved. To get full analysis of the  118 M.M. Hamasha, A.T. Mayyas, A.M. Hassa n, M.T. Hayajneh, Vol.11, No.2 natural aging, design of experiment technique was used to study the effect of %Cu, %Ni and aging time Keywords: Al; Powder Metallurgy; solution treatment; Natural Precipitation hardening. 1. INTRODUCTION Age hardening (also known as precipitation hardening) is a process by which steel and aluminum based alloys are heated and solution treated. The aim of this process is to improve the strength and hardness of these alloys [1]. Age hardening treatment procedure consists of three major steps: solution treatment, rapid cooling (quenching), and aging. Solution treatment involves keeping the alloy on temperature higher than solvus temperature but less than liquidus temperature for a period of time to get homogeneous one phase of the solid solution, where the solute atoms are dissolved completely in the solution. Rapid cooling or quenching of the solid solution is carried out in a medium like water, oil or even air. During this step, the solute atoms are not allowed to move and form α-phase, so they stay dissolved in a supersaturated phase. Finally, during the aging stage, the alloy hardness starts to increase when the solute atoms start to diffuse as clusters that distort and strengthen the material. The age hardening process differs widely in composit ion and in the microstructures formed. Age hardening is often used in aluminum based alloys to improve the physical properties, such as strength and hardness [1]. The changing in allo y physical properties is due to formation of fine- dispersed second phase particles in the lattice. These particles strain the lattice internally and restrict the dislocation movement. Then the alloy has to be kept at room temperature or reh eated to a temperature below the solvus line and held on that temperature for enough time to ensure full transformation. This temperature is known as the age hardening temperature. The purpose of reheating the alloy is to increase the diffusion rate of the solute atoms by increasing the internal energy of the atoms and then reducing the time needed to age the alloy.  Vol.11, No.2 The Effect of Time, Percent of Copper and Nickel 1 19 Heat-treated aluminum based alloys are widely used for high performance light weight parts, such as aircraft and space shuttle parts. There are several groups of aluminum based alloys that can be aged,the 2xxx alloys group is one of the heat treatable aluminum based alloys in which the princaple alloying element is copper [2]. Magnesium and/or small amounts of other elements could also be added to enhance the strength. In this alloy, Al2CuMg is the main hardening precipitate [2]. A normal use of the 2xxx allo ys, such as alloy 2024, is for aircraft structures. The 6xxx group of allo ys contains magnesium and silicon as primary alloying elements [2]. Mg2Si is the hardening precipitate for these alloy [2]. Alloy 6061 is one of the common examples about this group; this alloy is ver y popular in the structural and construction application. The princapal alloying elements for the 7xxx group are zinc, magnesium and copper. The intermetallic compound, that serves as a hardening precipitate is MgZn 2 [2-4]. Si nce Zinc and magnesium are very soluble, a high density precipitates could be achieved and then produce extremely stronger and hard er al loys. These al l o ys su ch as alloy 7075 are gen eral ly used fo r aircra ft s tru ctu r es [2-4]. Silicon improves the fluidity of the molten metal while copper and magnesium increase strength [2]. However, the copper is primary alloying element in 2xxx alloys which mainly increases the hardness [4-5].Furthermore, addition of copper in association with nickel improves the strength and hardness stability at high temperature [6].The tensile strength of aluminum alloys varies from one alloy to the other, for example, 2024 has a tensile strength of about 64 ksi, while 6061 has a tensile strength of about 42 ksi, however, 7075 has higher tensile strength that reaches 73 ksi [2]. When the alloy is selected in the design stage, the mechanical parameters, such as alloy strength, castability, machinability, as well as prices of materials are important factors to be considered. Solution treatment plus aging for the 2618 aluminum alloy (Si: 0.10-0.25, Fe: 0.9-1.3, Cu: 1.9- 2.7, Mg: 1.3-1.8, Ni: 0.9-1.2, Zn: 0.10) wt%, produces a machineable material to a fine detail [7]. When using magnesium and copper as primary allo ying elements for aluminum based alloys, age hardening is associated with the precipitation of Guinnier-Preston (Cu, Mg) zones and the semi- coherent S phase, which is closely related to the equilibrium S-phase (Al2CuMg) [7].  120 M.M. Hamasha, A.T. Mayyas, A.M. Hassa n, M.T. Hayajneh, Vol.11, No.2 The age h ardening p rocesses in Cu–Mg alloys which falls within the (α+S) region in the ternary phase diagram have been subjected to numerous investigations due to their fundamental concept and commercial interest since the development of the alloy duralumin in 1906. Since then, they have been investigated by different mechanical testing, calorimetric measurements and microscopy anal ysis. Two hardness rise stages are noticed during aging at normal temperatures, which are the rapid initial rise (about 50–70% of the total hardness increase), and the second rise, which is slower than the first one. In semi-logarithmic representation, they are separated by a sort of plateau whose duration depends strongly on temperature and alloy composition. In normal scale, a plateau does not always appear [8]. In the literature many researchers have studied the aging of aluminum alloys. For example, Ou [9] studied the influence of pre-aging at low temperature on the thermal age hardening for aluminum alloy 6063 (Al–0.72 Mg–0.42Si). He found that any increase in pre-aging temperature and/or holding period time will significantly decrease the strength of the alloys during and after thermal aging. Age hardening can change the dimensions of the material due to internal stresses, alloy concentrations, and the aging process. It is hard to predict these dimensional changes because of the number of the intervening factors. Oneda et al [10] examined the effect of pre-aging on the artificial age hardening of 1.32wt% Mg 2Si alumi num based alloy at 170 °C. They found that the change in hardness was strongly dependents on the pre-aging temperature. Özbek [11] studied the effects of re-solving treatment of AA2618 aluminum based alloy, at solution heat treatment temperature between 520–640 °C and holding time of 14–24 h, followed by artificial aging. He found that further solution treatment temperature leads to increase both the grain and the precipitate size, and then reduces the hardness significantly. Al 9FeNi-type intermetallics are not completely dissolved by these solution treatments. Desmukh et al [12] studied aluminum 7010 alloy (Zn 6.3, Mg 2.3, Cu 1.55, Zr 0.14) fati gue life, the fatigue life was corresponding to 106 cycles and the results revealed that the over aged alloy has a fairly high valu e of fati gue stren gth as com pared to th e peak a ged all oy. Thes e resul ts were discussed with the aid of microscope images to show th e di fferen ces bet w e en t he m i cros tru ctu res  Vol.11, No.2 The Effect of Time, Percent of Copper and Nickel 1 21 developed in the materials that subjected to different aging treatments. Zeren [13] studied the effect of heat-treatment on aluminum piston alloys, AlCu4MgNi alloys and AlSiCuMgNi alloys with 10.5%, 12%, 18% and 24% Si are widely using in automotive industry for this purpose. It was found that the mechanical properties of aluminum based piston alloys are highly dependent on the h eat t reat men t t em p eratu r e and tre at i ng ti m e. Thu s, char act e ris t ics of h eat t re atment play a significant role for excellent microstructure and mechanical properties. Ouellet et al [14] studied the aging phenomenon of 356 and 319 aluminum alloys. They found that the main parameters that control the mechanical properties are the iron and copper intermetallics, the eutectic silicon particle characteristics, the porosity size and distribution, and the supersaturation level of Mg and Cu in the α-Al matrix after solution heat treatment. Gonzalez-Martınez et al [15] studied the age hardening of magnesium wrought alloys (magnesium- aluminum zinc series) by damping measurements and hardness. They found that the age hardening temperature significantly accelerates the damping and the hardening of the specim ens. 2. DESIGN OF EXPERIMENTS The Experiment was designed totally using of design of experiment (DOE) with an assistance of MINITAB software. The selected study factors were: aging time, %Cu and % Ni with eleven levels for aging time factor and 4 levels for each of %Cu and %Ni. Table 1 shows the considered factors an d level s in thi s stud y. The hardness in ter m of Rockwel l scal e B (HRB) w as measu red at different combination of study factors. After selecting factors and their levels, the experimental were conducted based on a random sequence to ensure reproducibility of the apparatus and maintain high level of accuracy. Two replicates were measured for each factors combi nation, so the total number of requir ed test specimens was 352. In order to reduce the measurement error, the hardness measurement was taken five times at five different locations along the specimen for each sample, and then the averages of these five measurements were considered for further analysis. Actual hardness measurement would be represented by equation (1) according to design of experiment model.  122 M.M. Hamasha, A.T. Mayyas, A.M. Hassa n, M.T. Hayajneh, Vol.11, No.2 Table 1: Factors and levels Factor 1 2 3 4 5 6 7 8 9 10 11 Where is the actual measure of hardness, is the overall mean, is the effect of the ith level of time, is the effect of the jth level of copper percentage, is the effect of the kth level of nickel percentage, is the effect of interaction between the time and copper percentage, is th e effect o f in ter acti on bet ween t h e t im e and ni ckel percen tag e, is the effect of interaction between the copper percentage and nickel percentage, is the effect of interaction between the time, copper percentage and nickel percentage, and is randomized error. Analysis of variance (ANOVA) was used to test if the factors and the interactions affect the hardness significantly or not. Main effect plots for all factors were used to show the trend (decreasing or increasing and concavity) of the relation curve between the factors and response (hardness values), and tw o factor interaction plots were used to check if the int eractions between the factors significantly affect the response. However, ANOVA is very sensitive to normality in the distribution of errors, to make sure that normality assumption is valid; the normality validation was conducted before any further anal ysis. Furthermore, to avoid any trend that arises  Vol.11, No.2 The Effect of Time, Percent of Copper and Nickel 1 23 in the sequence of experimental runs, validation for randomization in the experimental run was done as well. 3. MATERIAL AND METHODS The specimens were produced using casting technique. The aluminum ingot blocks were melted at temperature of 750 °C in graphite crucibles. Copper and nickel were then added to the molten metal and agitated vigorously to ensure good distribution of copper and nickel. The melt poured into the dried cylindrical permanent metallic molds (30 mm in diameter and 175 mm height) as shown in Figure 1. Then the mold was left in air to cool down to room temperature. The next step was heat treatment of the samples which was carried out at 550 ±5 °C in an electric arc furnace for 3 h to turn the material into one homogenous solid solution phase. The specimens were then quenched in water at room temperature immediately after being taken out of the furnace. Surface polishing takes place to remove the oxide layer and get smoother surfaces. Then the hardness change due to natural age hardening was measured continuously for 936 h (39 days) starting from the time of quenching. The hardness was measured using Rockwell hardness test scale B (1/16-inch hardened steel ball with minor load 10 kgf and major load 90 kgf). In order to reduce the reading errors and get more representative hardness value, the hardness readings were t aken at five differ ent lo cati on s on the surface for each sp ecim en. Figure 1: Permanent mold which contains two splits. a) Opened, b) Closed.  124 M.M. Hamasha, A.T. Mayyas, A.M. Hassa n, M.T. Hayajneh, Vol.11, No.2 4. RESULTS AND DISCUSSION Figure 2 shows the aging curves that represent the relationship between natural age hardness and the aging time for all %Cu - %Ni combinations. It is clearly shown that the difference in the initial hardness between the specimens depending on the copper and nickel percentages. The higher copper and/or nickel percentage the higher hardness value is, and vice versa. The replacement of aluminum atoms with other alloying atoms leads to deform the lattice, so at a higher alloying percentage, the lattice gets more deformation with more solute atoms and hence the hardness gets high. These deformations inhibit the movement of the dislocations. Rockwell hardness number (HRB) increases rapidly for all samples over about 300 hours, and then it keeps constant until the end of the 936 hours. HRB increasing at the early stage is due to the diffusion of the solute atoms as coherent phases in different areas within the lattice of the aluminum based alloys. Figure 2: Effect of copper and nickel percentage on the natural precipitation hardness over 936 h The percentages of copper and nickel not only influence the initial hardness, but also influence the range of hardness increase over the time, where the high percentage of alloying element has high impact on the hardness incremental range and vice versa. For example, the maximum  Vol.11, No.2 The Effect of Time, Percent of Copper and Nickel 1 25 increasing range was for the combination of 4 % copper and 2 % nickel with 35.5 HRB and the minimum increasing range was for the combination of 1 % copper and 0 % nickel with 3.5 HRB. This is partially due to the increased amount of precipitated coherent phase inside the lattice. No over-aging status had been noticed in this study. However, it seems that the time of 936 hours was too short for the considered alloys to allow the complete separation of the coherent phases, which cause the phenomenon of over- aging to occur. Design of experiment (DOE) tool was used in this study to analyze data and draw the conclusions. The normal distribution of the randomized error is the right distribution for validating the DOE model. So the proof of normality in the error distribution was made before start analyzing the data. Figure 3 shows the normal probability plot. The linearity of the relation refers to the normality of the standardized error. As shown in this figure, almost all points are clust ered strai ght alon g the lin e ex cept ver y few poin ts at ends of the l inear line. Hence, it can b e concluded that the standardized error is very close to normal distribution and the model is statistically valid for further analysis. In order to avoid any unintentional trend in the run order, the observation order versus residual was plotted as shown in figure 4; however, the standardized residual points are distributed around the zero and there is no sign of non randomized patterns within the distribution. 5.02.50.0-2.5-5.0 99.9 99 95 90 80 70 60 50 40 30 20 10 5 1 0.1 Residual Percent Normal Probability Plot (response is Hardness) Figure 3: Normal probability plot for the standardized residuals.  126 M.M. Hamasha, A.T. Mayyas, A.M. Hassa n, M.T. Hayajneh, Vol.11, No.2 Figure 4: Standardized residuals versus experimental run order. After validating the normality of the randomized error distribution and randomization of the experimental run, the significance of the factors and their interactions on the response was conducted using analysis of variance (ANOVA). ANOVA is basically a collection of statistical procedures, in which the variance is divided into many components depending on the cause of variation. Two statistical hypotheses, as seen in equation 3, were developed in the ANOVA model. If the means are equal, null hypothesis is failed to be rejected and hence the term is not significant. If at least two means are different, null hypothesis is rejected and instead alternative hypothesis is accepted and then the term is significant. The statistical test that used in ANOVA is F-test whe re F0 is calculat ed and com par ed to st and ard F-critical, and then the conclusion can be drawn based on that. A detailed description of F test is in Montgomery et al [16]. (3) Also the comparison between P-value and confidence level α (usually 0.05) can draw similar conclusion whether to accept or reject the null hypothesis. If P-value is less than 0.05, then the null hypothesis has to be rejected and the term is significant, otherwise the term is not significant. In the last column of the ANOVA table, P-value for each factor and interaction is listed. 350300250200150100501 5.0 2.5 0.0 -2.5 -5.0 Observation Order Residual Versus Order (response is Hardness) 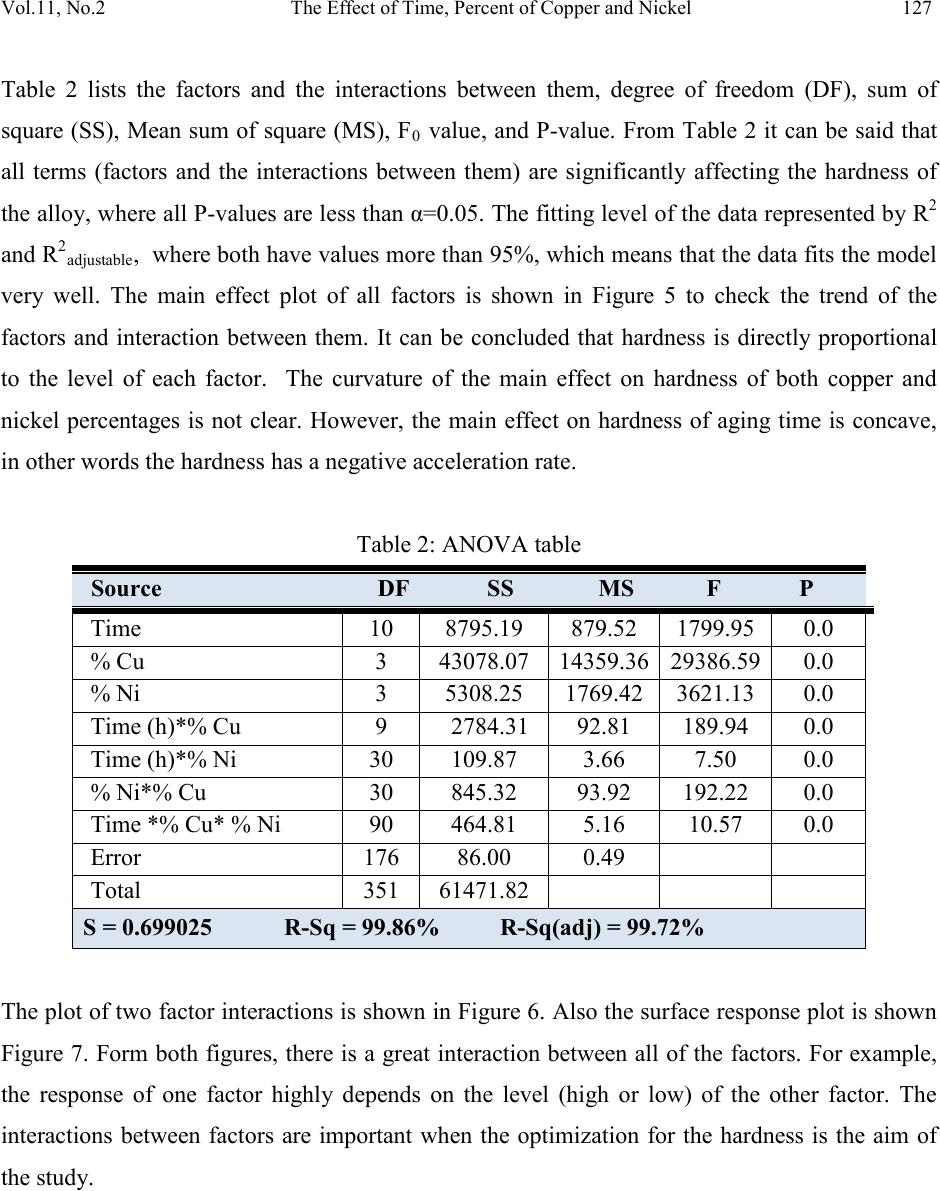 Vol.11, No.2 The Effect of Time, Percent of Copper and Nickel 1 27 Table 2 lists the factors and the interactions between them, degree of freedom (DF), sum of square (SS), Mean sum of square (MS), F 0 value, and P-value. From Table 2 it can be said that all terms (factors and the interactions between them) are significantly affecting the hardness of the alloy, where all P-values are less than α=0.05. The fitting level of the data represented by R2 and R2adjus tab le, where both have values more than 95%, which means that the data fits the model very well. The main effect plot of all factors is shown in Figure 5 to check the trend of the factors and interaction between them. It can be concluded that hardness is directly proportional to the level of each factor. The curvature of the main effect on hardness of both copper and nickel percentages is not clear. However, the main effect on hardness of aging time is concave, in other words the hardness has a negative acceleration rate. Table 2: ANOVA table S = 0.699025 R-Sq = 99.86% R-Sq(adj) = 99.72% The plot of two factor interactions is shown in Figure 6. Also the surface response plot is shown Figure 7. Form both figures, there is a great interaction between all of the factors. For example, the response of one factor highly depends on the level (high or low) of the other factor. The interactions between factors are important when the optimization for the hardness is the aim of the study.  128 M.M. Hamasha, A.T. Mayyas, A.M. Hassa n, M.T. Hayajneh, Vol.11, No.2 Figure 5: Main effect plot Figure 6: Interaction plot 936600432264192120967248240 60 50 40 30 4321 2.01.51.00.0 60 50 40 30 Time (h) Mean %Cu %Ni Main Effects Plot for Hardness Data Means 4321 2.01.51.00.0 60 45 30 60 45 30 Time (h) %Cu %Ni 600 936 0 24 48 72 96 120 192 264 432 Time (h) 1 2 3 4 %Cu Interaction Plot for Hardness Data Means  Vol.11, No.2 The Effect of Time, Percent of Copper and Nickel 1 29 Figure 7: Surface plots of the significant interactions of a) % Cu – time, b) %Cu - %Ni, and c) % Ni –time. 5. CONCLUSIONS The hardness increased for all %Cu - %Ni combinations sharply starting from the beginning of the aging time, but it was slowing down with the time until about 300 hours where it kept approximately constant till the end of aging time (936 hours). This indicates that the solute atoms start to diffuse in a short time producing severe lattice distortion in different areas to form the coherent phase, causing an increase in hardness of the studied alloys. The hardness was higher for a higher copper and nickel percentages at the initial time. The reason behind that is due to higher precipitated coherent and then higher internal strain at higher alloying element percentage. Also the hardness increasing was more at higher copper and nickel percent ages. Th is is due to higher amount of alloying atoms available for diffusing to form more coherent phases 750 20 500 40 60 1250 80 20 34 Hardness Time (h) %Cu Surface Plot of Hardness vs Time (h), %Cu 2 20 1 40 60 1 80 20 34 Hardness %Ni %Cu Surface Plot of Hardness vs %Ni, %Cu 2 20 1 40 60 0 80 250 500 0 750 Hardness %Ni Time (h) Surface Plot of Hardness vs %Ni, Time (h) c) a) b)  130 M.M. Hamasha, A.T. Mayyas, A.M. Hassa n, M.T. Hayajneh, Vol.11, No.2 and add more internal strain to the lattice. Over-aging was not observed in this study regardless of the used composition of the different alloying elements. It seems that the time was not long enough to separate the non-coherent phases and remove the internal strain from the lattice. REFERENCES 1. A.M. Hassan, O.M. Bataineh, K.M. Abed. The effect of time and temperature on the precipitation behavior and hardness of Al–4 wt%Cu alloy using design of experiments. Journal of Materials Processing Technology 204 (2008): 343–349. 2. ASM metals hand book, Properties and Selection: Nonferrous Alloys and Special-Purpose Materials 2 (1990): 169-487. 3. ASM metals handbook, Properties and Selections: Nonferrous Allo ys and Pure Metals, 10th Ed. 2 (1979): 2-81. 4. W. Smith, J. Hashemi. Foundations of material science and engineering, Fourth Ed., McGraw-Hill International, New York, USA, 2006. 5. H.D. Chapra, B.C. Muddle, I.J. Polmear. The structure of primary strengthening precipitates in an Al-1.5wt% Cu-4.0wt% Mg- 0.5wt% Ag alloy. Philosophical Magazine Letters 73 (1996): 351- 357. 6. R.D. Askeland, P.P . Phulé. Material s science and engin eering. Fourt h Ed., Nels on, Toronto, Canada, 2003 7. W.S. Miller, L. Zhuang, J. Bottema, A. J. Wittebrood, P. D. Smet, A. Haszler, A. V i e r egge . Recent developments in aluminum alloys for the automotive industr y. Materials Scien ce and Engineering 280 (2000): 37–49. 8. S. Szczepanik, T. Sleboda. The influence of hot deformation and heat treatment on the properties of P/M Al-Cu composites. Jo urn al o f Materi als Processing Techn olog y 60 (1996): 729-733. 9. B.L. Ou, C. Shen. Effect of preaging on precipitation behavior in Aluminum alloy 6063 during high-temperat ur e agin g. Scandinavian Journal of Metallurgy 2004 (33): 105–112. 10. N. Oneda, M. Shimura, Y. Takeuchi. The effect of preaging on the artificial precipitation- hardening of an Al-1.32wt% Mg2Si alloy. Journal of Li g h t Metals 19 (1969): 41.  Vol.11, No.2 The Effect of Time, Percent of Copper and Nickel 1 31 11. I. Özbek, A study on the re-solution heat treatment of AA 2618 aluminum alloy. Mater Character 58 (2007): 312–317. 12. M.N. Desmukh, R. K. Pandey, A. K. Mukhopadhyay. Effect of aging treatments on the kinetics of fatigue crack growth in 7010 aluminum alloy. Mater ials S cien ce and En ginee ring (2006): 318–326. 13. M. Zeren. The effect of heat-treatment on aluminum-based piston alloys. Materials and Des i gn 28 (2007): 2511-2517. 14. P. Ouellet, F. H. Samuel. Investigation stud y of 356 and 319 Al alloys. Journal of Materials Science 34 (1999): 4671–4697. 15. R. González-Martínez, J. Göken, D. Letzig, K. Steinhoff, K. U. Kainer. Influence of aging on damping of the magnesium-aluminum-zinc Series. Journal of Alloys and Compounds 437 (1-2) (2007): 127-132. 16. D.C. Montgomery, G. C. Runger, N. F. Hubele. Engineering Statistics, 4th Ed. John Wiley & Sons, Inc., New York, 2006
|