Open Journal of Applied Sciences, 2012, 2, 61-65
doi:10.4236/ojapps.2012.22007 Published Online June 2012 (http://www.SciRP.org/journal/ojapps)
Using AC Conductivity Measurements to Study the
Influence of Mechanical Stress on the Strength of
Geomaterials
Ilias Stavrakas1, Kostantinos Moutzouris1, Kostantinos Ninos1, Nikos Mitritsakis2,
Zacharias Agioutantis2, Dimos Triantis1
1Department of Electronics, Technological Educational Institute of Athens, Athens, Greece
2Department of Mineral Resources Engineering, Technical University of Crete, Chania, Greece
Email: ilias@ee.teiath.gr
Received March 6, 2012; revised April 10, 2012; accepted April 20, 2012
ABSTRACT
The Dielectric Spectroscopy technique is a tool that can be used to provide information regarding the physical and
chemical properties of materials. In this work Dielectric Spectroscopy (DS) measurements were conducted on marble
specimens that were previously subjected to uniaxial compressive stress up to fracture in order to investigate the influ-
ence of the mechanical stress on the dielectric properties of the specimens. Specifically, the ac conductivity (σac) was
measured when an ac electric field in the frequency range 1 kHz - 1 MHz was applied upon dry and saturated specimens
which were subjected successively to higher levels of mechanical stress. The experimental results indicate that there are
systematic variations in the values of the ac conductivity after each stress application at a higher stress level. Such
variations become more intense at higher stress values and can be used to indicate the upcoming fracture since signifi-
cant increase of conductivity is recorded when microcracks formations appear and propagate in the sample bulk.
Keywords: AC Conductivity Measurements; Marble; Mechanical Load
1. Introduction
Mechanical stress applied on rocks creates microscopic
and macroscopic discontinuities resulting in changes in
their mechanical behaviour [1-3]. Marble is a metamor-
phic rock with imperfections in its structure due to either
internal or external factors such as mechanical strain,
chemical or physical processing which play an important
role in the behaviour of the material.
Various laboratory experiments on marble samples
have been recently conducted in order to determine the
impact of the mechanical stress and the consequent me-
chanical damage on the electrical properties of geomate-
rials. Such experiments include Dielectric Spectroscopy
in the frequency domain [4,5] and Isothermal Depolari-
zation Currents [6].
Dielectric properties are related to the capability of a
material to be polarised under the influence of an exter-
nally applied electrical field. The polarisability of a ma-
terial depends on its structure and molecular properties
and therefore dielectric measurements can provide in-
formation in this respect. Dielectric Spectroscopy (DS) is
an electrical technique that has been used to characterize
the rock microstructure and to provide useful information
about the relationships governing microstructure, elec-
trical properties, and chemical processes during hydra-
tion [7-9]. The complex relative permittivity *
(here-
after, referred to as complex permittivity for convenience)
is defined as:
0
j
j


  (1)
where
and
are the real and imaginary parts of
respectively,
is the electrical conductivity, 0
is the vacuum permittivity and
is the angular fre-
quency (2π
f
). It is widely observed that the ac con-
ductivity with respect to frequency obeys a power law
[10,11]. Jonscher [10] suggested that this law constitutes
a “universal” property of the materials. In general, ac con-
ductivity
f
is found to vary with frequency f as:
0n
f
Af

 (2)
at frequencies well below the lattice vibrational fre-
quency [10]. In Equation (2), is the dc limit of
conductivity, A is a parameter depending on temperature
and pressure and the exponent n takes values between 0
and 1. In the high frequency range since

0
0
n
Af
Equation (2) can be written as follows:
n
f
Af
(3)
Copyright © 2012 SciRes. OJAppS
I. STAVRAKAS ET AL.
62
In this work, marble specimens were subjected to uni-
axial compressive stress in order to cause damage to their
bulk. After each stress application and while the speci-
men remained unstressed two sets of ac conductivity
measurements were conducted in the frequency range
between 1 kHz and 1 MHz. During the first set of meas-
urements the specimen included its natural moisture
while during the second set the natural moisture of the
specimen was removed after heating. Initially, pilot ac
conductivity measurements were conducted for all the
specimens used.
2. Materials and Experimental Techniques
2.1. Materials
Marble belongs to the class of metamorphic rocks. Its
structural inhomogeneities are due to either natural or
man-made causes like the application of mechanical or
chemical processing. The marble specimens used were
prepared from samples collected from Mt. Penteli, Attica,
Greece. Marble from this area is mainly composed of
calcite (98%) and other minerals, such as muscovite,
sericite and chlorite. Its content in quartz is very low
(0.2%), while its density is 2.7 g/cm3 and its porosity is
approximately 0.4%. Matrix rocks of the above origin
were intentionally selected to be quasi single grained.
The dimensions of the prismatic specimens subjected to
compression were 38 mm × 20 mm × 9 mm. The me-
chanical stress was applied in parallel to the long edge of
the specimens.
The specimens were cleaved from the rock using two
different directions (see Figure 1). According to the di-
rection of cleavage the specimens were named as type-1
and type-2. The dashed lines of Figure 1 correspond to
the chlorite ((Mg,Fe,Al)6(Si,Al)4O10(OH) 8) and musco-
vite (KAl2(AlSi3)O10(OH)2) layers of the material.
Figure 1. Orientation of the specimens according to the
directions of the applied stress, the dielectric measurement
probes and the conductive layers of muscovite and chlorite
(type-1 and type-2 specimens).
It must also be noted that these layers due to their
chemical compositions are considered to be more con-
ductive than calcite which is the main mineral in marble.
Both types of specimens were tested in the subsequent
experiments.In order to achieve acceptably dry material,
the specimens were heated for 24 hours in a constant
temperature chamber at 378 K. The failure load of the
samples was detected after preliminary tests to vary be-
tween 8.6 kN and 10kN for both types of specimens.
2.2. Experimental Technique
The experimental apparatus that was used to conduct the
uniaxial compression test on the specimens is shown in
Figure 2 and comprises a stiff loading frame (MTS-815).
In this apparatus, the spherical seat is incorporated in the
upper loading platen of the frame. The load force was
parallel to the longest side of the specimen. The load on
the specimens was applied continuously at a displace-
ment rate equal to 0.001 mm/s. After reaching the prede-
termined stress level, the load was removed suddenly.
The selected mechanical load levels applied on the
specimens were 3.2 kN, 3.8 kN, 4.2 kN, 6.0 kN 7.3 kN
and 8.5 kN. After each loading ac conductivity measure-
ments were conducted. The experimental arrangement for
conducting the ac conductivity measurements (see Fig-
ure 3) comprises an LCR meter (Agilent model 4284A),
accompanied by a dielectric test fixture (Agilent model
16451B) and further supported by a computer for data
recording, storage and analysis. The dielectric test fixture
that was used to hold the specimen was protected by a
cabin providing constant temperature (298 K), inert at-
mosphere and also low humidity by continuous effusion
of nitrogen.
Figure 2. Typical testing system for uniaxial compression
testing.
Copyright © 2012 SciRes. OJAppS
I. STAVRAKAS ET AL. 63
3. Results and Discussion
Pilot ac conductivity measurements in the frequency
range 1 kHz - 1 MHz were conducted for type-1 and
type-2 specimens without removing their natural mois-
ture. Figure 4 shows the behaviour of the ac conductivity
with respect to the frequency for type-1 and type-2 speci-
mens. It becomes clear that type 2 specimens exhibit
higher ac conductivity in the whole frequency range. This
behaviour can be attributed to the fact that the external
electric field applied to measure the ac conductivity was
directed in parallel to the muscovite and chlorite layers
that act as conductive paths between the two electrodes
of the dielectric measurements probe (see Figure 1).
The high frequency part of the ac conductivity meas-
urements was fitted with the universal conductivity power
law (i.e. Equation 3). The fitting provided approximate
values 0.64 and 0.80 for the exponential factor n for
type-1 and type-2 specimens respectively. These values
seem to be characteristic for the two types since the error
deviation is very low (i.e. 0.64 ± 0.03 and 0.80 ± 0.04
respectively).
Figure 5 shows two representative ac conductivity
experimental datasets with respect to frequency for type-1
specimens. Figure 5(a), shows the behaviour of the ac
conductivity when the specimen without subjecting it to
any mechanical load while b shows the corresponding
behaviour of the same specimen after applying a me-
chanical load of 7.3 kN.
As can be seen in the Figure 5 the applied load has no
impact on the ac conductivity behaviour at the high fre-
quency ranges (>250 kHz) but it severely influences the
ac conductivity values at the low frequencies. It becomes
clear that the values of the ac conductivity become higher
after applying the mechanical load on the specimen. This
can be attributed to crack formation and propagation that
create additional conductive paths at the crack edges.
Figure 3. Dielectric measurements arrangement including
the inert gas tank.
Figure 4. A typical set of experimental datasets demonstrat-
ing the behaviour of the ac conductivity with respect to fre-
quency for both (solid squar es, a) type-1 and (ope n squares,
b) type-2 specimens.
Figure 5. A typical set of experimental datasets demonstrat-
ing the behaviour of the ac conductivity with respect to fre-
quency for type-1 specimen (solid squares, a) before and
(open squares, b) after apply ing 7.3 kN me c hanic al load.
This phenomenon provides greater freedom of charge
motion and consequently higher ac conductivity in the
low frequency range. The higher the frequency of the
applied ac field the lower is the current flowing along the
microcrack and macrocrack edges. The same behaviour
is observed for the type-2 specimens (see representative
datasets in Figure 6). Figure 6 clearly shows a variation
of the values of the ac conductivity before (a) and after (b)
applying mechanical load. Specifically, this variation
becomes evident only in the frequencies below 120 kHz.
The ac conductivity measurements of type-1 specimens
that had previously been loaded at 7.3 kN was also fitted
Copyright © 2012 SciRes. OJAppS
I. STAVRAKAS ET AL.
64
by the conductivity universal power law and factor n
found to be approximately equal to 0.63. This reduction
of the factor n indicates that the specimen has been sub-
jected to compressive stress [12]. Similar results were
extracted for type 2 specimens (see Figure 6).
When the natural moisture of the specimens is re-
moved by heating, the ac conductivity becomes lower.
This is evident in Figure 7 which shows the behaviour of
the ac conductivity with respect to frequency for a typical
type-1 specimen before and after the application of me-
chanical load.
Figure 6. A typical set of experimental datasets demon-
strating the behaviour of the ac conduc tivity with respect to
frequency for type-2 specimen (solid squares, a) before and
(open squares, b) after apply ing 8.5 kN me c hanic al load.
Figure 7. Representative experimental datasets of the ac
conductivity in the frequency range between 1 k Hz - 1 MHz
for type-1 specimen. (a) and (b) correspond to the specimens
that maintained their natural moisture before and after ap-
plying mechanical loa d (7.3 kN) respectively. (c) and ( d) cor-
respond to the specimens after removing their natural
moisture before and after applying mechanical load respec-
tively.
As it was expected when removing the natural mois-
ture of the specimens, their conductivity decreased due to
lack of free charges provided by water in the specimen
system. The variation breadth of the ac conductivity due
to the applied mechanical load is more intense for the
specimens containing their natural moisture compared to
the variation breadth for the dried specimens.
For the dried specimens a low frequency limit was set
to the measurements due to conductivity values that be-
come too low to comply with the measuring system
specifications and the corresponding conductivity values
exhibit error factor of 5%. This limit is obvious in Figure
7 where the ac conductivity measurements for the dehy-
drated specimen are conducted in the frequency range
between 10 kHz and 1 MHz.
The ac conductivity behaviour at the frequency of 10
kHz was selected to be studied with respect to the ap-
plied mechanical load. This frequency was selected since
the phenomena of ac conductivity variation due to stress
and due to water content become more intense in the low
frequency range. Additionally, this frequency is high
enough to avoid hardware limitations due to low conduc-
tivity effects, thus, ensuring that the total measurement
factor will not exceed 1%.
Figure 8 shows the relative ac conductivity for the
frequency of 10 kHz with respect to the applied uniaxial
load for both dehydrated (a) and hydrated (b) type-1
specimens. The value measured before any load applica-
tion was considered as reference conductivity. The verti-
cal axis corresponds to the relative conductivity (σ/σ0)
where σ0 is the reference conductivity and σ is the 10
kHz conductivity value. The horizontal axis corresponds
to the applied load.
The Figure 8 also contains the ac conductivity devia-
tion limits in order to include the results from all meas-
ured specimens. The circles in the figure correspond to
the mean value of ac conductivity for each value of the
applied load.
Figure 8. Representative plot of the behaviour of ac con-
ductivity for all type-1 specimens in both before (b) and af-
ter (a) removing their natural moisture.
Copyright © 2012 SciRes. OJAppS
I. STAVRAKAS ET AL.
Copyright © 2012 SciRes. OJAppS
65
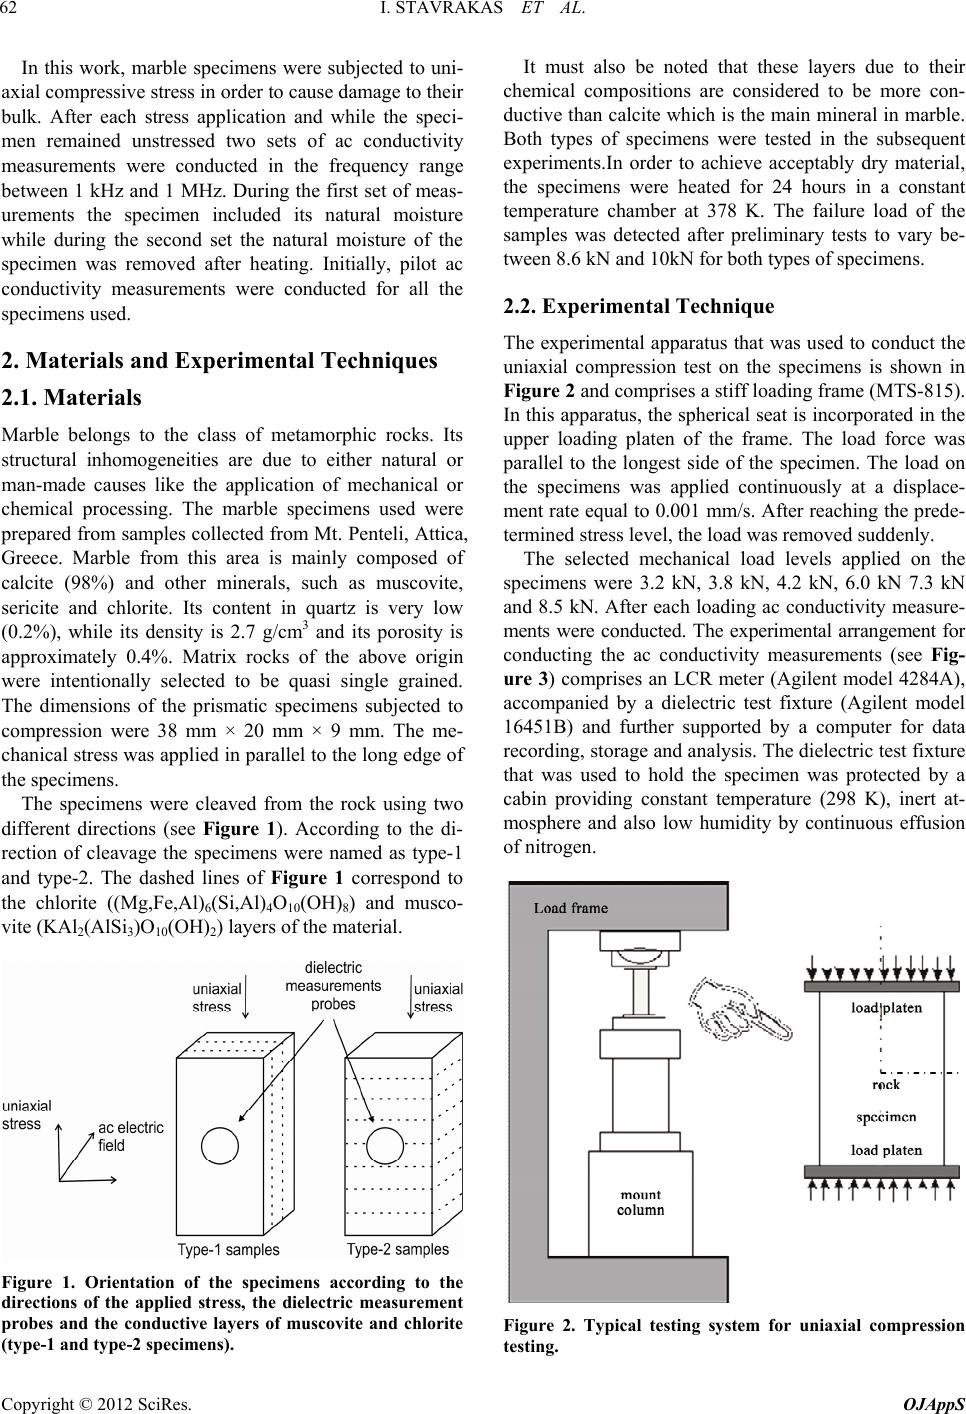
Figure 9. Representative plot of the behaviour of ac con-
Observing Figure 8 it can be stressed that for type-1
sp
ductivity of the specimens that were s
je
la
4. Conclusions
rimental results manifest that uniaxial
crack
ge
e marble specimens that were subjected to uni-
ax
ductivity for all type-2 specimens in both before (b) and
after (a) removing their natural moisture.
ecimens that was subjected to load up to approximately
3 kN, the ac conductivity decreases while the applied
load increases. This can be attributed to the pore-closing
process that takes place in this load range and the conse-
quent limitation of the conductive paths in the bulk of the
specimen.
The ac conub-
cted to load in the range between 3 kN and 7.5 kN,
increases significantly with increasing load. This increase
can be attributed to the crack propagation mechanisms
that create additional conductive paths at the crack edges.
The behaviour of the dehydrated specimens was simi-
r but exhibited lower conductivity magnitudes. The
lower magnitude of the changes of the ac conductivity
can be attributed to the absence of water in the bulk of
the specimen. It can be concluded that ac conductivity
measurements can provide information regarding the
mechanical status of marble specimens that have suffered
stress enough to create damages in their bulk. The same
behaviour holds for type 2 specimens and it is shown in
Figure 9 with slightly smaller variations.
The presented expe
compressional loading, causes significant variations to
the ac conductivity spectrum of marble specimens.
The applied uniaxial load when leading to micro
neration in the bulk of the specimens makes conduc-
tivity to increase due to hydration within the micro-
cracks.
For th
ial compressional load the ac conductivity was meas-
ured in the frequency range 1 kHz up to 1 MHz. The re-
sults presented here correspond to the frequency of 10
kHz since it is the most sensitive to show up ac conduc-
tivity variations for changes of load.
REFERENCES
[1] F. G. Bell, “Engineering Properties of Soils and Rocks,”
Blackwell Science Publishers, Hoboken, 2000.
[2] J. C. Jaeger and N. G. W. Cook, “Fundamentals of Rock
Mechanics,” Chapman and Hall Publishers, London, 1979.
doi:10.1017/CBO9780511735349
[3] D. L. Turcotte, W. I. Newman and R. Shcherbakov, “Mi-
cro and Macroscopic Models of Rock Fracture,” Geo-
physical Journal International, Vol. 152, No. 3, 2003, pp.
718-728. doi:10.1046/j.1365-246X.2003.01884.x
[4] D. Triantis, C. Anastasiadis, I. Stavrakas and F. Valliana-
tos, “Dielectric Characteristics of Marble Rocks after the
Application of Various Stress Modes before Fracture,”
WSEAS Transactions on Systems, Vol. 3, 2004, pp. 102-
106.
[5] C. Anastasiadis, I. Stavrakas, D. Triantis, A. Kyriazopou-
los and K. Ninos, “Rock Damage Estimation with Dielec-
tric Loss (tanδ) Measurements,” International Journal of
Microstructure and Materials Properties, Vol. 1, No. 3-4,
2006, pp. 421-429.
[6] I. Stavrakas, D. Triantis and C. Anastasiadis, “The Influ-
ence of Externally Applied Uniaxial Stress on Isothermal
Depolarization Current Mechanisms in Rock Samples,”
Journal of Material Science, Vol. 40, No. 17, 2005, pp.
4593-4596. doi:10.1007/s10853-005-1152-3
[7] T. L. Chelidze, Y. Gueguen and C. Ruffet, “Electrical Spec-
troscopy of Porous Rocks: A Review—II. Experimental
Results and Interpretation,” Geophysical Journal Interna-
tional, Vol. 137, No. 1, 1999, pp. 16-34.
doi:10.1046/j.1365-246x.1999.00800.x
[8] T. L. Chelidze and Y. Gueguen, “Electrical spectroscopy
of Porous Rocks: A Review—I. Theoretical Model,”
Geophysical Journal International, Vol. 137, No. 1, 1999,
pp. 1-15. doi:10.1046/j.1365-246x.1999.00799.x
[9] A. Kyritsis, M. Siakantari, A. Vassilikou-Dova, P. Pissis,
and P. Varotsos, “Dielectric and Electrical Properties of
Polycrystalline Rocks at Various Hydration Levels,” IEEE
Transactions on Dielectrics and Electrical Insulation,
Vol. 7, No. 4, 2000, pp. 493-497.
[10] A. K. Jonscher, “Dielectric Relaxation in Solids,” Chelsea
Dielectric Press, London, 1983.
[11] J. Dyre, “Some Remarks on ac Conduction in Disordered
Solids,” Journal of Non-Crystalline Solids, Vol. 135, No.
2-3, 1991, pp. 219-226.
doi:10.1016/0022-3093(91)90423-4
[12] C. Anastasiadis, D. Triantis, I. Stavrakas, A. Kyriazo-
poulos and F. Vallianatos, “Ac Conductivity Measurements
of Rock Samples after the Application of Stress Up to
Fracture. Correlation with the Damage Variable,” WSEAS
Transactions on Systems, Vol. 4, No. 3, 2005, pp. 185-
190.