Journal of Modern Physics
Vol.4 No.5(2013), Article ID:31606,6 pages DOI:10.4236/jmp.2013.45089
Steady-State and Transient Electron Transport within Bulk InAs, InP and GaAs: An Updated Semiclassical Three-Valley Monte Carlo Simulation Analysis
Research Unit of Materials and Renewable Energies, Faculty of Technology, University of Tlemcen, Tlemcen, Algeria
Email: guenahlam@yahoo.fr, bouaguen@yahoo.fr
Copyright © 2013 A. Guen-Bouazza et al. This is an open access article distributed under the Creative Commons Attribution License, which permits unrestricted use, distribution, and reproduction in any medium, provided the original work is properly cited.
Received March 25, 2013; revised April 26, 2013; accepted May 23, 2013
Keywords: Electron Transport; Simulation; Monte Carlo Simulation; Velocity Overshoot; Materials
ABSTRACT
An ensemble Monte Carlo simulation is used to compare high field electron transport in bulk InAs, InP and GaAs. In particular, velocity overshoot and electron transit times are examined. For all materials, we find that electron velocity overshoot only occurs when the electric field is increased to a value above a certain critical field, unique to each material. This critical field is strongly dependent on the material, about 3 kV/cm for InAs, 10 kV/cm for InP and 5 kV/cm for the case of GaAs, We find that InAs exhibits the highest peak overshoot velocity and that this velocity overshoot lasts over the longest distances when compared with GaAs and InP. Finally, we estimate the minimum transit time across a 1 μm InAs sample to be about 2 ps. Similar calculations for InP and GaAs yield 6.6 and 5.4 ps, respectively. We find that the optimal cutoff frequency for an ideal InAs based device ranges from around 79 GHz when the device thickness is set to 1 μm. We thus suggest that indium arsenide offers great promise for future high-speed device applications. The steady-state and transient velocity overshoot characteristics are in fair agreement with other recent calculations.
1. Introduction
InAs and InP substrates are one of the promising materials systems for optical communication devices, very high frequency applications and quantum dots (QDs) infrared photodetectors [1,2]. Compared to the InAs/GaAs pair, InAs/InP has a smaller 3.2% lattice mismatch, resulting in the formation of relatively larger QDs. Despite these advantages, because the anions are different in InAs/InP unlike the InAs/GaAs case, complex interface reactions during the growth of the heteroepitaxial layers, such as As/P exchange reaction or as carryover due to the switching of group V sources, make it difficult to grow highquality QD layers and to control their properties [3]. For the above stated reasons, InAs, InP and GaAs materials are of great interest for power FET and optoelectronic device structures. To clarify the expected performance of these materials, transport as well as device studies are critical. The Monte Carlo technique has proved valuable for studying non-equilibrated carrier transport in a range of semiconductor materials and devices [3,4]. Howevercarrier transport modelling of InP and InAs materials has only recently begun to receive sustained attention, now that the progress in compounds and alloys has resulted in the production of valuable materials for the electronics industry [5]. Thus, it is the purpose of this paper to compare steady-state and transient velocity overshoot in InAs, InP and GaAs materials using an ensemble Monte Carlo studies. The simulations have been carried out using a non-parabolic ellipsoidal valley model to describe transport in the conduction band. This article is organized as follows. Details of the conduction band parameters and the Monte Carlo simulation are presented in Section 2, and the results of steady state and transient transport simulations are discussed in Section 3.
2. Simulation Models
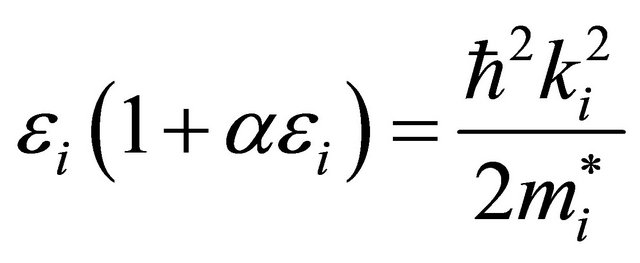
In order to calculate the electron drift velocity for large electric fields, consideration of conduction band satellite valleys is necessary. The first principles band structure of zincblende InAs, InP and GaAs predicts a direct band gap located at the Γ point and lowest energy conduction band satellite valleys at the X point and at the L point. In our Monte Carlo simulation, the Γ valley, the three equivalent X valleys, the four equivalent L valleys, are represented by ellipsoidal, non-parabolic dispersion relationships of the following form [6-8]:
 (1)
(1)
where,  is effective mass at the band edge and
  is the non-parabolicity coefficient of i-the valley. For each simulation, the motion of 20.000 electron particles is examined, the temperature being set to 300 K and the doping concentration being set to 1017 cm−3. The scattering mechanisms included within the simulation are: acoustic phonon scattering, the equivalent and nonequivalent inter-valley non-polar optical phonon scattering, polar optical phonon scattering, ionized impurity scattering, piezoelectric scattering. Band edge energies, effective masses and non-parabolic are derived from empirical pseudopotential calculations.
3. The Monte Carlo Method
The principle of this method consists in following the behavior of each electron submitted to an electric field  , in real space and the waves vectors space [4-11], for that:
a) We have associated for each carrier which we want to simulate the trajectory, an initial wave vector  and an initial vector position
 .
.
b) We have used the procedure “self-scattering”. It consists in building a distribution of time following a law whose expression is simplified by the introduction of a fictitious interaction to the null effects known as “selfscattering” [1]. The knowledge of the state of the electron is carried out during instant of time irregularly partitioned.
c) With each of the time step we know, for each carrier, its wave vector  and that position
  at the instant where the measurement begins. Then for a carrier noted “
 ”, we know:
 (2)
(2)
d) We accomplish a coasting flight of duration , so we will have:
 (3)
(3)
e) We look for if there was an interaction during the interval of time  by pulling at the fate of a random number:
- If there was no interaction, the state of the carrier is not modified;
- If there was interaction, we place the interaction at the instant  and one seeks
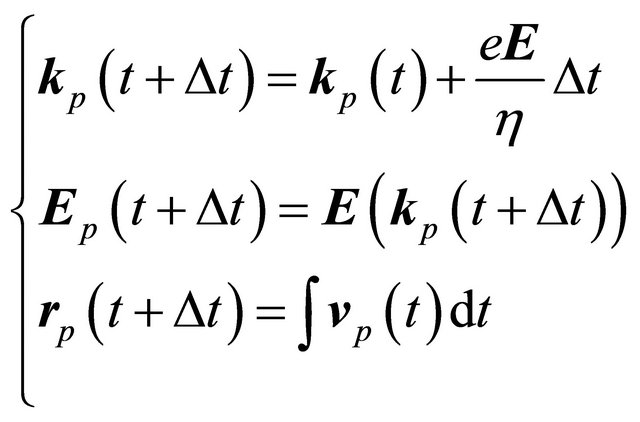
  after the shock by drawing lots from a random number, its state is defined now by [12,13]:
 (4)
(4)
4. Results and Discussions
Figure 1 shows the simulated velocity-field characteristics of zincblende InAs, InP, and GaAs semiconductors at 300 K, with a background doping concentration of 1017 cm−3. The simulations suggest that the peak drift velocity for zincblende InAs is 3.22 × 107 cm∙s−1 while that for InP and GaAs are about 2.5 × 107 cm∙s−1 and 2.3 × 107 cm∙s−1 respectively. At higher electric fields, intervalley optical phonon emission dominates, causing the drift velocity to saturate at around 1 × 107 cm∙s−1 for all materials.
The average carrier kinetic energy as a function of electric field is shown in Figure 2 at 300 K. These curves have the shape typical of III-V compounds, which is a consequence of inter-valley transfer. At high fields, the curve for InAs suggests that the average electron energy is higher than for InP and GaAs.
This difference can be understood by considering the Γ valley occupancy as a function of field (Figure 3). Intervalley transfer is substantially larger in the InAs, due to the combined effect of a lower Γ-valley effective mass,
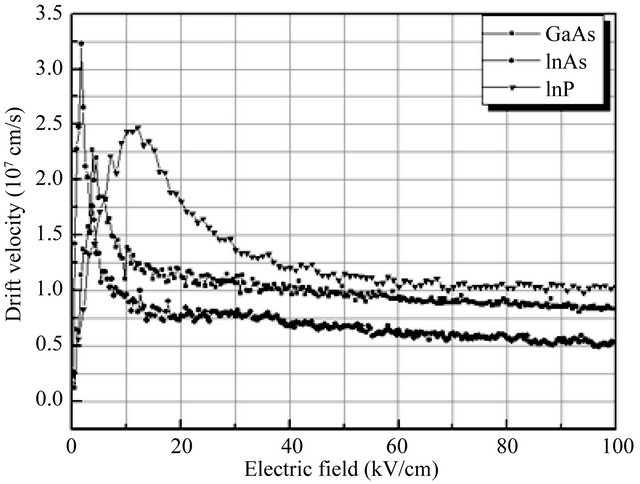
Figure 1. Calculated steady-state electron drift velocity in bulk zincblende InAs, InP and GaAs at room temperature.
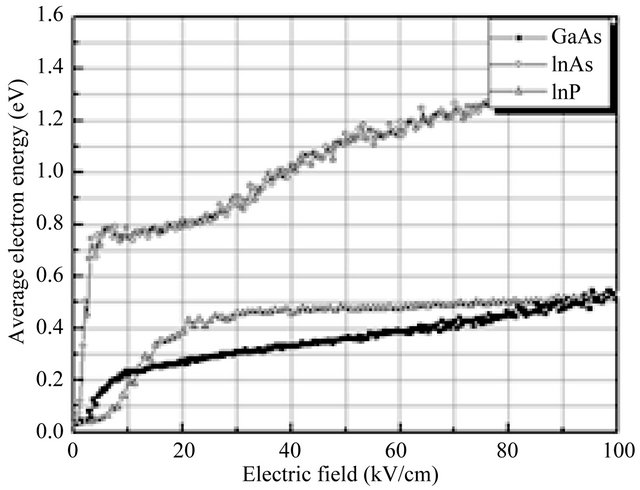
Figure 2. Average electron kinetic energy as a function of applied electric field in bulk InAs, InP and GaAs at room temperature.
lower satellite valley separation and reduced phonon scattering rate within the Γ-valley. The valley occupancy for the Γ, X and L valleys is illustrated in Figure 3 and shows that the inclusion of the satellite valleys in the simulation is important. Significant intervalley scattering into the satellite valleys occurs for fields above the threshold field for each material. The reason can be explained in terms of the energy band structure, in particular, in terms of different electron effective masses within the central valley. This is important because electrons which are near a valley minimum have small kinetic energy and are therefore strongly scattered. It is apparent that intervalley transfer is substantially larger in InAs over the range of applied electric fields shown, due to the combined effect of a lower Γ effective mass, lower satellite valley separation energy, and a slightly lower phonon scattering rate within the Γ valley.
We have also examined transient electron transport in bulk InAs, InP and GaAs semiconductors. The transient responses of electrons in these materials are compared in Figure 4 for fields up to 50 kV/cm strength.
In InAs, very little or no overshoot occurs below the threshold field of 3 kV/cm. As the electric field strength is increased to a value above the threshold field, overshoot begins to occur. As the field strength is increased further, both the peak overshoot velocity increases and the time for overshoot relaxation decreases. In InAs, the velocity overshoot initially increases more rapidly with increasing electric field due to the lower Γ valley effective mass. For example, at 20 kV/cm, the maximum overshoot velocity for InAs is about 10 × 107 m∙s−1, whereas for InP and GaAs it is about 3.74 × 10⁷ m∙s−1 and 5.35 × 10⁷ m∙s−1 respectively. It is found also that for the same value of electric field above the threshold value, the electron drift velocity is always smaller in InP and


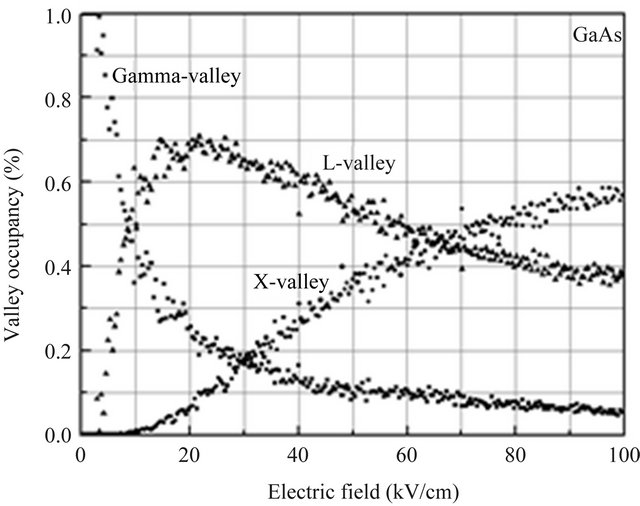
Figure 3. Fractional occupation of the central Γ and satellite valleys of zincblende InAs, InP, GaAs as a function of applied electric field at room temperature.
GaAs than in InAs. Figure 5 shows the average velocity of electrons in InAs, InP and GaAs as a function of distance. We note that for the applied field of 3 to 50 kV/cm

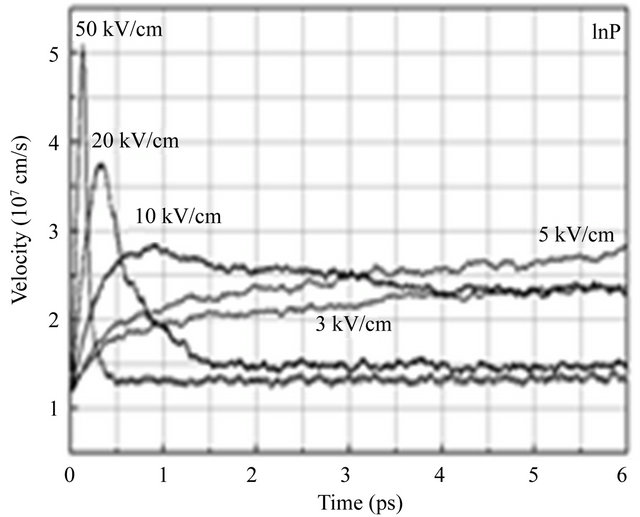

Figure 4. A comparison of the velocity overshoot effect exhibited by InAs, InP, and GaAs semiconductors as calculated by Monte Carlo simulation.
the average electron velocity reaches steady-state very quickly with little or no velocity overshoot. It is suggested that in InAs, 3 kV/m is the critical field for the


Figure 5. A comparison of the average electron velocity as a function of the displacement for various applied fields in InAs, InP and GaAs semiconductors.
onset of velocity overshoot. As mentioned above, 3 kV/m also corresponds to the peak in the velocity-field characteristic associated with InAs. Steady-state Monte Carlo simulations suggest that this is the point at which significant upper valley occupation begins to occur, as shown in Figure 3. This signifies that velocity overshoot is related to the transfer of electrons to the upper valleys [9,10]. To optimise device performance, we have to minimise the transit time over a given distance.
Figure 6 shows a comparison of the velocity overshoot effects amongst the three materials considered in this analysis, i.e., InAs, InP and GaAs. It is clear that among the three III-V semiconductors considered, InAs exhibits superior transient electron transport characteristics. In particular, InAs has the largest overshoot velocity and the distance over which this overshoot occurs, 200 nm, is longer than in either InP or GaAs.
In Figure 7, we plot the distance displaced since the application of the electric field in InAs, InP and GaAs as a function of the time elapsed, for a number of different applied electric field strength selections. For a given selection of gate length we wish to obtain the applied electric field which yields the smallest transit time, τ. We note that the velocity overshoot that occurs substantially contributes to the initial rate of increase in the distance


Figure 6. Comparison of transient effects and distance in InAs, InP and GaAs semiconductors for 50 kV/cm.
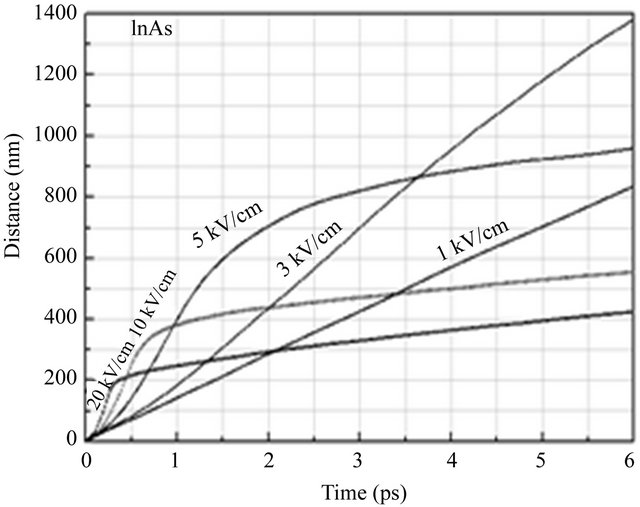

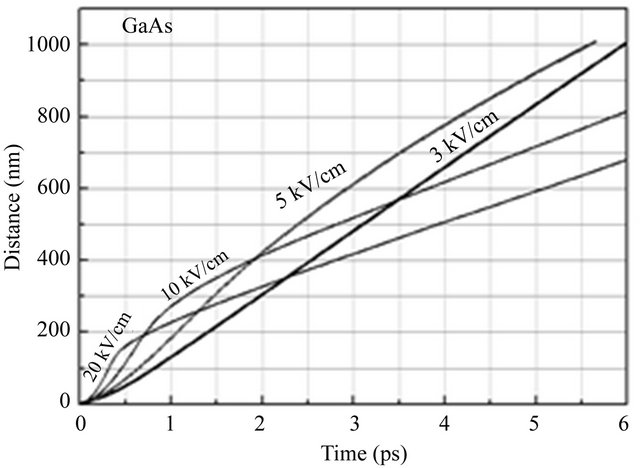
Figure 7. Distance of travel as a function of time for various applied fields in InAs, InP and GaAs semiconductors.
displaced. Eventually, however, steady-state conditions are achieved, and the electron drift velocity settles to its steady-state value. It is noted that for a given displacement, L, that there exists an optimal applied electric field strength that will minimize the corresponding time to transit, τ. For L set to 1 μm, from Figure 7 it is seen that for the cases of the applied electric field strength set to 1, 3, 5, 10, and 20 kV/cm, that the corresponding times to transit, τ, are 6.2, 2.09, 2.47, 4.82 and 8.92 ps, respectively. A detailed analysis, the results of which are presented in Figure 8, suggests that the time to transit across 1 μm, is minimized when the applied electric field strength is between 2 and 10 kV/cm, τ being about ~2 ps for InAs, ~6.6 ps for InP and ~5.4 ps for GaAs.
Noting that the cutoff frequency for a device,
 (5)
(5)
where τ is the time of transit [10]. By using this relation for a time of transit equal to 1 μm, we estimate the cutoff frequency device based by InAs is approximately 79 GHz, InP with 24 GHz and GaAs with 29 GHz. By way of contrast, the analysis of Foutz et al. [7] suggests that the optimal cutoff frequency for the case of a 1 μm thick GaN based device is about 50 GHz, while that corresponding to a 1 μm thick GaAs based device is around 30 GHz.
5. Conclusion
In this paper, steady-state and transient electron transport results, corresponding to the III-V semiconductors, InAs, InP, and GaAs, were presented, these results being obtained from our Monte Carlo simulations of the electron transport within these materials. Steady-state electron transport was the dominant theme of our analysis. Using valley models to describe the electronic bandstructure, calculated velocity-field characteristics are in fair agreement with other calculations. The velocity-field characteristics of the materials show similar trends, reflecting the fact that all the semiconductors have satellite-valley effective densities of states several times greater than the central Γ valley. Finally, transient electron transport and velocity overshoot in InAs, InP, and GaAs are examined.

Figure 8. The time to transit as a function of the applied electric field strength for L set to 1 μm for the cases of InAs, InP and GaAs.
For all materials, we find that electron velocity overshoot only occurs when the electric field is increased to a value above a certain critical field, unique to each material. This critical field is strongly dependent on the material, about 3 kV/cm for the case of InAs, 10 kV/m for InP and 5 kV/cm for GaAs. We find that InAs exhibits the highest peak overshoot velocity and that this velocity overshoot lasts over the longest distances when compared with InP and GaAs. We found that the optimal cutoff frequency for an ideal indium-arsenide based device ranges from around 79 GHz when the device thickness is set to 1 μm. We thus suggest that indium arsenide offers great promise for future high-speed device applications. The steady-state and transient velocity overshoot characteristics are in fair agreement with other recent calculations.
REFERENCES
- H. Cheong, Y. J. Jeon and H. Hwang, Journal of Korean Physical Society, Vol. 44, 2004, p. 697. doi:10.3938/jkps.44.697
- S. Adachi, “GaAs and Related Materials, Bulk Semiconducting and Superlattice Properties,” World Scientific, Singapore City, 1994.
- H. Arabshahi, Modern Physics Letters B, Vol. 22, 2008, pp. 1695-1702. doi:10.1142/S0217984908016364
- C. Moglestue, “Monte Carlo Simulation of Semiconductor Devices,” Chapman and Hall, New York, 1993. doi:10.1007/978-94-015-8133-2
- C. Jacoboni and P. Lugli, “The Monte Carlo Method for Semiconductor and Device Simulation,” Springer-Verlag, New York, 1989. doi:10.1007/978-3-7091-6963-6
- H. Arabshahi, Maejo International Journal of Science and Technology, Vol. 4, 2010, pp. 159-168.
- B. E. Foutz, L. F. Eastman, U. V. Bhapkar and M. Shur, Applied Physics Letters, Vol. 70, 1997, pp. 2849-2854. doi:10.1063/1.119021
- C. Sayah, B. Bouazza, A. Guen-Bouazza and N. E. Chabane-Sari, Afrique Science, Vol. 4, 2008, pp. 186-198.
- S. K. O’Leary, B. E. Foutz, M. S. Shur and L. F. Eastman, Applied Physics Letters, Vol. 87, 2005, Article ID: 222103. doi:10.1063/1.2135876
- S. K. O’Leary, B. E. Foutz, M. S. Shur and L. F. Eastman, Applied Physics Letters, Vol. 88, 2006, Article ID: 152113. doi:10.1063/1.2193469
- M. Fadel, “Contribution à l’Etude du Bruit et du Transport en Régime d’Electrons Chauds Dans l’InP,” Thèse 3ème Cycle Electronique, Université des Sciences et Techniques du Languedoc, Académie de Montpellier, 1983.
- M. Nedjalkov and H. Kosina, Mathematics and Computers in Simulation, Vol. 55, 2001, pp. 191-198.
- J.-L. Thobel, A. Sleiman, P. Bourel, F. Dessenne and L. Baudry, Journal of Applied Physics, Vol. 80, 1996, pp. 928-935. doi:10.1063/1.362903