 Advances in Bioscience and Biotechnology, 2013, 4, 11-17 ABB http://dx.doi.org/10.4236/abb.2013.49A002 Published Online September 2013 (http://www.scirp.org/journal/abb/) Carbohydrate analysis by methanolysis method and application to compositional analysis of transparent exopolymer particles Shigeki Wada1,2*, Kazuo Iseki3, Takeo Hama1 1Life and Environmental Sciences, University of Tsukuba, Tsukuba, Japan 2Shimoda Marine Research Center, University of Tsukuba, Shimoda, Japan 3Graduate School of Biosphere Science, Hiroshima University, Hiroshima, Japan Email: *swadasbm@kurofune.shimoda.tsukuba.ac.jp Received 6 July 2013; revised 7 August 2013; accepted 21 August 2013 Copyright © 2013 Shigeki Wada et al. This is an open access article distributed under the Creative Commons Attribution License, which permits unrestricted use, distribution, and reproduction in any medium, provided the original work is properly cited. ABSTRACT Measurement of uronic acids (URAs) which are a group of acidic sugar, would be useful for the under- standing of dynamics of bacterial extracellular poly- meric substances (EPS) in marine environments. However, the URA analysis using traditional hy- drolysis method which is used for neutral sugar analysis poses serious problems in URA that is unsta- ble under hydrolysis. We developed the methanolysis method, which deploymerizes polysaccharides while retaining quantitative information. Our method was applied to coastal seawater, and the URAs distribu- tion was compared with that of transparent exopoly- mer particles (TEP) which are acidic sugar contain- ing particles. Since the relationship of URA with TEP was relatively weak, URA-containing polysaccharides present in bacterial EPS would not participate as a structural component of TEP. Keywords: Uronic Acid; Transparent Exopolymer Particles; Methanolysis; Gas Chromatography Mass Spectrometry 1. INTRODUCTION Quantitative and qualitative analyses of carbohydrates in seawater provide some information on dynamics of or- ganic matter such as its origin and diagenetic processes [1-3], as well as its vertical transport and sedimentation [4-6]. Monosaccharides characterized in these studies were mainly neutral sugars (NSs), which comprise a major group of carbohydrates, but there are other minor sugar groups such as uronic acids (URAs). Although URA, a carboxylated acidic sugar, has minor contribu- tion to total carbohydrates in most cases, it is known as an important component of bacterial extracellular poly- meric substances (EPSs) (20% - 50% of total carbohy- drate: [7,8]), and URA measurements are likely to reflect the dynamics of bacterial EPSs in a water column. EPSs readily adhere to each other as a result of their pro- nounced stickiness [9], and constitute amorphous aggre- gates such as transparent exopolymer particles (TEPs), which are defined as particles containing acidic sugar [10,11]. Since TEPs are relevant to sinking particle for- mation and the supply of food to filter feeders [11-14], URA measurements should allow us to better understand the contribution of bacterial EPSs to these processes. Analysis of neutral sugars has been achieved by using chromatographic measurements after depolymerization under acid hydrolysis reaction [15]. On the other hand, application of acid hydrolysis method to URA analysis has some problems, because URA, once released after hydrolysis, forms lactones irreproducibly [16]. To over- come this, it is necessary to correct the recovery yield of URA after hydrolysis reaction, or to use other depoly- merization method. In the present study, we apply the methanolysis method, which depolymerizes polysaccha- rides using methanolic HCl. High recovery yields for authentic standards and some plant materials were achieved by some previous researchers [17,18], but the suitability of the methanolysis method for marine envi- ronmental samples has yet to be examined. In the present study, we modified a previous metha- nolysis method for the determination of URA in seawater samples [17,18]. In addition, we examined the mono- saccharide composition of natural seawater sample in a coastal environment using the methanolysis method, and compared the distribution of URA in the water column *Corresponding author. OPEN ACCESS  S. Wada et al. / Advances in Bioscience and Biotechnology 4 (2013) 11-17 12 with that of TEP to understand the contribution of URA to aggregate formation. 2. MATERIALS AND METHODS 2.1. Sample Collection In 2007, seawater samples were collected from a coastal region at a station in Suo-Nada (30 m depth, 131,16E, 33,49N) during the fifth cruise of the TRV Toyoshio Maru of Hiroshima University in July, 2007. Seawater was collected from 1, 5, 10, 15, 20 and 25 m using a Ro- sette sampler fitted with Niskin bottles. The samples were filtered through precombusted (450˚C, 4 h) glass fiber filters (Whatman GF/F) and the filters were stored at −20˚C until analysis. In the present study, we carried out duplicate analyses for the samples at each depth. 2.2. Derivatization The experimental scheme is a modification of the meth- ods of Doco et al. (2001) and [19]. For analysis of par- ticulate carbohydrates, chopped filter samples were placed in a 10 ml glass tube, and internal standard (myo- Inositol) was added. We putted the tube in a vacuum desiccator with phosphorous oxide (V) for 1 day to re- move any water completely. After adding 2 ml 0.5 N methanolic HCl (mixture of 15 ml MeOH with 0.4 ml acetyl chloride) to the dried pellets, the tubes were soni- cated for 15 min, sealed tightly and heated at 80˚C for 24 h (methanolysis reaction). After cooling to room tem- perature, the samples were centrifuged and the super- natant was transferred to another test tube. MeOH (1 ml) was added to the tube with chopped filter. The tube weresonicated for a few s, centrifuged, and resulting su- pernatant was combined with the previous one (this pro- cedure was repeated 2×). After addition of 20 μl pyridine for neutralization of the supernatant, the samples were dried under an N2 stream at 40˚C and stored in a vacuum desiccator with phosphorus oxide (V) for 3 days. Since the reagents for trimethylsilylation are readily decom- posed by water, complete removal of water from the samples was checked. TMSi-H [hexamethyldisilazane/trimethylchlorosilane/ pyridine, 2/1/10 (v/v/v), GL Science] was added (0.2 ml) to the dried samples and the tubes were heated at 80˚C for 2 h for the conversion to TMS derivatives. After cooling to room temperature, the samples were dried under an N2 stream at 40˚C and the dried pellets were dissolved in hexane and sonicated for a few s. The tubes were centrifuged and the supernatant was injected into a gas chromatograph/mass spectrometer within 24 h after trimethylsilylation at room temperature, because the de- rivatized sample becomes unstable a few days after the reaction. Standard materials for calibration also under- went methanolysis and trimethylsilyl reactions as well as the natural samples. 2.3. Analysis with Gas Chromatography/Mass Spectrometry GC/MS (QP 2050, Shimadzu) used an HP-1 fused silica column (30 m × 0.25 mm i.d., 0.25 mm film thickness, Hewlett Packard) and the electron impact ionization (EI) mode. The detailed analytical condition were: inlet and interface temperature 250˚C, ion source temperature 200˚C: column oven temperature programme 50˚C (1 min), to 120˚C at 50˚C· mi n −1, to 145˚C at 1˚C·mi n−1, to 200˚C at 0.9˚C·min−1, to 230˚C (held 10 min) at 10˚C·min−1 in order to separate eight NSs i.e. arabinose (Ara), ribose (Rib), rhamnose (Rha), fucose (Fuc), xylose (Xyl), mannose (Man), galactose (Gal) and glucose (Glc), and two URAs, galacturonic acid (Gal Ac) and glucuronic acid (Glc Ac) (Table 1). We confirmed the retention time by measuring authentic standards one by one; D-Arabi- nose (Wako), D-Ribose (Pfanstiehl Laboratories Inc), L-Rhamnose monohydrate (Wako), L-Fucose (Pfanstiehl Laboratory Inc), D-Xylose (Wako), D-Mannose (Wako), D-Galactose (Wako), D-Glucose (Wako), D-Galacturonic acid (Wako), and D-Glucuronic acid (Wako). Table 1. Retention times of each monosaccharide. Name of Sugar Retention time (min) Arabinose (1) 14.30 ± 0.021 Arabinose (2) 14.82 ± 0.022 Ribose (2) 15.00 ± 0.020 Ribose (1) 15.70 ± 0.021 Rhamnose (1) 16.01 ± 0.021 Rhamnose (2) 16.33 ± 0.019 Fucose (1) 17.22 ± 0.024 Fucose (2) 18.46 ± 0.023 Xylose (1) 19.78 ± 0.021 Xylose (2) 21.09 ± 0.027 Glucuronic acid (2) 24.88 ± 0.029 Mannose (1) 30.32 ± 0.029 Mannose (2) 32.20 ± 0.031 Galactose (1) 33.51 ± 0.035 Galacturonic acid (1) 34.64 ± 0.029 Galacturonic acid (2) 35.19 ± 0.032 Galactose (2) 36.06 ± 0.028 Glucose (1) 37.69 ± 0.038 Glucuronic acid (1) 39.06 ± 0.036 Glucose (2) 39.90 ± 0.036 Internal Standard (myo-Inositol) 57.74 ± 0.217 Peaks of two isomers were quantified in the present study, and order of peak intensity between the two isomers was indicated with number in parenthesis (higher peak: (1), lower peak: (2)). Copyright © 2013 SciRes. OPEN ACCESS  S. Wada et al. / Advances in Bioscience and Biotechnology 4 (2013) 11-17 Copyright © 2013 SciRes. 13 OPEN ACCESS Three fragment ions (m/z = 204 and 217 in 10 - 24.75 and 25.8 - 100 min, and m/z = 204 and 230 in 24.75 - 25.8 min) commonly found in the mass spectra of TMS derivatives of carbohydrates when EI is used were moni- tored in the selective ion monitoring (SIM) mode [19]. The methanolysis reaction theoretically generates 4 - 6 isomers from each monosaccharide, but it is difficult to quantify all of the isomers because some minor peaks were too small to quantify. Since the generation patterns of isomers would be constant if the condition (tempera- ture and time) of methanolysis reaction does not change as described in latter section, we choose the highest and second highest peaks for quantification in most case. For galactose, the 1st and 3rd peak were quantified in the present study, because the 3rd highest peak of mannose coeluted with the 2nd highest one of galactose. The ana- lytical errors (coefficients of variance between duplicate analyses) for each monosaccharide were 0.81% - 36%, and mostly the values were around 10% (Table 2). 2.4. Analyses of Particulate Organic Carbon and TEP Particulate organic carbon (POC) concentration was de- termined using an elemental analyzer (FISONS EA 1108). For analysis of TEP concentration, 70 ml of sea- water samples were filtered through polycarbonate filter (Millipore) with pore size of 0.4 μm, and immediately stained by prefiltered alcian-blue solution (0.2 μm, 0.02% alcian blue 8 GX in 0.06% acetic acid) which stains acidic sugar. The filters were transferred into 80% H2SO4 for 2 h, and the absorption at 787 nm was measured. The TEP concentration operationally defined as alcian blue- stained particles of size >0.4 μm [10,20], were measured colorimetrically according to the method of Passow and Alldredge [20]; the concentration was normalized with a gum xanthan equivalent per liter (GX equiv. l−1). 3. RESULTS & DISCUSSION When applying the methanolysis method to seawater samples, it is essential to take account of the presence of various organic compounds as concomitants, which can- not be completely separated from carbohydrates. Appli- cation of the EI/SIM mode in GC/MS enables us to minimize the possible effect from non-carbohydrate com- pounds which overlap with target compounds during the GC separation, since only the specific fragment ions for carbohydrates [19] were monitored in the present study, as described above. We have conducted preliminary measurements using GC-FID, which detects organic compounds non-selectively to estimate their concentra- tions. However, some of the monosaccharides cannot be quantified due to the overlap with concomitant peaks (data not shown). Thus, the application of selective de- tection in the GC/MS would be preferable for the analy- sis of the concentrations of carbohydrates using the methanolysis method. Although 4 - 6 isomers theoretically occur from each monosaccharide, it is operationally difficult and labori- ous to detect all the isomers including minor ones. Since the generation patterns of isomers would be constant regardless of their initial form such as anomeric or ring size configurations of the carbohydrates before derivati- zation [19], we measured only the highest and second highest peaks in the present study. If such selection of major peak was appropriate for quantitative analysis, ratios of peak area of the second highest peak to the first one would be similar between authentic standards and environmental samples. Therefore, we also checked the isomeric ion composition (ratios of second highest peak against first one) between standard compounds used for calibration and natural sample. In conclusion, the isomer composition was similar between them (Table 3). Concentrations of POC and TCHOs (sum of 8 NSs and 2 URAs) decreased from 24,000 - 26,000 and 3200 - 4000 nM C in surface layer (1 - 10 m) to 14,000 - 21,000 and 1300 - 2000 nM C in bottom layer (15 - 25 m) (Fig- ures 1(a) and (b)). The proportions of TCHO to POC were 8.4% - 16%, and the value was higher in the surface layer (1 - 10 m: 13% - 16%, 15 - 25 m: 8.4% - 13%). These results for profiles of TCHO concentration and contribution of TCHO to POC were generally consistent Table 2. Error ranges of duplicate samples. Depth(m) Ara Rib Rha Fuc Xyl Glc AcGal AcMan Gal Glc TCHO 1 11.7 30.2 20.3 17.6 11.7 4.93 5.89 4.38 4.37 8.62 0.808 5 ND ND ND ND ND ND ND ND ND ND ND 10 4.08 21.2 5.51 4.10 3.75 6.15 4.46 1.99 1.07 0.697 5.40 15 5.01 16.8 8.74 7.00 10.5 10.1 9.34 16.5 0.909 11.0 11.3 20 6.55 1.02 13.9 11.6 5.51 12.1 17.9 24.6 10.9 1.58 13.1 25 16.0 5.82 36.2 25.6 18.7 3.24 3.77 10.1 0.810 2.73 11.4 Values are coefficient of variance between duplicate analysis. ND means not determined because single data was obtained for the sample at 5 m depth. 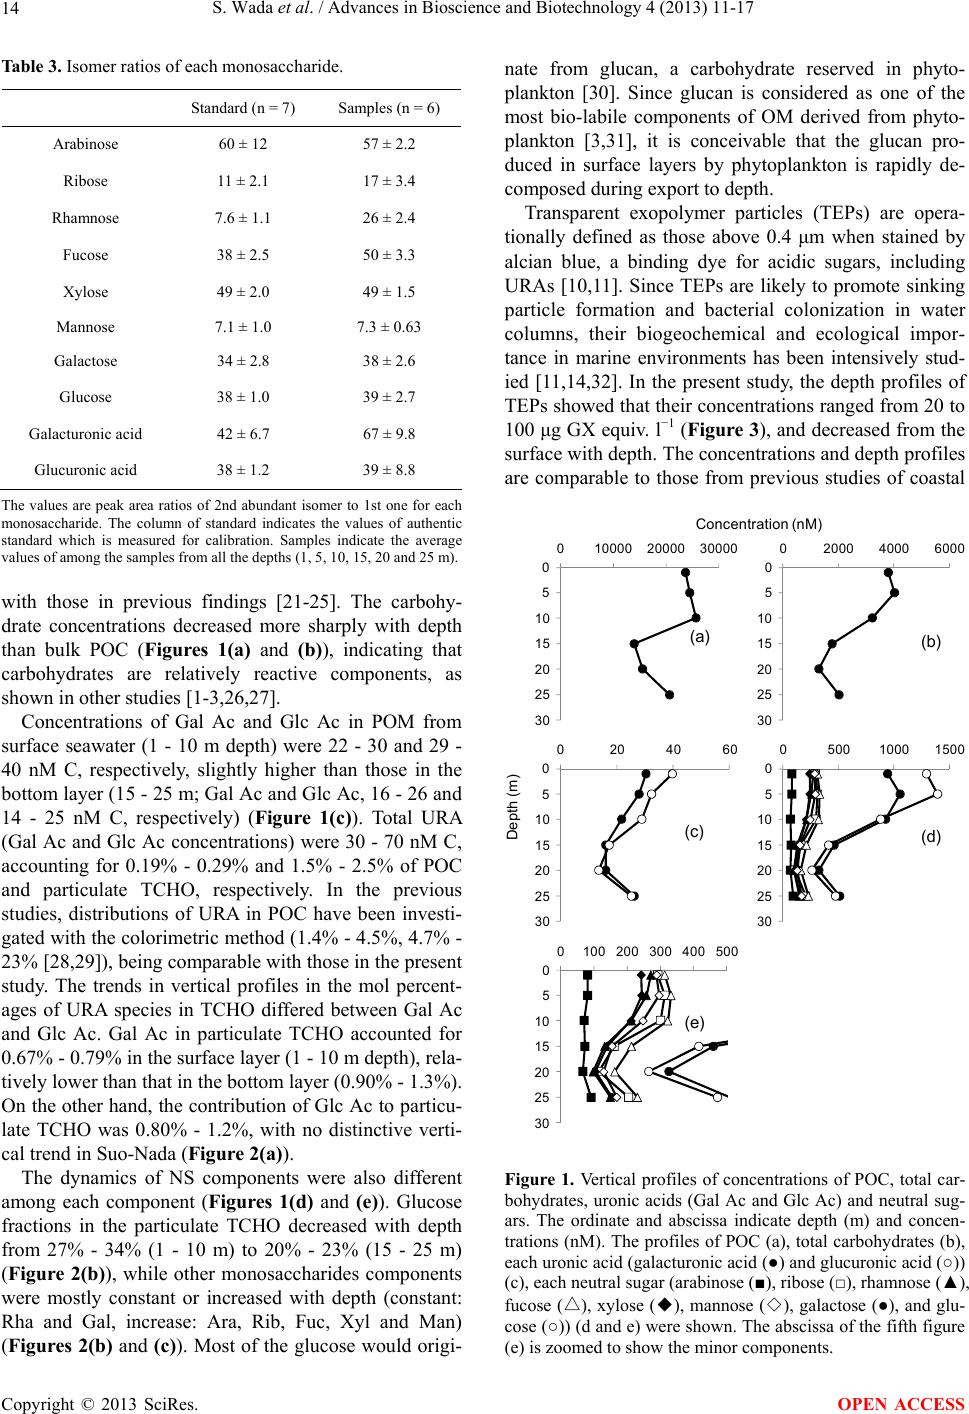 S. Wada et al. / Advances in Bioscience and Biotechnology 4 (2013) 11-17 14 Table 3. Isomer ratios of each monosaccharide. Standard (n = 7) Samples (n = 6) Arabinose 60 ± 12 57 ± 2.2 Ribose 11 ± 2.1 17 ± 3.4 Rhamnose 7.6 ± 1.1 26 ± 2.4 Fucose 38 ± 2.5 50 ± 3.3 Xylose 49 ± 2.0 49 ± 1.5 Mannose 7.1 ± 1.0 7.3 ± 0.63 Galactose 34 ± 2.8 38 ± 2.6 Glucose 38 ± 1.0 39 ± 2.7 Galacturonic acid 42 ± 6.7 67 ± 9.8 Glucuronic acid 38 ± 1.2 39 ± 8.8 The values are peak area ratios of 2nd abundant isomer to 1st one for each monosaccharide. The column of standard indicates the values of authentic standard which is measured for calibration. Samples indicate the average values of among the samples from all the depths (1, 5, 10, 15, 20 and 25 m). with those in previous findings [21-25]. The carbohy- drate concentrations decreased more sharply with depth than bulk POC (Figures 1(a) and (b)), indicating that carbohydrates are relatively reactive components, as shown in other studies [1-3,26,27]. Concentrations of Gal Ac and Glc Ac in POM from surface seawater (1 - 10 m depth) were 22 - 30 and 29 - 40 nM C, respectively, slightly higher than those in the bottom layer (15 - 25 m; Gal Ac and Glc Ac, 16 - 26 and 14 - 25 nM C, respectively) (Figure 1(c)). Total URA (Gal Ac and Glc Ac concentrations) were 30 - 70 nM C, accounting for 0.19% - 0.29% and 1.5% - 2.5% of POC and particulate TCHO, respectively. In the previous studies, distributions of URA in POC have been investi- gated with the colorimetric method (1.4% - 4.5%, 4.7% - 23% [28,29]), being comparable with those in the present study. The trends in vertical profiles in the mol percent- ages of URA species in TCHO differed between Gal Ac and Glc Ac. Gal Ac in particulate TCHO accounted for 0.67% - 0.79% in the surface layer (1 - 10 m depth), rela- tively lower than that in the bottom layer (0.90% - 1.3%). On the other hand, the contribution of Glc Ac to particu- late TCHO was 0.80% - 1.2%, with no distinctive verti- cal trend in Suo-Nada (Figure 2(a)). The dynamics of NS components were also different among each component (Figures 1(d) and (e)). Glucose fractions in the particulate TCHO decreased with depth from 27% - 34% (1 - 10 m) to 20% - 23% (15 - 25 m) (Figure 2(b)), while other monosaccharides components were mostly constant or increased with depth (constant: Rha and Gal, increase: Ara, Rib, Fuc, Xyl and Man) (Figures 2(b) and (c)). Most of the glucose would origi- nate from glucan, a carbohydrate reserved in phyto- plankton [30]. Since glucan is considered as one of the most bio-labile components of OM derived from phyto- plankton [3,31], it is conceivable that the glucan pro- duced in surface layers by phytoplankton is rapidly de- composed during export to depth. Transparent exopolymer particles (TEPs) are opera- tionally defined as those above 0.4 μm when stained by alcian blue, a binding dye for acidic sugars, including URAs [10,11]. Since TEPs are likely to promote sinking particle formation and bacterial colonization in water columns, their biogeochemical and ecological impor- tance in marine environments has been intensively stud- ied [11,14,32]. In the present study, the depth profiles of TEPs showed that their concentrations ranged from 20 to 100 μg GX equiv. l−1 (Figure 3), and decreased from the surface with depth. The concentrations and depth profiles are comparable to those from previous studies of coastal 0 5 10 15 20 25 30 02000 4000 6000 0 5 10 15 20 25 30 010000 20000 30000 0 5 10 15 20 25 30 0 204060 0 5 10 15 20 25 30 0100 200 300 400 500 0 5 10 15 20 25 30 05001000 1500 (a) (b) (c) (d) (e) Depth (m) Concentration ( nM) Figure 1. Vertical profiles of concentrations of POC, total car- bohydrates, uronic acids (Gal Ac and Glc Ac) and neutral sug- ars. The ordinate and abscissa indicate depth (m) and concen- trations (nM). The profiles of POC (a), total carbohydrates (b), each uronic acid (galacturonic acid (●) and glucuronic acid (○)) (c), each neutral sugar (arabinose (■), ribose (□), rhamnose (▲), △ fucose (), xylose (◆), mannose (◇), galactose (●), and glu- cose (○)) (d and e) were shown. The abscissa of the fifth figure (e) is zoomed to show the minor components. Copyright © 2013 SciRes. OPEN ACCESS 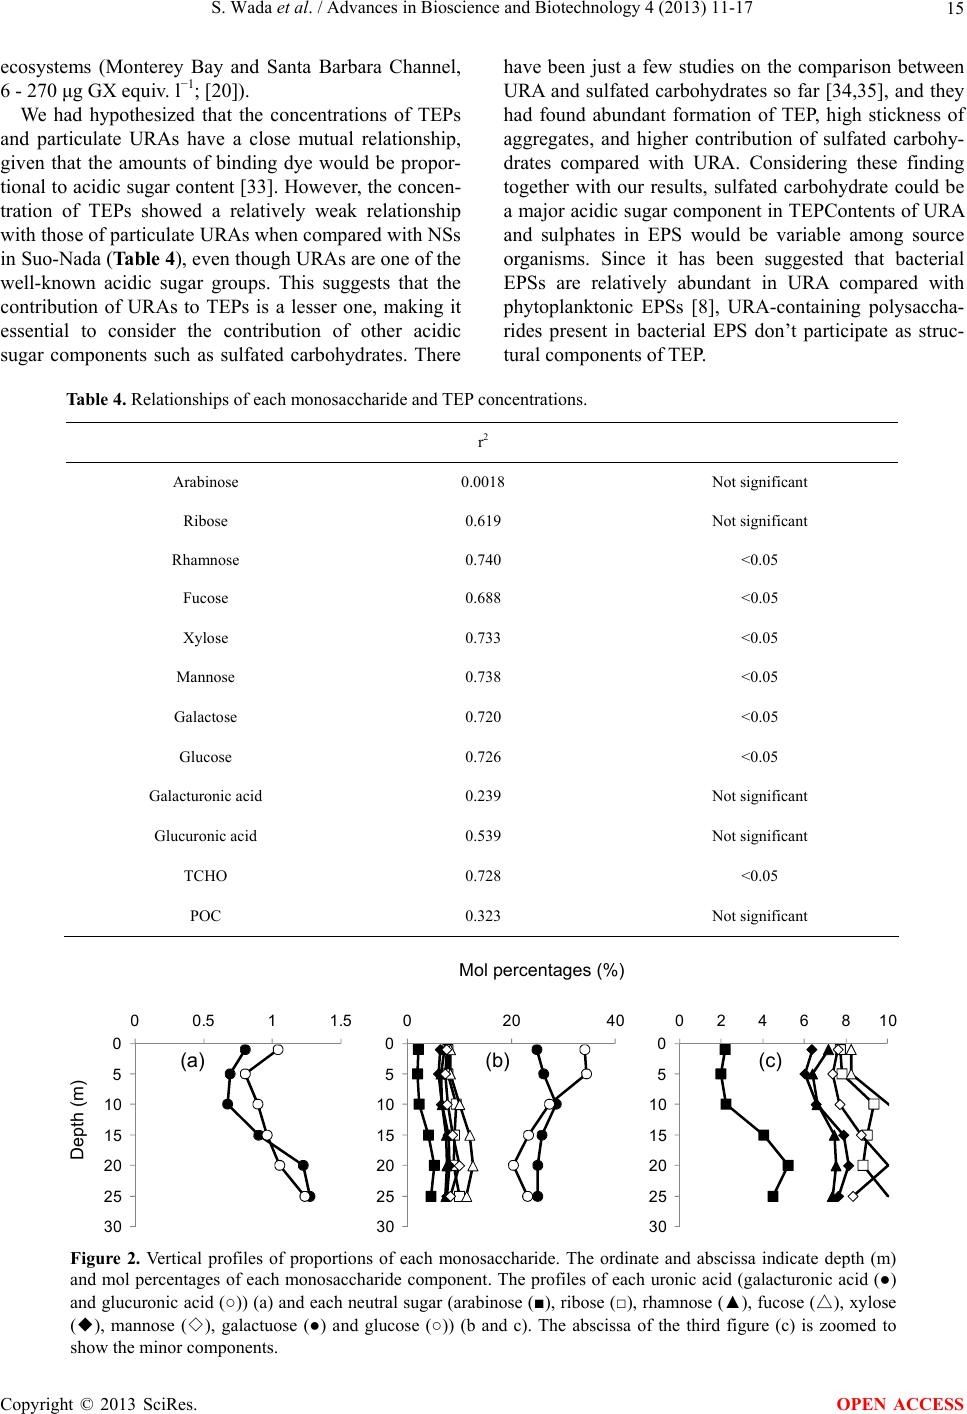 S. Wada et al. / Advances in Bioscience and Biotechnology 4 (2013) 11-17 15 ecosystems (Monterey Bay and Santa Barbara Channel, 6 - 270 μg GX equiv. l−1; [20]). We had hypothesized that the concentrations of TEPs and particulate URAs have a close mutual relationship, given that the amounts of binding dye would be propor- tional to acidic sugar content [33]. However, the concen- tration of TEPs showed a relatively weak relationship with those of particulate URAs when compared with NSs in Suo-Nada (Table 4), even though URAs are one of the well-known acidic sugar groups. This suggests that the contribution of URAs to TEPs is a lesser one, making it essential to consider the contribution of other acidic sugar components such as sulfated carbohydrates. There have been just a few studies on the comparison between URA and sulfated carbohydrates so far [34,35], and they had found abundant formation of TEP, high stickness of aggregates, and higher contribution of sulfated carbohy- drates compared with URA. Considering these finding together with our results, sulfated carbohydrate could be a major acidic sugar component in TEPContents of URA and sulphates in EPS would be variable among source organisms. Since it has been suggested that bacterial EPSs are relatively abundant in URA compared with phytoplanktonic EPSs [8], URA-containing polysaccha- rides present in bacterial EPS don’t participate as struc- tural components of TEP. Table 4. Relationships of each monosaccharide and TEP concentrations. r 2 Arabinose 0.0018 Not significant Ribose 0.619 Not significant Rhamnose 0.740 <0.05 Fucose 0.688 <0.05 Xylose 0.733 <0.05 Mannose 0.738 <0.05 Galactose 0.720 <0.05 Glucose 0.726 <0.05 Galacturonic acid 0.239 Not significant Glucuronic acid 0.539 Not significant TCHO 0.728 <0.05 POC 0.323 Not significant 0 5 10 15 20 25 30 00.511.5 0 5 10 15 20 25 30 02040 0 5 10 15 20 25 30 024681 Mol percentages (%) Depth (m) (a)(b) (c) 0 Figure 2. Vertical profiles of proportions of each monosaccharide. The ordinate and abscissa indicate depth (m) and mol percentages of each monosaccharide component. The profiles of each uronic acid (galacturonic acid (●) and glucuronic acid (○)) (a) and each neutral sugar (arabinose (■), ribose (□), rhamnose (▲), fucose (△), xylose (◆), mannose (◇), galactuose (●) and glucose (○)) (b and c). The abscissa of the third figure (c) is zoomed to show the minor components. Copyright © 2013 SciRes. OPEN ACCESS 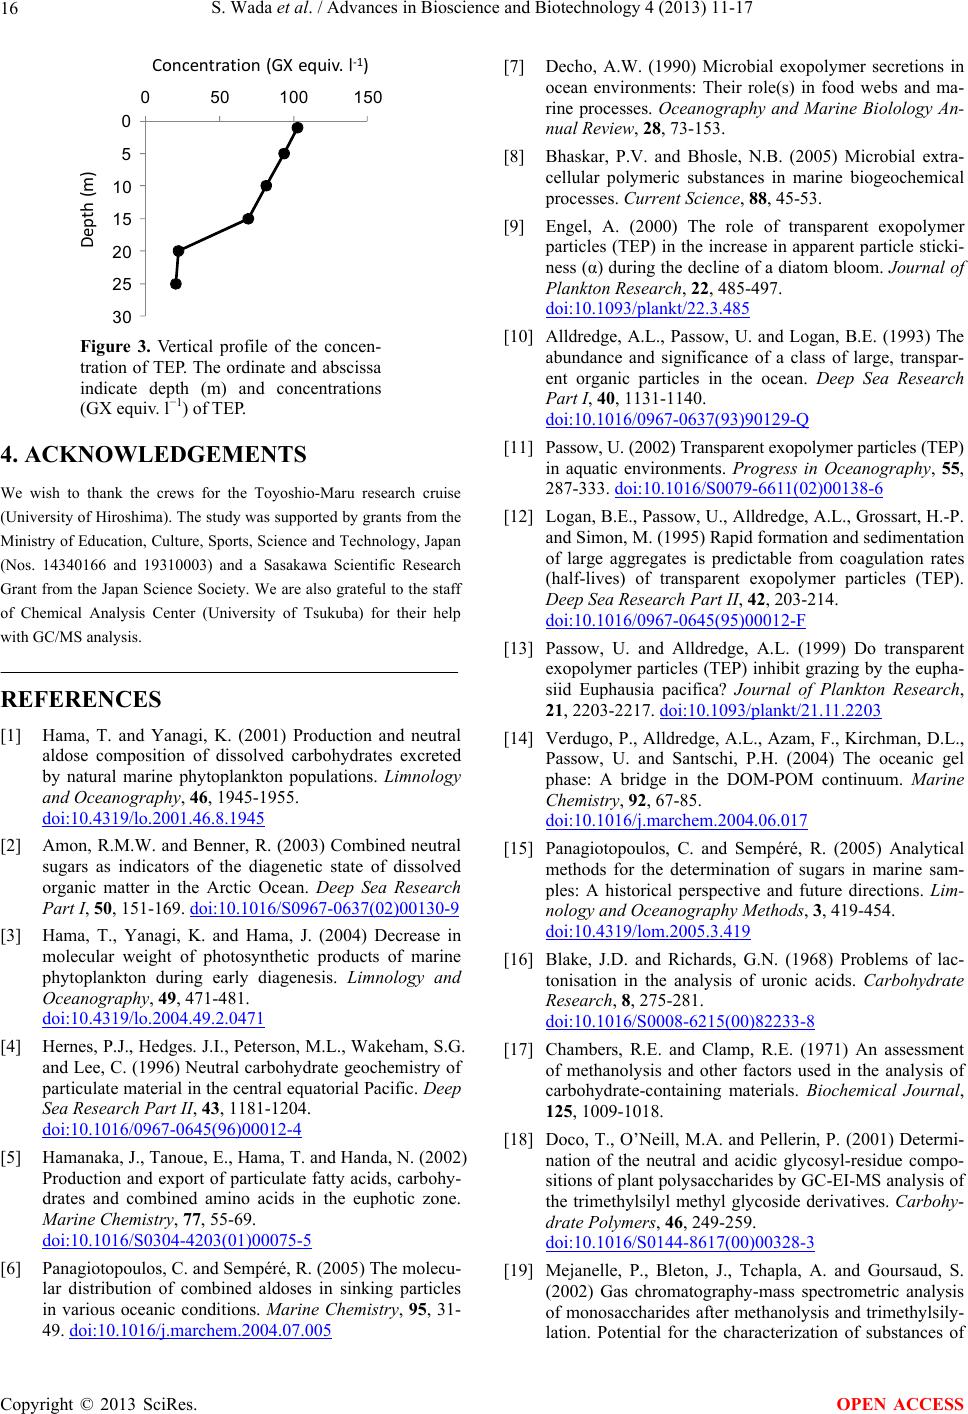 S. Wada et al. / Advances in Bioscience and Biotechnology 4 (2013) 11-17 16 0 5 10 15 20 25 30 050100 150 Concentrati on(GX equiv.l ‐1 ) Depth(m) Figure 3. Vertical profile of the concen- tration of TEP. The ordinate and abscissa indicate depth (m) and concentrations (GX equiv. l−1) of TEP. 4. ACKNOWLEDGEMENTS We wish to thank the crews for the Toyoshio-Maru research cruise (University of Hiroshima). The study was supported by grants from the Ministry of Education, Culture, Sports, Science and Technology, Japan (Nos. 14340166 and 19310003) and a Sasakawa Scientific Research Grant from the Japan Science Society. We are also grateful to the staff of Chemical Analysis Center (University of Tsukuba) for their help with GC/MS analysis. REFERENCES [1] Hama, T. and Yanagi, K. (2001) Production and neutral aldose composition of dissolved carbohydrates excreted by natural marine phytoplankton populations. Limnology and Oceanography, 46, 1945-1955. doi:10.4319/lo.2001.46.8.1945 [2] Amon, R.M.W. and Benner, R. (2003) Combined neutral sugars as indicators of the diagenetic state of dissolved organic matter in the Arctic Ocean. Deep Sea Research Part I, 50, 151-169. doi:10.1016/S0967-0637(02)00130-9 [3] Hama, T., Yanagi, K. and Hama, J. (2004) Decrease in molecular weight of photosynthetic products of marine phytoplankton during early diagenesis. Limnology and Oceanography, 49, 471-481. doi:10.4319/lo.2004.49.2.0471 [4] Hernes, P.J., Hedges. J.I., Peterson, M.L., Wakeham, S.G. and Lee, C. (1996) Neutral carbohydrate geochemistry of particulate material in the central equatorial Pacific. Deep Sea Research Part II, 43, 1181-1204. doi:10.1016/0967-0645(96)00012-4 [5] Hamanaka, J., Tanoue, E., Hama, T. and Handa, N. (2002) Production and export of particulate fatty acids, carbohy- drates and combined amino acids in the euphotic zone. Marine Chemistry, 77, 55-69. doi:10.1016/S0304-4203(01)00075-5 [6] Panagiotopoulos, C. and Sempéré, R. (2005) The molecu- lar distribution of combined aldoses in sinking particles in various oceanic conditions. Marine Chemistry, 95, 31- 49. doi:10.1016/j.marchem.2004.07.005 [7] Decho, A.W. (1990) Microbial exopolymer secretions in ocean environments: Their role(s) in food webs and ma- rine processes. Oceanography and Marine Biolology An- nual Review, 28, 73-153. [8] Bhaskar, P.V. and Bhosle, N.B. (2005) Microbial extra- cellular polymeric substances in marine biogeochemical processes. Current Science, 88, 45-53. [9] Engel, A. (2000) The role of transparent exopolymer particles (TEP) in the increase in apparent particle sticki- ness (α) during the decline of a diatom bloom. Journal of Plankton Research, 22, 485-497. doi:10.1093/plankt/22.3.485 [10] Alldredge, A.L., Passow, U. and Logan, B.E. (1993) The abundance and significance of a class of large, transpar- ent organic particles in the ocean. Deep Sea Research Part I, 40, 1131-1140. doi:10.1016/0967-0637(93)90129-Q [11] Passow, U. (2002) Transparent exopolymer particles (TEP) in aquatic environments. Progress in Oceanography, 55, 287-333. doi:10.1016/S0079-6611(02)00138-6 [12] Logan, B.E., Passow, U., Alldredge, A.L., Grossart, H.-P. and Simon, M. (1995) Rapid formation and sedimentation of large aggregates is predictable from coagulation rates (half-lives) of transparent exopolymer particles (TEP). Deep Sea Research Part II, 42, 203-214. doi:10.1016/0967-0645(95)00012-F [13] Passow, U. and Alldredge, A.L. (1999) Do transparent exopolymer particles (TEP) inhibit grazing by the eupha- siid Euphausia pacifica? Journal of Plankton Research, 21, 2203-2217. doi:10.1093/plankt/21.11.2203 [14] Verdugo, P., Alldredge, A.L., Azam, F., Kirchman, D.L., Passow, U. and Santschi, P.H. (2004) The oceanic gel phase: A bridge in the DOM-POM continuum. Marine Chemistry, 92, 67-85. doi:10.1016/j.marchem.2004.06.017 [15] Panagiotopoulos, C. and Sempéré, R. (2005) Analytical methods for the determination of sugars in marine sam- ples: A historical perspective and future directions. Lim- nology and Oceanography Methods, 3, 419-454. doi:10.4319/lom.2005.3.419 [16] Blake, J.D. and Richards, G.N. (1968) Problems of lac- tonisation in the analysis of uronic acids. Carbohydrate Research, 8, 275-281. doi:10.1016/S0008-6215(00)82233-8 [17] Chambers, R.E. and Clamp, R.E. (1971) An assessment of methanolysis and other factors used in the analysis of carbohydrate-containing materials. Biochemical Journal, 125, 1009-1018. [18] Doco, T., O’Neill, M.A. and Pellerin, P. (2001) Determi- nation of the neutral and acidic glycosyl-residue compo- sitions of plant polysaccharides by GC-EI-MS analysis of the trimethylsilyl methyl glycoside derivatives. Carbohy- drate Polymers, 46, 249-259. doi:10.1016/S0144-8617(00)00328-3 [19] Mejanelle, P., Bleton, J., Tchapla, A. and Goursaud, S. (2002) Gas chromatography-mass spectrometric analysis of monosaccharides after methanolysis and trimethylsily- lation. Potential for the characterization of substances of Copyright © 2013 SciRes. OPEN ACCESS  S. Wada et al. / Advances in Bioscience and Biotechnology 4 (2013) 11-17 17 vegetal origin: Application to the study of museum ob- jects. Journal of Chromatography Library, 66, 845-902. doi:10.1016/S0301-4770(02)80049-5 [20] Passow, U. and Alldredge, A.L. (1995) A dye-binding assay for the spectrophotometric measurement of trans- parent exopolymer particles (TEP). Limnology and Ocea- nography, 40, 1326-1335. doi:10.4319/lo.1995.40.7.1326 [21] Borch, N.H. and Kirchman, D.L. (1997) Concentration and composition of dissolved combined neutral sugars (polysaccharides) in seawater determined by HPLC-PAD. Marine Chemistry, 57, 85-95. doi:10.1016/S0304-4203(97)00002-9 [22] Myklestad, S.M., Sånøy, E.and Hestmann, S. (1997) A sensitive and rapid method for analysis of dissolved mono- and polysaccharides in seawater. Marine Chemis- try, 56, 279-286. doi:10.1016/S0304-4203(96)00074-6 [23] Skoog, A. and Benner, R. (1997) Aldoses in various size fractions of marine organic matter: Implications for car- bon cycling. Limnology and Oceanography, 42, 1803- 1813. doi:10.4319/lo.1997.42.8.1803 [24] Kirchman, D.L., Meon, B., Ducklow, H.W., Carlson, C.A., Hansell, D.A. and Steward, G.F. (2001) Glucose fluxes and concentrations of dissolved combined neutral sugars (polysaccharides) in the Ross Sea and Polar Front Zone, Antarctica. Deep Sea Research Part II, 48, 4179- 4197. doi:10.1016/S0967-0645(01)00085-6 [25] Benner, R. (2002) Chemical composition and reactivity. In: Hansell, D.A. and Carlson, C.A., Eds., Biogeochemis- try of Marine Dissolved Organic Matter, Academic Press, San Diego, 59-90. doi:10.1016/B978-012323841-2/50005-1 [26] Pakuski, J.D. and Benner, R. (1994) Abundance and dis- tribution of carbohydrates in the ocean. Limnology and Oceanography, 39, 930-940. doi:10.4319/lo.1994.39.4.0930 [27] Amon, R.M.W., Fitznar, H.-P. and Benner, R. (2001) Linkage among the bioreactivity, chemical composition, and diagenetic state of marine dissolved organic matter. Limnology and Oceanography, 46, 287-297. doi:10.4319/lo.2001.46.2.0287 [28] Hung, C-C., Guo, L., Santschi, P.H., Alvarado-Quiroz, N. and Haye, J.M. (2003) Distribution of carbohydrate spe- cies in the Gulf of Mexico. Marine Chemistry, 81, 119- 135. doi:10.1016/S0304-4203(03)00012-4 [29] Khodse, V.B., Fernandes, L., Bhosle, V.V., Fernandes, V., Matondkar, S.G.P. and Bhushan, R. (2007) Distribution and seasonal variation of concentrations of particulate carbohydrates and uronic acids in the northern Indian Ocean. Marine Chemistry, 103, 327-346. doi:10.1016/j.marchem.2006.10.003 [30] Manners, D.J. and Sturgeon, R.J. (1982) Reserve carbo- hydrates of algae, fungi, and lichens. In: F. A. Loewus and W. Tanner, Eds., Intracellular Carbohydrates, Springer- Verlag, Berlin, 472-514. [31] Hanamachi, Y., Hama, T. and Yanai, T. (2008) Decom- position process of organic matter derived from freshwa- ter phytoplankton. Limnology and Oceanography, 9, 57- 69. [32] Simon, M., Grossart, H-P., Schweitzer, B. and Ploug, H. (2002) Microbial ecology of organic aggrefates in aquatic ecosystems. Aquatic Microbial Ecology, 28, 175-211. doi:10.3354/ame028175 [33] Ramus, J. (1977) Alcian blue: A quantitative aqueous as- say for algal acid and sulfated polysaccharides. Journal of Phycology, 13, 345-348. [34] Mopper, K. (1977) Sugars and uronic acids in sediment and water from the Black Sea and North Sea with empha- sis on analytical techniques. Marine Chemistry, 5, 585- 603. doi:10.1016/0304-4203(77)90044-5 [35] Zhou, J. and Mopper, K. (1998) The role of surface-ac- tive carbohydrates in the formation of transparent exopo- lymer particles by bubble adsorption of seawater. Lim- nology and Oceanography, 43, 1860-1871. Copyright © 2013 SciRes. OPEN ACCESS
|