Novel Corrosion Inhibitors for Carbon Steel Alloy in Acidic Medium of 1N HCl Synthesized from Graphene Oxide ()
1. Introduction
Nowadays the nanocompounds are used in wide field of applications due to their ability to do them because of a large number of the functional groups in their chemical structures. One of them is graphene oxide (GO). In recent years, GO nanosheets have drawn special interest in various fields such as supercapacitors, batteries, and photocatalysis etc. The intriguing properties of GO arises from its chemical composition, which consists of graphene sheets with several oxygenated functional moieties attached, such as hydroxyl, carbonyl, carboxyl and epoxyl groups. In this respect, the chemical composition and physico-chemical properties of GO are attractive towards the application of corrosion resistant properties [1] [2] . The use of inhibitors for the control of corrosion for metals and alloys which are in contact with aggressive environment is an accepted practice. Large numbers of organic compounds were studied to investigate their corrosion inhibition potential. All these studies reveal that organic compounds especially those with N, S and O showed significant inhibition efficiency [3] [4] ; inhibitors are added to the acidic solution during the acidizing process to reduce the aggressive corrosive effects of the acid on tubing and casing materials. Inhibitors are widely used for the protection of metals to corrosion in acidic environments. Inhibitors usually protect the metal by adsorbing on the surface and retarding metal corrosion in aggressive media. Therefore, selecting the appropriate inhibitor for a particular metal is very important. Most of the well-known inhibitors are organic compounds containing nitrogen, and oxygen [5] . A considerable number of studies have been published on the inhibition of steel and its alloys in acidic medium [6] [7] [8] [9] [10] .
2. Materials and Method
2.1. Materials
C-steel (C1010) was obtained from Metal Samples (USA) was used with the following composition by percentage weight: C = 0.13, Mn = 0.3, Si = 0.37, P = 0.04, S = 0.05, Cr = 0.1, Ni = 0.3, Cu = 0.3, AS = 0.08 and the remainder is Fe. Ethanol amine, graphite, Hydrogen peroxide, Potassium permanganate, Sodium nitrate, maracapto ethanol from Fluka, Hydrochloric acid, Sulphuric acid from BDH.
2.2. Experimental Methods
2.2.1. Graphene Oxide (GO)
Graphene oxide was synthesized by Hummers method Graphite flakes (2 g) and NaNO3 (2 g) were mixed in 50 mL of H2SO4 (98%) in a 1000 mL volumetric flask kept under at ice bath (0˚C - 5˚C) with continuous stirring. The mixture was stirred for 2 hrs at this temperature and potassium permanganate (6 g) was added to the suspension very slowly. The rate of addition was carefully controlled to keep the reaction temperature lower than 15˚C. The ice bath was then removed, and the mixture was stirred at 35˚C until it became pasty brownish and kept under stirring for one days. It is then diluted with slow addition of 100 ml water. The reaction temperature was rapidly increased to 98˚C with effervescence, and the color changed to brown color, Further this solution was diluted by adding additional 200 ml of water stirred continuously for purification. The solution is finally treated with 10 ml H2O2 to terminate the reaction by appearance of yellow color, the mixture was washed by rinsing and centrifugation with 10% HCl and then deionized (DI) water several times After filtration and drying under vacuum at room temperature (Scheme (1-1)) [11] [12] [13] .
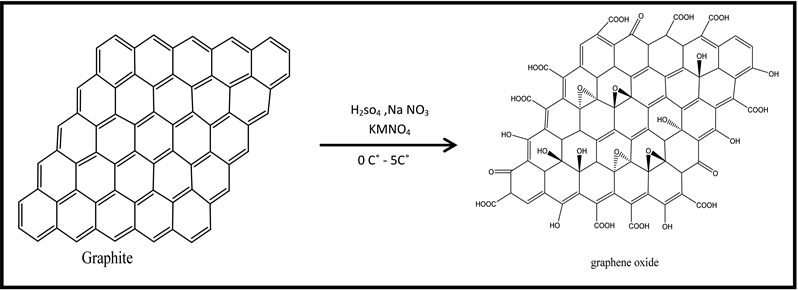
Scheme (1-1). Chemical equation of preparation of GO.
2.2.2. 2-Amino Ethanol and Graphene Oxide Functionalized (GON)
The functionalize GO, (0.5 g) was placed in a (250 mL) dried beaker with (100 mL) DMF and amino ethanol 6.17 mL, 10 mmole) sonicated for 1 h to form homogeneous solution, then added DCC (2.06 g, 10 mmole), DMAP (1.22 g, 10 mmole) into mixture with stir 24 h at room temperature, after the reaction finish, the product was filter, then black powder was dried [14] the preparation process of (GON) is shown in Scheme (2-2).
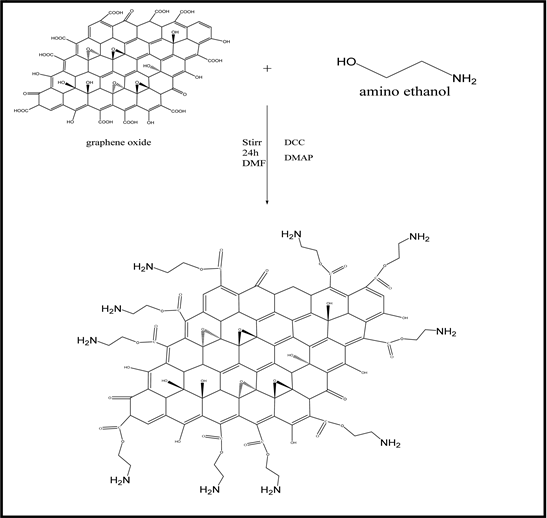
Scheme (2-2). Chemical equation of preparation (GON).
2.2.3. 2-Mercapto Ethanol and Graphene Oxide Functionalized (GOS)
The functionalize GO, (0.5 g) was placed in a (250 mL) dried beaker with (100 mL) DMF and amino ethanol (0.86 mL, 10 mmole) sonicated for 1 h to form homogeneous solution, then added DCC (2.06 g, 10 mmole), DMAP (1.22 g, 10 mmole) into mixture with stir 24 h at room temperature, after the reaction finish, the product was filter, then black powder was dried [14] . The preparation process of (GOS) is shown in Scheme (2-3).
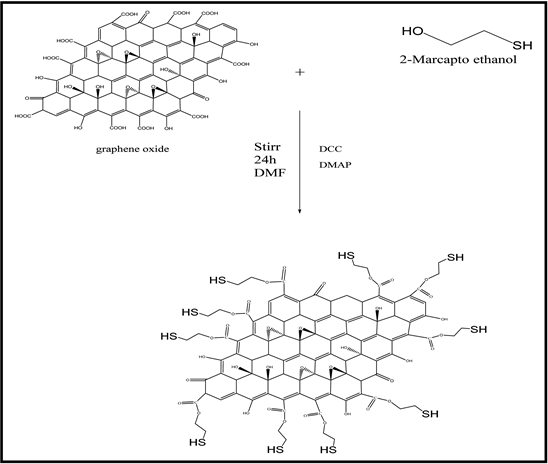
Scheme (2-3). Chemical equation of preparation (GOS).
2.2.4. Electrochemical Measurements
The electrochemical measurements were performed using a potentiostat/galvanostat (ACM) connected to a computer. A three electrode cell assembly, consisting of a C-steel rod embedded in araldite as the working electrode (WE), and a saturated calomel electrode as the reference electrode (RE), aplatinum sheet as the counter electrode (CE), was used for the electrochemical measurements. The temperature of the electrolyte was maintained at the required temperature using a water bath. Before immersion in the test solutions, the WE was polished with a polishing machine using emery paper from 600 to 1200 grade until a mirror image was obtained. Then, the WE was washed with distilled water thenimmersed in acetone for 1Minute in an ultrasonic cleaner. The WE electrode was prepared directly before electrochemical measurements then immersed in the test solution at open circuit potential for one hour until a steady state potential was obtained polarization measurements were performed. All experiments were performed in aerated solutions. From the polarization data, were calculated like the degree of surface coverage (θ), the percent tage inhibition efficiency (% IE), corrosion rate and charge transfer resistance [15] .
3. Results and Discussion
3.1. FTIR Spectroscopy Analysis of GO, GON and GOS
FTIR analysis was used to identify functional groups present in the GO, GON1 and GOS1. Figures 1(a)-(c) shows the FTIR spectrum of, GO, GON1 and GOS1 powders respectively, the GO spectrum shows the peak at 3386.39 cm−1 due to O-H stretching vibration, 1724.36 cm−1 was strong C=O stretching band, and peak at 16,228 cm−1, 1378.85 cm−1 can be attributed to C=C stretching of aromatic ring, C-OH bending respectively, the charactestic peak at 1029.8 cm−1 due to C-O epoxy group [16] (Figure 1(b)). In the spectrum of GON the peak at 3434.6 cm−1 for stretching OH groups. The presence of absorption bands at 3334, 3222 cm−1 (-NH2) stretching vibration, the peaks 2956, 2823 cm−1 assigned to the asymmetric and symmetric stretching of C-H bands, 1639.2 cm−1 due to C=O aster stretching vibration, the peak at 1559.17, 1122,37 cm−1 attributed to C=C aromatic ring, and C-N stretching, also 1029.8 cm−1 due to C-O epoxy group, the peak at 797.421 cm−1 due to aromatic C-H bending [17] (Figure 1(c)), GOS the peak at 3427.85 cm−1 for stretching OH groups. The peaks 2998, 2898 cm−1 assigned to the asymmetric and symmetric stretching of -CH2 bands, also S-H band at 2550 cm1, 1648.84 cm−1 due to C=O aster stretching vibration, the peak at 1559.77 is attributed to C=C aromatic ring, a, also 1113.69, 1024.02, 620.966 cm−1 due to C-O, epoxy, C-S bending [17] .
![]() (a)
(a)![]() (b)
(b)![]() (c)
(c)
Figure 1. FTIR spectrum of (a) GO powder; (b) GON powder; (c) GOS powder.
3.2. X-Ray Diffraction (XDR) of GO, GON and GOS
In Figure 2(a) the X-Ray Diffraction (XRD) of grapheme oxide shows a large interlayer spacing equal to 8.06 A˚ at the position (2θ = 10.97˚) disappearance of the peak at 26˚ due to completely oxidized after the chemical oxidation and exfoliation [13] (Figure 2(b)), GON shows many peaks appear (2θ = 10.97) at d-spacing 8.06 indicate to graphene oxide and other peaks 2θ = 34.05, 38.80, 54, 72, 55.35, 58.43, 62.15, 65.24, 67.64, 71.28, 72.55 and 73.03 have to d-spacing 2.63, 2.32, 1.67, 1.65, 1.57, 1.49, 1.43, 1.38. 1.30 and 1.29, respectively attributed to functionalized ethanol amine at graphene oxide also intermediate layer [17] , (Figure 2(c)) of GOS show many peaks appear (2θ = 10.97) at d-spacing 8.06 indicate to graphene oxide and other peaks 2θ = 32.31, 34.05, 38.80, 40.94, 47.47, 48.96, 49, 61, 50.85, 55.47, 59.61, 62.08, 65.29 and 67.63 have to d-spacing 2.77, 2.63, 2.32, 2.20, 1.91, 1.66, 1.83, 1.79. 1.60, 1.55, 1.49, 1.42 and 1.38, respectively attributed to functionalized 2-marcapto ethanol at graphene oxide also intermediate layer [17] .
The Diffraction patterns of X-ray to prepared organic compound particles size is calculated using (Debye-Scherer) Equation [18]
(1)
![]() (a)
(a)![]() (b)
(b)![]() (c)
(c)
Figure 2. XRD OF (a) GO, (b) GON, (c) GOS.
where; D: Particles size, λ: X-ray wave length (nm), β: Half width at half maximum (HWHM), K: is s related hape factor, normally taken as 0.9. θ is x-ray angle. From this equation the particle size of grapheme oxide (GO) (16 nm) but to calculated average particle size to prepared organic compounds GON (35.7 nm), GOS (36.11 nm), Also calculatedparticles size using (Williamson-Hall) (W-H) equation [19]
(2)
where £ micro strain of particles, the calculated particles size from graphic between
on x-axis,
on y-axis, D calculated by intercept (Kλ/D), Figure 3(a), from this equation particles size of GON (17.74 nm), micro strain (−0.00195), (b) GOS (14.26 nm) micro strain (−0.00246).
3.3. Field Emission Scanning Electron Microscopy (FESEM)
The FESEM of graphene oxide (GO) very sharp edges and flat surface the dark gray areas consist of several layers of sheets also kinked and wrinkled areas [13] , shown in Figure 4(a) but GON observed very thin (3.07 nm) and re-stacked sheets (Figure 4(b)), GOSthe re-stacked layers and crumpling, kinked and wrinkled areas [20] [21] (Figure 4(c)).
3.4. Electrochemical Measurements
3.4.1. Polarization Measurements (Tafel Method)
Typical potentiodynamic polarization curves for the C-steel in 1M HCl in the presence and absence of different concentrations of GO, GON, GOS are shown in (Figures 5-16). The respective Tafel parameters, inhibition efficiency (% IE), Icorr corrosion current, corrosion rate and charge transfer resistance are provided in Tables 1-3. It is clear that the shapes of the Tafel plots for the inhibited electrodes are different from those of uninhibited electrodes. The presence of the inhibitor decreases the current density but does not change other aspects of the behavior.
![]() (a)
(a)![]() (b)
(b)
Figure 3. Scheme Williamson-Hall to (a) GON, (b) GOS.
![]()
![]()
![]() (a) (b) (c)
(a) (b) (c)
Figure 4. FESEM OF (a) GO, (b) GON, (c) GOS.
![]()
Figure 5. Tafel Plot of GOt concentration (1 - 6 ppm) on C-steel alloy in 298 k.
![]()
Figure 6. Tafel Plot of GO concentration (1 - 6 ppm) on C-steel alloy in 308 k.
![]()
Figure 7. Tafel Plot of GO concentration (1 - 6 ppm) on C-steel alloy in 318 k.
![]()
Figure 8. Tafel Plot of GO concentration (1 - 6 ppm) on C-steel alloy in 328 k.
![]()
Figure 9. Tafel Plot of GON concentration (1 - 6 ppm) on C-steel alloy in 298 k.
![]()
Figure 10. Tafel Plot of GON concentration (1 - 6 ppm) on C-steel alloy in 308 k.
![]()
Figure 11. Tafel Plot of GON concentration (1 - 6 ppm) on C-steel alloy in 318 k.
![]()
Figure 12. Tafel Plot of GON concentration (1 - 6 ppm) on C-steel alloy in 328 k.
![]()
Figure 13. Tafel Plot of GOS concentration (1 - 6 ppm) on C-steel alloy in 298 k.
![]()
Figure 14. Tafel Plot of GOS concentration (1 - 6 ppm) on C-steel alloy in 308 k.
![]()
Figure 15. Tafel Plot of GOS concentration (1 - 6 ppm) on C-steel alloy in 318 k.
![]()
Figure 16. Tafel Plot of GOS concentration (1 - 6 ppm) on C-steel alloy in 328 k.
![]()
Table 1. Tafel parameters for C-steel 1M HCl in the absence and presence of different concentrations of GO at different Temp.
![]()
![]()
Table 2. Tafel parameters for C-steel 1M HCl in the absence and presence of different concentrations of GON at different Temp.
![]()
![]()
Table 3. Tafel parameters for C-steel 1M HCl in the absence and presence of different concentrations of GOS at different Temp.
It is evident from Tables 1-3 from Ecorr at constant temperature compared with Ecorr to blank at 298 K for graphene oxide (GO) the Ecorr decrease at all concentration compared with Ecorr to blank that value (−474 mv) but this decreasing less to (89 mv) so inhibitor behavior it mix inhibitor, as observed from previous studies [22] [23] [24] , if the difference Ecorr between blank and inhibitor (89 mv) decreasing less the inhibitor is mix, also Ecorr other organic inhibitors GON, GOSdecreasing less (89 mv) compared with Ecorr blank that mean It behavesmix inhibitor at all concentration (1 - 6 ppm) and temperature (298 - 328 K). In this study used very small concentration organic inhibitors it gives high efficiency inhibitor, show graphene oxide have less efficiency inhibitor (20.13%) at (1 ppm) and (80.92%) at (6 ppm) in spite of containing carboxylic group in graphene oxide layer GON, GOS have efficiency inhibitor (67.68%, 64.39%), respectively at (1 ppm) and (96.96%, 95.79%) respectively at (6 ppm) at different temperature.
The Rct values of the inhibited are increase as the concentration of the inhibitors increases on the other hand increase in efficiency inhibitors due to productive carbon steel surface to resist polarization, and the anodic reaction the dissolution of Iron in carbon steel alloy to reduce in present inhibitors the signification that increase of Tafel (βa) [25] .
3.4.2. Effect of Temperature
The study of effect of temperature on the corrosion rate to the organic inhibtors on carbon steel alloylwere immersed in 1 M hydrochloric acid with different concentration (1 - 6 ppm) of inhibitor at temperature ranging from 298 K, 308 K, 318 K, and 328 K, the activation energy value was calculated from Arrhenius equation [26]
(3)
where: CR = corrosion rate (mpy), Ea = activation energy (KJ/mol);
A = frequency factor, R= molar gas constant (8.3143 J・K−1・mol−1);
T = temperature (K).
Figure 17, Figure 18, Figure 19 show good relationship between (ln CR) vs (1/T K−1) for without and with inhibitors organic compound in 1M HCl solution, straight lines were obtained with slope of (-Ea/R), the activation energy was calculated from slope of Arrhenius plot. the activation energy as the concentration of inhibitor increase which indicates physical adsorption [27] and it due to be corrosion reaction in which charge transfer has been blocked by the adsorption of inhibitor molecular on the carbon steel surface. The activation energy (Ea) value in the presence of corrosion inhibitors is higher than in absence of inhibitor also Ea increase with increasing concentration in inhibitors.
Enthalpy (∆H) and entropy (∆S) of activation have been calculated from the following equation
(4)
CR = corrosion rate (mpy),
= Enthalpy (KJ/mol),
= entropy (J/mol, K), R= molar gas constant (8.3143 J・K−1・mol−1), T= temperature (K), N = Avogadro number (6.022 × 10²³ mol−1); h = plank, constant (6.62 × 10⁻³⁴ J・s).
![]()
Figure 17. Adsorption isotherm plot for ln (CR) vs 1/T to the GO.
![]()
Figure 18. Adsorption isotherm plot for ln (CR) vs 1/T GON.
![]()
Figure 19. Adsorption isotherm plot for ln (CR) vs 1/T GOS.
Figure 20, Figure 21, Figure 22 are the plots of (ln CR/T) vs (1/T K−1) for carbon steel in with and without inhibitors organic compound in 1N HCl solution. Curves showed straight lines with slope (
/R) and intercept (
/R). The positive value of
reflect that the process of desorption of the inhibitors on the surface is an endothermic process (chemical adsorption) and it has been clearly observed that the value of
increasing as the concentration inhibitor increase. The entropy of activation in mentioned table clear that these values increased positively in the presence of inhibitor than in its absence. The increase of reveals that an increase in disordering takes place from reactant to the activated complex [28] (Tables 4-6).
3.4.3. Adsorption Isotherm
The adsorption isotherms provide basic information about the interaction between the inhibitor and the Carbon steel surface. In this study fit with Langmuir isotherm and the Langmuir isotherm best model to gives of value of (R2) correlation coefficient equal one or approaching one, through R2 to found Langmuir isotherm was calculated using the equation below [29]
(5)
![]()
Figure 20. Adsorption isotherm plot for (ln CR/T) vs 1/T to the GO.
![]()
Figure 21. Adsorption isotherm plot for (ln CR/T) vs 1/T GON.
![]()
Figure 22. Adsorption isotherm plot for (ln CR/T) vs 1/T GOS.
![]()
Table 4. Kinetic parameters Ea*, ΔH*, ΔG* and ΔS* for carbon steel of GO in 1M HCl at (1, 6 ppm).
![]()
Table 5. Kinetic parameters Ea*, ΔH*, ΔG* and ΔS* for carbon steel of GON in 1M HCl at (1, 6 ppm).
![]()
Table 6. Kinetic parameters Ea*, ΔH*, ΔG* and ΔS* for carbon steel of GOS in 1M HCl at (1, 6 ppm).
where surface coverage (θ) for various inhibitor concentrations, Kads the adsorptive equilibrium constant, C is the concentration of the inhibitor, the isotherms at different temperatures for different concentration of organic compound in 1M HCl, show date in Tables 7-9 and Figures 23-25.
The equilibrium constant for the adsorption process was related to the standardfree energy of adsorption by the expression [30] .
![]()
Figure 23. Langmuir s adsorption isotherm plots for the adsorption of GO at different conc. In 1N HCl on carbon steel surface.
![]()
Figure 24. Langmuir s adsorption isotherm plots for the adsorption of GON at different conc. In 1N HCl on carbon steel surface.
![]()
Figure 25. Langmuir s adsorption isotherm plots for the adsorption of GOS at different conc. In 1N HCl on carbon steel surface.
![]()
Table 7. Values of (θ/1 − θ), concentration (ppm) and R2 graphene oxide inhibiter at difference temperatures and (1, 6 ppm) concentration.
![]()
Table 8. Values of (θ/1 − θ), concentration (ppm) and R2 GON inhibiter at difference temperatures and (1 - 6 ppm) concentration.
![]()
Table 9. Values of (θ/1 − θ), concentration (ppm) and R2 GOS at difference temperatures and (1 - 6 ppm) concentration.
(6)
where R is the gas constant, T is the experiment absolute temperature, and theconstant value of 55.5 is the concentration of water in a solution in mol・L−1. The following equation can be used to calculate a thermodynamic functions [31]
(7)
The variation of
/T with 1/T gives a straight line with a slope that equals
(Figures 26-28). The
/T decreases with 1/T in a linear manner. The calculated values are shown in Tables 10-12. The adsorption heat could be approximately regarded as the standard adsorption heat under experimental conditions. The negative sign of
in 1M HCl solution indicates that the adsorption of inhibitormolecule is an exothermic process [32] . Then the standard adsorption entropy
was obtained using the thermodynamic basic equation:
(8)
![]()
Figure 26. Adsorption isotherm plot for ΔG˚/T vs 1/T of GO.
![]()
Figure 27. Adsorption isotherm plot for ΔG˚/T vs 1/T of GON.
![]()
Figure 28. Adsorption isotherm plot for ΔG˚/T vs 1/T of GOS.
![]()
Table 10. Thermodynamic parameters for the adsorption of GO in 1M HCl on carbon steel surface at different temperatures.
![]()
Table 11. Thermodynamic parameters for the adsorption of GON in 1N HCl on carbon steel surface at different temperatures.
![]()
Table 12. Thermodynamic parameters for the adsorption of GOS in 1N HCl on carbon steel surface at different temperatures.
4. Conclusion
The grapheme oxide GO, GON, and GOS act as corrosion inhibitors of carbon steel in 1M HCl solutions. The inhibition efficiency increases with increase in inhibitors concentrations and decreases with raising temperature. The adsorption of the investigated compounds follows the Langmuir’s adsorption isotherm. The investigated compounds were mixed type inhibitors. The adsorption of the investigated compound is on carbon steel surface in HCl solution. Thermodynamic studied ∆H*, ∆S*, and Ea*, indicated to activity of prepared inhibitors and Free energy of adsorption ΔG˚ads indicated to chemical-physical adsorption.