P-Wave Detection Combining Entropic Criterion and Wavelet Transform ()
1. Introduction
The analysis of the ECG is widely used for diagnosing many cardiac diseases, which are the main cause of mortality in developed countries. Since most of the clinically useful information in the ECG is found in the intervals and amplitudes defined by its significant points (characteristic wave peaks and boundaries), the development of accurate and robust methods for automatic ECG delineation is a subject of major importance, especially for the analysis of long recordings. In order to interpret the ECG and use it to diagnose abnormalities, it is important to know the normal characteristics of the ECG, and understand the mechanisms underlying the generation of each segment of the ECG.
The P wave is caused by atrial depolarization. The duration is normally not greater than 120 ms. The normal shape of the P wave does not include any notches or peaks. It can be positive, negative, or biphasic in the remaining leads. An absent P wave in the ECG may signify sinoatrial block [1] . Some researchers present some P wave detection method based on wavelet transform [2] . Wavelet analysis provides important information about the mathematical morphology of a signal. Using this method, it is possible to describe the characteristic elements of a complex quasi-periodic signal. But P wave’s amplitude is much smaller than other waves, so the accuracy of detection is limited.
We present here a new method for P wave’s location combines entropic criterion and wavelets transform (ECWT). We are interested in entropy as a measure of the amount of information contained in a signal. The amount of information can also be interpreted as the unpredictability of events in a signal. More events are unpredictable, the more information it contains is important and its entropy is high. This measure is favorable to the segmentation or an unpredictable event will be proportional to the increase in entropy. The entropic criterion can indicate the maximum of P wave’s energy.
The wavelet transform provides a description of the signal in the time-scale domain, allowing the representation of the temporal features of a signal at different resolutions; therefore, it is a suitable tool to analyze the ECG signal, which is characterized by a cyclic occurrence of patterns with different frequency content (QRS complexes, P and T waves). Moreover, the noise and artifacts affecting the ECG signal also appear at different frequency bands, thus having different contribution at the various scales.
For the singularity detection through local maxima, we rely on the approach Mallet and Hwang [3] , using a first derivative Gaussian function as the prototype wavelet. The principle of this approach is, firstly, to use the entropy function for identifying the concentrated energy of the P wave and on the other hand to link the result with that of the modulus maxima allowing an exact location.
The paper is organized as follows: in Section 2, we present the theory of entropic local criterion and the notion of wavelets transforms modulus maxima. We show the detection method of P wave. Onsets and ends are performed in Section 3. Then, we interpret the results of P wave detection. The results of the validation on two databases (MIT-BIH, QT) and their comparison to other algorithms are given in Section 4. Finally, the conclusion is presented in Section 5.
2. Entropy and Wavelet Transform Modulus Maxima
This article proposes a method combining entropic criterion and Wavelet Transform Modulus Maxima to detect P wave. The two theories are introduced in the following.
2.1. Entropic Local Criterion
In the case of the representation of the signal, entropy comes to measuring the fineness and precision of the location information, location in both time and frequency. Entropy will allow us to see where the energy signal is localized in the time-frequency plane. Specifically, it will allow us to know what time-frequency representation allows the best location information in the plan. The entropy associated with a discrete scalar random variable
with X achievements  and the probability distribution
  measures its mess [4] . It is defined by:
 , with
  (1)
(1)
Since entropy operator will be applied to a channel signal , it has implicitly been norma-
lized to 1, so that:
 , where
  (2)
(2)
With X[k] the Discrete Fourier Transform DFT of x[n] for  defined for
  by:
by:
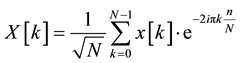 (3)
(3)
For any signal , the entropy in the sense of the energy distribution of frequencies is legi-
timate with the following definition:
 (4)
(4)
where

2.2. Wavelet Transform Modulus Maxima
Most of the information in a signal is carried by its irregular structures and its transient phenomena, called singularities. A method that excels in finding and identifying these singularities is the Wavelet Transform; because of its capability of decomposing a signal into elementary building blocks that are well localized in both time and frequency. Because of this capability, the Wavelet Transform is capable of defining the local regularity of a signal. The local regularity of a function is often measured with the Lipschitz exponents [5] , also called the Hölder exponent. We define what we mean by a local maximum of the wavelet transform modulus [3] . Let Wf(x) is the wavelet transform of a function f(x)
・ We note a local extremum any point x0 such that  has a zero crossing at x = x0, when x varies.
・ We note a modulus maximum; any point x0 such that 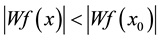 when x belongs to either a right or left neighborhood of x0, and
 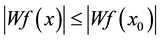 when x belongs to the other side of the neighborhood of x0.
・ We call maxima line, any connected curve in the scale space x along which all points are modulus maxima.
3. P-Wave Detection
Based on the waveform, Laurent Clavier [6] divide the different P waves encountered in five classes.
・ Class 1: the P wave has a relatively symmetrical reflecting normal patient.
・ Class 2: P wave has a normal climb, but relatively slow down.
・ Class 3: the P wave has a relatively slow rise but a normal descent.
・ Class 4: the P wave has a double hump.
・ Class 5: P wave is biphasic; usually it is a pathological wave.
3.1. P-Peak Detection
The detection algorithm of P wave is generally designed according to three steps (Figure 1).
The first is based on a preliminary localization of the QRS complex and consists in seeking, in a window preceding the QRS, a trace of the P wave. The second step is based on the research for an analysis window well adapted to the width and to the position of the P wave by means of the local entropy criterion which measures the temporal unpredictability and disorder in the frequency signals and is an index for the segmentation. As part of the segmentation, the entropy changes reflect the presence of a change in the signal. The entropy is going to help us to adopt the width of the window to that of the P wave. In this case, our research becomes more efficient and more objective. By the way, we will gain in computing time for the next step of this method. We succeed and optimization the algorithm. The third is based on the detection of the P wave by modulus maxim’s method.
3.1.1. Step 1
The ECG signal gotten at the time of the registration is contaminated generally by different sources of noises that can disrupt the phase and the amplitude characteristics of the useful signal, from where the necessity of a
![]()
Figure 1. Algorithm of P peak detection.
good filtering [7] . We apply a band pass filter [8] to eliminate the noises caused by the breathing, the movements of muscles and the baseline. This filter is constituted by the combination of a passes low filter and another passes loud. The two are based on a sampling rate of 360 Hz [9] .
In general, the normal ECG rhythm means that there is a regular rhythm and waveform. However, the ECG rhythm of the patient with arrhythmia will not be regular in certain QRS complexes. We use the different characteristics that arrhythmias exhibit to detect the abnormal ECG waveform. We first need to find the location of every QRS complex.
The locations of QRS complex have the maximum variation in the slopes. This property was used to detect the location of QRS complex. The method of Pan-Tompkins was adopted to detect the QRS complex [10] . The Pan and Tompkins QRS detection algorithm identifies the QRS complexes based upon digital analysis of slope, amplitude, and width of the ECG data. The algorithm implements a special digital band pass filter. It can reduce false detection caused by the various types of interference present in the ECG signal.
3.1.2. Step 2
The P wave is a rounded peak occurred before the QRS complex. Therefore, the P wave can be found based on the location of the QRS complex. The method consists in finding the right and better position of the analysis window (Figure 2).
The detection algorithm P-wave refers to the R peak backwards tr (tRpeak-200 ms) so as to be in advance phase by report to the QRS complex (Figure 3).
tr depends on the RR period in 5 seconds. Statistically, over a period for many patients and healthy on a recording time of one hour for each, P wave holds 10%, the QRS complex occupies 8% and the T wave occupies 20% of the RR period. The choice of the window is taken of such way as the energy in the side of lobes being as small as possible to minimize the errors in the entropy and increase the accuracy of positional. We perform the decomposition of the ECG signal for 4 levels (21, 22, 23 and 24) in which his higher energy is. For scales larger than 24, the energy of the QRS complex is very low, only the P and T waves have significant components.
The detection of the P wave is based on the variations in local entropy rather than the entropy itself. It uses the local entropy criterion. Entropic Local Criterion is a time function, measuring variations in the energy concentration of the short-term spectrum of the signal. The measurement of concentration of energy or spectral disorder is used Shannon [11] entropy (Equation (1)). Due to significant changes in this measure in the context of the one part and the position of the analyzed frequencies, we add to this extent the notion of stability. In this case, we talk about the criterion entropic local stabilized
We set the first Wi analysis window, which Li its width, from tr. For that, we calculate the normalized and localized entropy of analysis window Wi (Li) for 24 scale according to the Equation (4). The value of entropy Hi calculated through the Wi window is saved in a table.
The search for the best width of the window operates according to an iterative algorithm. In every iteration the width of the window is multiply by 2 (Li × 2) to look for the maximum of quantity of information contained in the wave P. The same steps are applied on the next analysis window Wi+1 with Li+1 = Li × 2. So, we create an increasing dyadic table for the window’s various values (Table 1).
By comparing the last two values of the found entropies, we start again calculating next entropy for the window Wi+1untilthe value of two successive entropy (Hn+1, Hn) remains constant. We retain the window Wn of Ln
![]()
Figure 2. Algorithm of positioning analysis window.
![]()
Table 1. Various values of windows.
width.
Figure 4 shows three successive analyzes of windows (W0, W1, W2, W3) showing the growth of their width. We note that the value of the entropy increases when the width of the window widens at each iteration since the
![]()
Figure 4. Successive analysis windows and theirs entropies’ values.
detection of the information is more and more centralized on the P wave.
3.1.3. Step 3
At this level of the algorithm, we have a window (Wn) adapted in width and in position to the P wave. Once the analysis window is fixed, we calculate the modulus maxima for the 24 scale to detect the position of the P peak applied to the Wn. Mainly at scales 24, P wave has its major component, whereas artifacts produce isolated maximum or minimum lines which can be easily discarded. If the signal is contaminated with high-frequency noise, the most affected scales are and, being higher scales essentially immune to this sort of noise.
Using a first derivative Gaussian function as mother wavelet due to having one zero moment. It is therefore well adapted to detect the amplitude discontinuities in the signal; it delivers more to the spread of the maximum fine scales [12] . It is defines as follows
![]() (5)
(5)
The waves produce a positive maximum-negative minimum pair along the scales, with a zero crossing between them. Each sharp change in the signal is associated to a line of maxima or minima across the scales. The passages by zero or zeros-crossings of the wavelet transform correspond in maxima premises or minima of the signal smoothed in the various scales and the maximal absolute values of the transformed it waves are associated with the maximal slopes. Using the information of local maxima, minima and zero crossings at 24 scales, the algorithm identifies the significant points P wave detection and delineation.
3.2. Onset/Offset Detection
Our detection method of P wave is also responsible for detecting Pon/Poff which is the start and end of the P waves. Our algorithm comprises two steps defined as follows (Figure 5), the beginning and the end of the P wave is determined based on the detection of Ppeak.
The onset of P wave is before the first slope of the position of P peak. In the same way, the offset of P wave is after the last slope of the position of P peak. We calculate the modulus maxima of the (first/last) slope of the P peak’s position for the 24 scale. We considered the modulus maxima calculated for the analysis window Wn already attached to the P peak search step.
4. The ECWT Method Results and Performance
The ECG signals under test of the transformations are taken from the website of MIT-BIH Arrhythmia Database [13] . The sampling frequency of the data is 360 Hz. We will discuss certain parts of signals chosen.
![]()
Figure 5. Successive analysis windows and theirs entropies’ values.
4.1. Baseline Drift
The ECWT based method only considers variations of the signal that has a certain resemblance with the P-wave. Therefore, it is insensitive to baseline drift (Figure 6).
4.2. Noise (EMG)
Most methods require frequently adapted thresholds in order to detect a low amplitude P-wave. In most cases these thresholds are used to distinguish the wave from the noise. By using scales that contain most part of the energy of the P-wave it is possible to acquire a precise detection (see Figure 7).
4.3. Low Amplitude
Most methods require frequently adapted thresholds in order to detect a low amplitude P-wave. In most cases these thresholds are used to distinguish the wave from the noise (Figure 8). By using scales that contain most part of the energy of the P-wave it is possible to acquire a precise detection.
4.4. Ambiguous Amplitude
As most methods, the ECWT method uses certain decision rules to distingue different kinds of P-waves. The difference with the other methods lies in the fact that the rules are applied to the transformation instead of to the pure signal. The transformation gives a clearer view of the signals information and therefore it is better suited for decision rules (Figure 9).
4.5. Absent Wave
In some cases, the P-wave is absent. The figure below illustrates the case where the P wave is present with an important amplitude in start of signal but absent after (Figure 10).
4.6. P-Wave Performance
The datasets are signals coming from the MIT-BIH Arrhythmia Database [13] and QT Database [14] . However not every long signal contains large amounts of useful information. When there is no change in a wave through- out the whole signal, it is not useful to analyze every peak. Therefore, only the parts which define the ECG will be discussed. The performance of the methods will be tested by using several cases with certain difficulties. The results are detailed in the table below (Table 2).
・ Number of True Positive detections (TP).
・ Number of False Positive detections (FP).
・ Number of False Negative detections (FN).
・ Percentage of detected P-waves (Se).
![]()
・ Percentage of positive predictivity (P+)
![]()
![]()
Table 2. P wave detection performance.
The detection results on the MITDB and QTDB obtained by our ECWT of P detection and other published detectors are given in Table 2. Our algorithm does not need any learning period. The proposed ECWT detection algorithm achieves very good detection performance on the two studied databases. This algorithm attains Se = 98.87% and P+ = 98.04% for the MITDB. On QTDB, our algorithm presents a positive predictivity (P+) about 99.89% and sensitivity (Se) about 99.94%.
5. Conclusions
We have presented in this paper a new method for P wave’s locations using the local entropic criterion, in order to focus on the maximum of P wave’s energy, and wavelet transform over some successive scales. The algorithm has been validated using two standards databases MIT-BIH Arrhythmia and QT, with different sampling rates and a wide diversity for P wave forms.
Our method achieves very good detection performance on the two studied databases. This algorithm attains Se = 98.87% and P+ = 98.04% for the MITDB. On QTDB, it presents a positive predictivity (P+) about 99.89% and sensitivity (Se) about 99.94%.