Effect of Different Levels of Nitrogen and Phosphorus on the Phenology and Yield of Maize Varieties ()
1. Introduction
Maize (Zea mays L.; family poaceae) is the third most important cereal crop after wheat and rice in Pakistan and mostly consumed as human food and animal feed and provides raw material for food industry. It can be grown twice a year, both for grain and fodder purposes. Its grain is valuable source of protein, fats, starch, vitamins, and minerals Muhammad [1] . According to estimation, 75% of the total production of maize is used as food by the farming community and remaining finds its way in starch manufacturing industry, poultry feed and food grain sales.
About 64% of maize is grown under irrigation in Pakistan. More than 56% of the total maize production is contributed by NWFP (KPK) which is 1715 kg∙ha−1 PARC [2] . The world leading maize growing countries are USA, Argentina, Russia, India, Brazil and China.
In Pakistan, it is grown on an area of 9.39 million hectares with annual production of 4.27 million tons and average yield 3.56 ton∙ha−1 GOP [3] . In Pakistan, national average yield of maize is extremely below as compared to other developed countries, and imbalanced supply of nutrients is considered as one of the major cause of yield reduction. Maize being an exhaustive crop requires a large quantity of nutrients during different growth periods. The intensive cropping system where nutrients are utilized in huge quantity which changes soil texture and structure alters the availability of nitrogen and phosphorus and it directly affects yield of any crop.
Nitrogen is an integral component of many compounds and associated with photosynthetic activity. It is an essential component of amino acids and related proteins. Nitrogen in essential for carbohydrates uses within plants and stimulates root and development as well as the uptake of other nutrients Khan et al. 2014 [4] . When too much nitrogen is applied, excess vegetative growth occurs, and the plant lodges with slightest wind. Crop maturity is delayed, and the plants are more susceptible to disease and insect pests. Deficiency of nitrogen results in low plant growth which reduces the grain yield, leaf area index, leaf area duration and rate of photosynthesis. It imparts dark green color to plants.
Phosphorus has many essential functions in plant life; its role in energy storage and transfer is singly the most important. Large quantity of Phosphorus is found in seed and it is considered essential for seed formation. Phosphorus is essential for inflorescence, grain formation; ripening and reproductive parts of maize plant Ibrahim and Kandil [5] . It is needed for growth, nucleus formation, photosynthesis, utilization of sugar and starch, cell division and fat and albumen formation. Phosphorus is readily translocated within the plants and it moves from older tissues to younger tissues Ali et al. [6] [7] . Phosphorus in adequate amount is necessary for earlier maturity, rapid growth and improves the quality of vegetative growth. Deficiency of phosphorus is responsible for small ears in maize due to crooked and missing rows as kernel twist Masood et al. [8] . Phosphorus alone or high quantity did not increase the yield of maize. However, the combined application of Phosphorus with nitrogen increased the yield significantly Moschler and Martens [9] .
Cultivars differ in their response to nutrient supply when planted in different geographical environments. Optimizing the NPK fertilizer doses is necessary to achieve optimal yield potential of a cultivar. The present study was therefore, carried out to evaluate the response of potentially high yielding maize cultivars maize to different rates of nitrogen and phosphorus fertilizer during autumn season under the agro climatic condition of NWFP.
2. Materials and Methods
2.1. Experimental Site and Crop Husbandry
A field study aimed at evaluating the “effect of different level of N and P on the performance of maize” was conducted at Malakabad (Gadera) Dargai Malak and Agency in summer 2008-2010. The crop was sown at seed rate of 40 kg per hectare. The experiment was laid out in Randomized Complete Block Design (RCBD) under split plot arrangement. The fertilizer treatments (0:0, 100:0, 100:50, 100:100, 150:0, 150:50, 150:100, 150:150 N:P kg∙ha−1) were kept in main plots, while three maize varieties Azam, Jalal and localwere allotted to sub plot. The plot size was kept 5 m × 4.5 m. Crop was sown at row to row distance of 75 cm having six rows per plot. Full dose of P and half dose of N were applied at the time of sowing, while the remaining half dose of N was applied with first irrigation.
2.2. Data Recorded
2.2.1. Emergence m−2
Data on emergence m
−
2 of the young seedlings was recorded in each subplot by randomly selecting 3 different places using meter rod method. The seedling were counted and averaged.
2.2.2. Days to Emergence
Data to emergence was taken at 50% emergence of the seedlings. The days were counted from sowing to emergence.
2.2.3. Days to Tasseling
Days to tasseling were recorded by counting number of days from sowing when 80% of plant developed tassels.
2.2.4. Days to Silking
Days to silking were recorded by counting number of days from sowing when 80% plants developed silks.
2.2.5. No. of Cobplant−1
Three rows harvested for grain yield were used to determine the numbers of cobs/plant.
2.2.6. Plants ha−1
Data regarding plant per hectare was recorded by counting actual number of plants per plot and then calculated for hectares.
2.2.7. Plant Height (cm)
Plant height for all the treatments in each replication were measured with the help of a measuring tape from the base to tip of the five randomly selected plants and then average plant height was calculated.
2.2.8. Grains Cob−1
The cob harvested for grain yield were used for the determination of number of grains per cob by selecting 5 cobs randomly from each subplot, dried and shelled for counting the grains per cob data.
2.2.9. Thousand Grains Weight (g)
Data regarding thousand grains weight was recorded by counting actual number of thousand grains at random and then average was weighed with an electric balance.
2.2.10. Grain Yield
Four central rows were harvested in each plot. The ears were dehusked, dried and then threshed. The total grain weight for sampled material was recorded and converted into grain yield ha−1.
2.3. Statistical Analysis
Analyses of variance were performed with all data to confirm variability of data and validity of results. The differences amongst treatments were separated using least significance difference test at 0.05 probability level.
3. Results & Discussion
3.1. Emergence m−2
Data concerning emergence m−2 as affected by varieties and N & P levels. Varieties N & P level and their combined effect had non-significant (P > 0.05) influence on emergence m−2. Minimum emergence (5 m−2) was recorded in case of local variety. Highest emergence (6 m−2) was noted from the plot with the application of (100, 50) (100, 100) and (100, 0) kg∙ha−1. Lowest emergence (5 m−2) by plot which received (150, 50) (150, 150) in case of interactive effect of variety and N:P, maximum emergence (6) m−2 was recorded from Jalal and Azam with the application of (100, 0) (100, 50) and (100, 100). Minimum emergence (5 m−2) was observed from local variety with the application of N & P (150, 50) and (150, 150) kg∙ha−1.
3.2. Days to Emergence
Statistical analysis of the data revealed that the days to emergence were not significantly (P > 0.05) affected by N & P level. Maximum number (9) of days to emergence was recorded in case of Azam, Jalal and local variety. Minimum (8) was recorded in case of Jalal. Highest number (9) of days to emergence was recorded from treatment which was applied with (0, 0) and (100, 100) N:P kg∙ha−1. The effect of N & P (150, 150) had low number of days to emergence. The combined effect of varieties and N:P level had a non-significant (P > 0.05) effect on the number of days to emergence. Reason for non-significant of N & P on days to emergence might be that seed have their own food and have no need of external food source. The results are in confirmation with those of Sahoo and Panda [10] who reported that N & P level had non-significant effect on the days to emergence.
3.3. Days to Tasseling
Statistical analysis of the data revealed that days to tasseling were non-significantly (P > 0.05) affected by N & P level. Maximum number (46) of days to tasseling was recorded in case of (Jalal). Minimum number (6) was also recorded in (Jalal) which was (43). Highest number (46) of days to tasseling was recorded from treatment which applied with (150, 150) N:P kg∙ha−1. The effect of N & P (150, 0) had low number of days to tasseling.
3.4. Days to Silking
N & P level and their combined effect had non-significant (P > 0.05) influence on days to silking. Maximum silking (57) was recorded in case of Jalal with fertilizer treatment (100, 100) N:P kg∙ha−1. Minimum silking (53) was noted from the plot having local variety with the application of (0, 0) kg∙ha−1.
3.5. Number of Cobs Plant−1
The effect of N & P on number of cobs/plant is presented in Table1 Analysis of the data indicated that N P had a significant (P > 0.05) effect on numbers of cobs/plant. The influence of N P levels showed that maximum numbers of cobs/plant (2) were produced in plots applied with (100, 100) N:P kg ha-1. Maximum numbers of cobs/plant were recorded in all three varieties Azam, Jalal and local variety with the application of N:P (100, 100). The minimum numbers of cobs/plant were recorded in local variety with the treatment (0, 0) N:P kg∙ha−1. Maximum numbers of cobs/plant at (100, 100) N:P kg∙ha−1 dose may be due to prolonged growing period. These findings are in agreement with those of Bakhtand Ghulam et al. [11] [12] who reported that numbers of cobs/plant increased with increased in nitrogen rates as compared to control and other treatments. The interaction was found non-significant. All three varieties respond positively to (100, 100) N:P kg∙ha−1 and produced more cobs/plant as compared to lower dose of N & P. This may be due to maximum photosynthetic activity and carbohydrates use within plant that stimulated root growth and development as well as the uptake of other nutrients.
3.6. Grains Cob−1
The statistical analysis of the data revealed that N & P level had significantly affected number of grains/cob of three maize varieties shown in Figure 1. The influence of N & P showed that maximum number of grains/cob of variety Azam (693) were obtained from plots applied with (150, 150) N:P kg∙ha−1. The minimum numbers of grains/cob (363) were obtained from the plots with the treatment (100, 50) N:P kg∙ha−1. The maximum number is due to proper availability of nitrogen fertilizer which helped the plant to utilize the nutrients with their maximum potential and hence more grains/cob was obtained. Similar results were obtained by Ghulam et al. [12] who reported that number of grains/cob increased with increased in nitrogen. As in Azam, Jalal and local variety with treatment (150, 150) N:P kg∙ha−1.

Table 1. Number of cob plant−1 of maize varieties as affected by N and P levels.
LSD value for N P = 0.09712; Mean value followed by similar letters with in column are not significant at P > 0.05 level of probability using LSD.

Figure 1. Grains cob−1 of maize varieties as affected by N and P levels.
3.7. 1000-Grain Weight
Thousand grains weight (g) of three maize varieties as affected by N & P levels are reported in Figure 2. The statistical analysis of the data revealed that N & P level had significantly affected the grains weight. Maximum grains weight of (449) g of Jalal variety was recorded in those plots treated with (150, 100) N:P kg∙ha−1.
The heaviest grains may be due to the utilization of nitrogen at the proportion, which resulted in bold and robust (healthy) seed size. The effect of phosphorous levels showed that maximum grains weight of (449) g were recorded in plots treated with (150, 100) as compared to lower doses. It may be due to greater contribution of N & P by producing healthy grains i-e well filled grains and bigger grains while minimum grains weight was obtained at lower levels (0, 0) N:P kg∙ha−1. The interaction of varieties and fertilizer from the data is also significant. Amoruwa et al. [13] reported that thousand grains weight increased with increasing nitrogen rate.
3.8. Plant (ha−1) at Harvest
The effect of N & P on plant ha−1 is presented in Figure 3. Analysis of the data indicated that N & P had a nonsignificant (P > 0.05) effect on plant∙ha−1 and also the interaction of varieties was non-significant.
3.9. Plant Height
Data concerning to plant height of three maize varieties as affected by N & P levels are reported in Figure 4. The statistical analysis of the data revealed that N & P levels had significantly affected plant height. Plant height
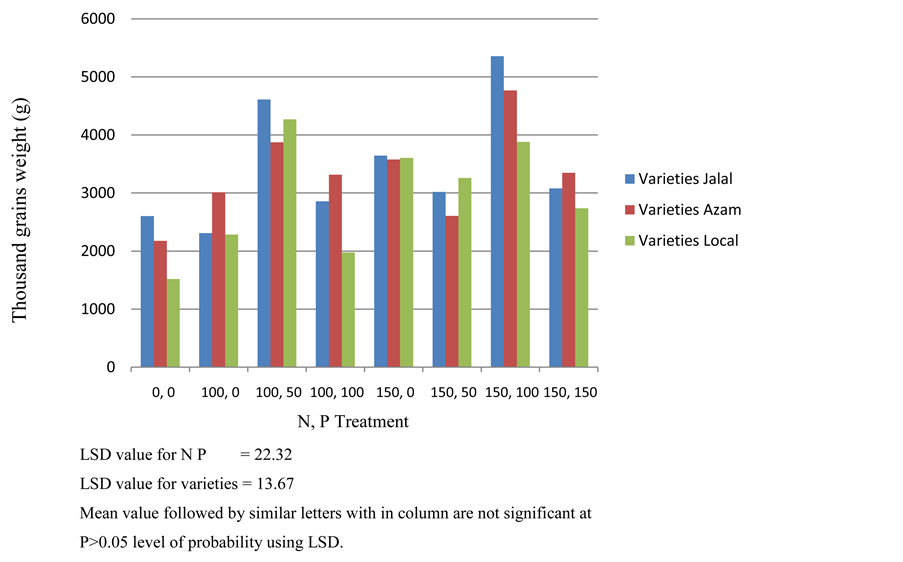
Figure 2. Thousand grains weight (g) of maize varieties as affected by N and P levels.
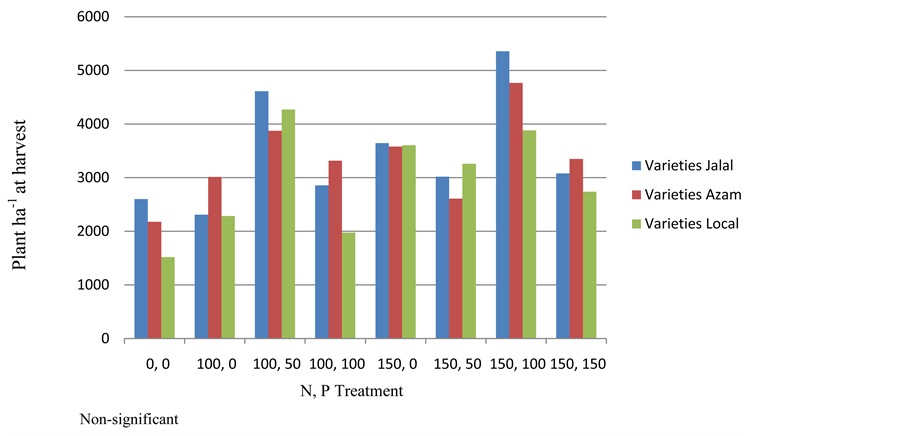
Figure 3. Plant ha−1 at harvest of maize varieties as affected by N and P levels.

Figure 4. Plant height (cm) of maize varieties as affected by N and P levels.
increased with increase in N & P rates. The influence of nitrogen level showed that tallest plant of (256) cm was attained in plots having Jalal variety applied with (150, 150) N:P kg∙ha−1. It may be due to prolonged vegetative growth which increased the plants height. These results are in agreements with those of Masood and Bakht et al. [8] [14] who reported that maize plant height increased with increase in nitrogen rates. The effect of N & P levels showed that tallest (256) cm were attained in plots applied with (150, 150). This may be due to increased root growth, which strengthened the stem against lodging during prolonged vegetative growth. These are in agreement with those of Khalil et al. [15] who reported that N & P alone or in combination increased plant height.
3.10. Grain Yield
Grain yield of three maize varieties as affected by N & P level are reported in Figure 5. The statistical data revealed that N & P level had significantly affected grain yield of three maize varieties. The interaction was also found significant. Nitrogen at higher rates gave maximum grain yield of Jalal variety (5356) kg∙ha−1 at (150, 100) N:P kg∙ha−1 as compared to lower rates. Minimum grain yield (1519) kg∙ha−1 of local variety was obtained at (0, 0) kg∙ha−1. The maximum yield may be due to the greater contribution of nitrogen for producing bold and robust grains and hence more weight. Similar results were obtained by Onasanya and Zaman Khan et al. [16] [17] who stated that grain yield increased with increase in N & P rates. Maximum grain yield at highest level of P may be due to proper nutrient availability during seed filling duration and resulted in the development of reproductive part especially in seed formation when large quantity of phosphorus is found. These results are in line with those of Khalil et al. [16] who reported that nitrogen and phosphorus alone or in combination significantly increased grain yield.
4. Conclusion
In crux, of the factors included in this study, maize cultivars and NP fertilization treatments were dominant in determining grain yield as well as its related components, suggesting that cultivar selection and optimum fertilization are effective strategies to improve grain yield. Variations were apparent in maize cultivars, and Jalal outperformed the rest of cultivars regarding all studied attributes. Among different NP application level, 150:100

Figure 5. Grain yield (kg∙ha−1) of maize varieties as affected by N and P levels.
kg∙NP\ha−1 led to better performance of maize hybrids under agro-ecological condition of NWFP, Pakistan. Future work may focus on screening/breeding of highly nutrient response cultivars. Furthermore, these results may be tested under varying soil and climatic conditions in further studies.
NOTES
*Corresponding author.