Electrostatic Separation as a Characterizing Tool for the Insulation of Conductive Mineral Particles ()
1. Introduction
Electrostatic separation can be challenging as numerous parameters can affect the efficiency of the separation. The theory is helpful in optimizing the process and is well documented [1] -[3] . Three important factors have major impacts on the final result of a separation process conducted with a drum type electrostatic separator. First, the parameters of the separator itself, such as the roll speed and the filament and electrode positions [4] play a role in the separation results. Some external parameters such as the relative humidity also have an important impact. The characteristics of the particles, such as their shape and size, are the third factor. Modifying the electrical properties of the particles can lead to improvements of the separation quality. For example, semi-conductor materials can be irradiated to become conductive, thus enhancing the result of the electrostatic separation [5] . As electrostatic properties depend on the surface conductivity of the particles, surface modifications can create an obvious change in improving separation. Preliminary surface conditioning can be performed to enhance the electrostatic effect, such as heating the particles under a reducing environment to change its surface oxidation state, and thus its electrostatic properties [6] . Surface resistivity can also be modified by immersing particles in water and by adjusting the pH [7] .
Finally, the most common way to modify the surface conductivity of the particles is to include additives that adsorb to the surface. The additives found in the literature are mainly amphiphile molecules with a polar group, such as ionic species, and a non-polar long chain [8] -[10] . Even if no convincing explanation is proposed in literature, we were able to prove, through some of our experimentations, that this kind of additive enhances the efficiency of the electrostatic separation by improving the non-conductive properties of the non-conductive particles without significantly affecting the conducting properties of the conductive particles. In other words, the non-polar chain of the amphiphile molecules acts as an insulating layer surrounding the mineral particles, but its thickness is not sufficient to significantly affect the conducting behavior of conductive particles and prevent the electrons from passing through. Non-conductive mineral particles covered with amphiphile molecules then become a bit more non-conductive while the conductivity of conductive particles covered with the same amphiphile molecules is not really modified [11] . Another original way to affect the surface conductivity of the particles is to modify the hydrophobicity of the particles prior to spraying them with an electrolyte aqueous solution. The ionic species preferably deposited on the non-hydrophobic particles makes them conductive while the hydrophobic particles that are not covered with the ionic species remain insulated [12] [13] .
With the exception of studies dealing with triboelectrification, the published works on surface modifications deal with the enhancement of the conductive properties of some minerals, or with the enhancement of their insulating properties. The challenge in electrostatic separation is in trying to separate two minerals having very little difference in conductivity between them. While it is clear that insulating particles can become conductive by simply adding ionic species to their surface, the opposite is more challenging: to make the conductive particles fully insulating. In order to take things one step further in the possibility of particle surface modifications, we worked on reversing the conductive properties of mineral particles to make non-conductive particles, completely changing their behavior in an electrostatic separator.
By working on the insulation of mineral particles, we found that criteria for depositing efficient insulating coatings over coarse mineral particles are still unclear. An electrostatic separator proves to be a useful and relevant tool in qualifying the insulating capabilities of different coating formulations, revealed by the change in the distribution of the coated particles in the conductive and non-conductive fractions after the electrostatic separation. We used the distribution results from the electrostatic separations to develop efficient insulating coatings and identify the key parameters that control the properties, as for example, the average thickness.
Insulating conductive particles to improve an electrostatic separation process makes sense only if the insulation procedure is selective. Selectivity is not the purpose of this paper, but selective coatings should be developed further based on the insulating parameters identified in this paper.
2. Preliminary Work
While the principle in insulating materials is quite simple, it becomes more of a challenge when the material is in granule form and when you are looking for a simple, cheap, reproducible and recoverable method to uniformly coat mineral particles with a significant thickness of insulating layer. We rapidly found that covering particles with insulating material such as oil or wax is not enough to shield the electrical conductivity of the particles and change their behavior in an electrostatic separator [11] . It appears that the maximum thickness available for such insulating layers is not sufficient to render the conductive mineral particles fully insulating. Because increasing the insulating thickness is limited when only oil or wax is used, we replaced the layer formulation with a composite approach. It is well known that composite material can have competitive insulating properties compared to non-composite material if the components are properly selected [14] [15] . The idea behind the composite formulation is that the size of the inorganic component will act, to some extent, as a kind of jig for the thickness of the coating. The question then is: What is the required thickness of the coating to completely insulate conducting mineral particles? The answer to this question is not trivial and is the object of this paper. A first approximation of this component is given by the required thickness for the insulating polymer layer surrounding high tension cable [16] . The information given in this reference allowed us to estimate an approximate required thickness in the range of several dozen microns for conducting particles 100 to 1000 µm in size. It therefore becomes obvious that making a coating of several dozen microns on particles requires a process using inorganic components in the micron range in size to significantly increase the thickness of the coating formulated with an organic binder and inorganic filler.
To carry out this study, our different coating formulations used a combination of viscous mineral oils and talc. Both components are highly hydrophobic and, consequently, highly insulating. It is important to use oil with a high enough viscosity to strengthen the composite coating. We demonstrated that low viscous oils do not lead to strong enough coatings while wax leads to better insulating coatings than viscous oil [11] . Nevertheless, we preferred to work with viscous oil because the coating process is straightforward and the covering around the mineral particles is more uniform while wax requires more precautions to reach the same quality of coating. Moreover, our goal is to find a simple way to change the electrostatic properties of conducting mineral particles, at low cost and with good recovery potential.
3. Experimental
3.1. Materials
The hematite particles used are classified according to five different size ranges: from 100 to 355 µm, from 355 to 600 µm, from 600 to 850 µm, from 850 to 1180 µm and from 1180 to 1410 µm. The appropriate sieves are used to obtain the corresponding size grades. The hematite density used for calculation is 5 g/cc. Ilmenite particles used range from 850 to 1180 µm. Both hematite and ilmenite are commercial grade, issued from spiral concentration of natural minerals coming from mines located in the north of Québec, Canada.
Also, one type of talc used is BT-2210 from IMIFABI with a density of 2.8 g/cc. Its size distribution is defined by its D50 and D98 values that are obtained by sedimentation at 8.5 µm and 25 µm respectively. The other talc used is Luzenac HART84 from IMERYS. It has D50 and D95 values at 2.0 µm and 11.3 µm respectively. The talc data is provided by the suppliers. The two types of talc are identified in the text as “talc 8 µm” for the IMIFABI talc and “talc 2 µm” for the IMERYS talc, referring to their D50 value.
Many types of oils were tested during the experiments. However, the oil we selected was Hydrobrite HV from Sonnenborn. According to the supplier, its density is valued at 0.875 g/cc. Its kinematic viscosity is measured at 615 cSt at 26˚C using a Koehler Ubbelohde viscometer (KV 3000 series from Koehler).
3.2. Preparation of Insulating Coatings
The desired amount of oil is added to the mineral particles and the combination is uniformly stirred in a glass beaker. A corresponding amount of talc is then added to the mix. Mechanical stirring is maintained for 2 - 3 minutes in order to obtain a uniform deposition of talc on the particle surfaces. Coated particles are then sifted using a 500 µm sieve to remove the excess talc.
An optical microscope (Zoom 2000 from Leica) and a digital camera (Kodak, Easyshare C182) are used to take pictures of particles at 45× magnification.
3.3. Electrostatic Separator
The relative room humidity (RH) is conscientiously verified for each test as previous studies have shown high sensitivity of the electrostatic separation to relative humidity higher than 50% [11] . All our valid separation experiments were carried out at 40% ± 2% RH.
The electrostatic separator (ES-14-01S model from Eriez) is mounted in a high tension roll separator version. A picture of the separator including the main adjustable components is shown in Figure 1.
Its parameters have been studied in a previous work with the goal of maximizing the weight of 850 - 1180 µm hematite particles collected in the “conductive” pan [11] . As a result, the drum rotates at 30 rpm which is the minimum value available on the equipment. The rotation speed is set to the minimum in order to minimize the spinning effect due to the velocity at the roll edge. The tension and the distance between the ionizing electrode and the drum are interrelated and we found that a combination of 20 kV with 3.5 cm for, respectively, the tension and the distance of the electrode from the roll edge, gives the highest amount of “conductive” fraction of 850 - 1180 µm hematite without the occurrence of sparks during the electrostatic separation process. With 20 kV, the ionizing electrode must be positioned at least 8.5 cm from the feeder lip which is the minimum distance available to allow all particles to fall freely onto the rotating drum, including the most insulated ones, i.e. the hematite particles having a thick coating of oil and talc. Decreasing the distance between the feeder lip and the ionizing electrode will lead the repulsive strengths to prevent some of the insulated particles from entering the electrostatic separation process by not falling freely onto the rotating drum. A distance of more than 8.5 cm is enough for the ionizing process to become effective once the particles had already fallen onto the rotating drum, i.e. when the particles are closer to the ionizing electrode. The influence of the lifting electrode has been evaluated and it appears that connecting the lifting electrode improves the weight of 850 - 1180 µm hematite fallen into the “conductive” pan. The path of both particles is slightly improved; the conductive particles being lifted away from the drum surface and the insulated particles adhering more to the drum surface. It has been found that positioning the lifting electrode vertically at 60 degrees and at 3.5 cm from the roll surface gives maximum lifting and sticking effect for, respectively, conductive particles and insulated ones.
Three collecting pans, identified as “conductive”, “mixed” and “non-conductive” fractions (named “C”, “M” and “NC” respectively on graphs), are positioned below the roll and two splitters are adjusted to improve the separation efficiency and preferably point the conductive and the non-conductive materials to their respective pans. The first splitter, which separates the “non-conductive” and the “mixed” fractions, is positioned vertically to the rotation axis at 2 cm from the roll surface. The second splitter, which separates the “mixed” and the “conductive” fractions, is positioned 2.5 cm below the horizontal position of the rotation axis and at 3 cm from the roll surface. The quality of the separation is evaluated by weighing each fraction and calculating its respective percentage based on the initial weight. Weight loss during the experiment is usually negligible, i.e. below 1% of the initial weight of the material to be separated. The accuracy of the electrostatic separation has been experimentally estimated at around 5 wt%. This means that a difference of less than 5% in weight for one pan (“conductive”, “mixed” or “non-conductive”) is not significant as the same material being passed several times through the electrostatic separator, using the same conditions, can give separation results varying from 0 to 5 wt%. So, for discussion purposes, a change in the separation results must be higher than 5% to be considered significant.

Figure 1. Picture of the drum type electrostatic separator used for the experiments.
For this work, as described earlier, all the parameters of the electrostatic separator are kept at the same value no matter which particles or coating formulations are used. This approach is important in order to isolate coating effects which become the principle variable in the series of experiments presented in this paper. In order to focus on the coating formulation and its own parameters in the insulating procedure of mineral particles, we deliberately did not vary the separation parameters that could otherwise lead to better separation results.
4. Results and Discussion
4.1. Evaluation of the Coating Thickness
In order to identify an efficient formulation for the insulating coating on hematite particles, a quasi-systematic approach is used with the mineral viscous oil (Hydrobrite HV) and talc powder. Preliminary observations show that hematite is being completely covered with approximately 0.2% weight of oil versus weight of hematite, and that adding more than 15% weight of talc versus weight of hematite and oil significantly increases the talc loss. Indeed, the excess of talc does not stick to the hematite particles. Adding more talc can also lead to the formation of talc/oil aggregates when the amount of oil is considerable. The aggregates being non-conductive, this then causes inaccuracy in the weight of the non-conductive coated hematite in the electrostatic separation process and in the calculation of the weight used for coating, biasing the final results. That being said, based on the initial weight of hematite, the weight ratios of oil and hematite used are 0.2%, 0.5%, 1.0% and 2.0%, and, for each of them, based on the total weight of oil and hematite, the weight ratios of talc on hematite plus oil used are 2%, 5%, 10% and 15%, and even 20% and 25% for some of them. The different sample formulations are summarized in Table 1 with the corresponding ID.

Table 1. Coating formulations based on Hydrobrite as oil and 8 µm talc, used with hematite particles (850 - 1180 µm).
To make a cohesive coating enclosing the hematite particles, the amount of oil and talc are interrelated as talc can absorb a certain amount of oil, but only a small amount of oil can moisten the mineral particles. An excess of talc compared to the amount of oil will result in some talc not adhering to the hematite particles, while an excess of oil compared to the amount of talc will result in some oil not playing its role in making the talc adhere to the hematite particles. For some of the ratios used, the quantities of the two components are clearly not appropriate. For example, when the amount of oil is low, as is the case for the 0.2% oil/hematite samples (A to D samples), only a small amount of talc can be added. Indeed, the excess talc is not strongly attached to the coating and is lost during the sieving. Loss of coating materials is considered significant when it is higher than 10 wt%, (see Table 1). When too much oil is used, the talc is being completely soaked with oil and coatings appear transparent instead of white, i.e. coatings take on the color of oil instead of the color of talc. In other words, the oil does not play its role in cementing the talc particles together. The coating looks more like a fluid having solid particles in it than moistened solid particles sticking together because they are competing to adsorb the fluid. For example, in Table 1, samples M and N are prepared with too much oil compared to the amount of talc used, and give 6% and 5% of material loss respectively due to the excess oil compared to the amount of talc.
Beyond the consideration of the coating preparation, the efficiency of the different formulations must be studied from the electrostatic point of view. For each sample, we calculated the final weight of the coating after loss (oil and talc) and, with the weight of the original particles, we obtained the weight ratio between the coating and the original particles. All the samples in Table 1 were passed through the electrostatic separator under similar conditions. The conductive fraction was weighed and compared to the weight of the two other fractions (nonconductive and mixed). Figure 2 summarized the results, expressing the relative importance of the conductive fraction for the coated particles as a function of the weight ratio of coating and original particles.
Figure 2 confirms that the efficiency of the insulating coating, which is inversely proportional to the weight of the conductive fraction, increases with the weight of the coating. The insulating coating can be so efficient that less than 2% of the coated particles fall into the conductive pan, while 98% of the original particles were initially falling into it. To some extent, the results of the electrostatic separation can be foreseen using the visual aspect of the coated particles. That aspect can easily be evaluated visually thanks to the white color of the talc particles that contrasts with the black color of the hematite. Some pictures shown in Figure 2 demonstrate that the hematite particles gradually become whiter as the quantity of talc increases, i.e. the coating covers more and more surface and becomes thicker as the relative weight of the conductive fraction decreases to close to 0%. This observation confirms the importance of the coating quality, in terms of uniformity and thickness, in obtaining an efficient insulating layer on the conductive mineral particles.
At this point, it is important to mention that the weight ratio between the coating materials and the hematite particles is particularly relevant in qualifying the insulating capability of the coatings. Indeed, Figure 2 shows that the conductive fraction decreases gradually from 100% to 0% as the coating/hematite ratio increases from 0 to about 10%, making obvious the connection between the relative importance of the conductive fraction (measured in wt% with about 5% accuracy) and the coating/hematite weight ratio. Intuitively, we presume that using more coating material means also making thicker coatings assuming the surface area of the particles is the same.

Figure 2. Relation between the relative importance of the conductive fraction and the weight ratio of the coating and the hematite particles.
Correlating a weight ratio of material with the thickness of the coating is not trivial when particles have irregular shapes, non-uniform sizes and different roughness. Some approximations must be made to be able to link the amount of coating materials used with an average thickness surrounding the coarse mineral particles. Once this relation has been established, it becomes clear that the amount of coating materials, the average thickness of the coating and the electrostatic separation results are directly related.
Each experiment is performed using several different hematite particles with irregular shapes and obvious roughness. For our purposes, we must consider that all the hematite particles used are identical, of the same size and all perfectly spherical without any surface roughness. We also make the assumption that the coating surrounding these spherical and smooth particles is also uniform all over and of the same thickness. Of course, the reality is very different as the coating covering a rough surface cannot be uniform in thickness because valleys are filled first while ridges are covered last. Nevertheless, our basic principles for the model enables the measurement of an equivalent average thickness for the coating which corresponds to the thickness the coating would have if all the particles were smooth and spherical and of the same size and also if the same amount of coating material is used. An average radius of the particles for a specific particle size range is also defined by considering all the particles as spherical and smooth and using the middle of the size range as the average diameter of the particle.
To enable us to calculate the thickness of the coating, in microns, from the initial weights of the components used during the preparation, the theoretical density of the components was used to estimate the equivalent volume of each component. Based on the assumption that the mineral particles are smooth and spherical, and, consequently, the coating surrounding these particles uniform in thickness, the volume ratios between the coated and the bare mineral particles can be related to the ratio between the thickness (t) of the coating and the radius (r) of the particle because the coated particle has an average radius equivalent to (r + t).
The volume of the bare mineral particle is 4/3πr3 while the volume of the coated particle is 4/3π(r + t)3, so the volume ratio (X) between the coated and the uncoated particle is:
 (1)
(1)
or, in other words,
 (2)
(2)
The volume ratio between the coated and the uncoated particle can be calculated from the weight used for the experiments and the theoretical densities of the components in order to calculate the equivalent volume of the coating and of the particles. Indeed, the volume (v) of one component is given by:
 (3)
(3)
With w corresponding to the weight used and d corresponding to the theoretical density of the component (the density values we used are given in the experimental section).
The equivalent volume of the coating (vc) corresponds to the sum of the volume of talc (vt) and the volume of oil (vo) used, i.e.:
 (4)
(4)
With
 (5)
(5)
And
 (6)
(6)
The equivalent volume of hematite (vh) used is calculated from the weight of the hematite (wh) used and the hematite density (dh), using :
 (7)
(7)
Then, the volume ratio (X) between the coated particles (vc) and the bare hematite (vh) can be easily calculated using the weight and the density of each component by:
 (8)
(8)
or,
 (9)
(9)
or,
 (10)
(10)
Considering the mineral particles as uniform, spherical and smooth, and the coating uniform in thickness, the volume ratio between the coated particles and the bare particles is also given by Equation (2).
This equation can be manipulated to give the thickness of the coating (t) from the average radius of the mineral particles (r) and the value of X with:
 (11)
(11)
The value of X can be calculated using the experimental data for each sample in Table 1, and r is given with the average radius of the hematite particle size range used for the experiment, i.e. 850 - 1180 µm, giving r = 500 µm (size of the average particle is 1015 µm, approximately its diameter).
So, for each sample in Table 1, an equivalent thickness of the coating is calculated and the corresponding results of the electrostatic separation are summarized in Figure 3 (for the conductive fractions below 10 wt% only) as a function of the coating thickness.
It is assumed that the conductive particles become significantly non-conductive when less than 10% of them fall into the “conductive” pan of the electrostatic separator, and ultimately when less than 2% are deemed “conductive”. This percentage is also considered the margin of error related to the separator.
From Figure 3, we realize that less than 2% is reached when the equivalent thickness of the coating is higher than 30 µm, i.e. when the equivalent insulating layer is 6% to 10% of the particle average radius. We notice that making a coating thicker than 55 µm on the particles is not possible, presumably because of the weakness of the coating formulation and its low adhesion to the surface of the particle. The pictures presented in Figure 3 show that it becomes hard to link the visual quality of the coatings to their insulating properties given that, with a conductive fraction below 10%, all the coatings look the same. For the purpose of this work, we selected the coating formulation of sample Q to perform further analysis. This formulation is identified as 2/20 in reference to the
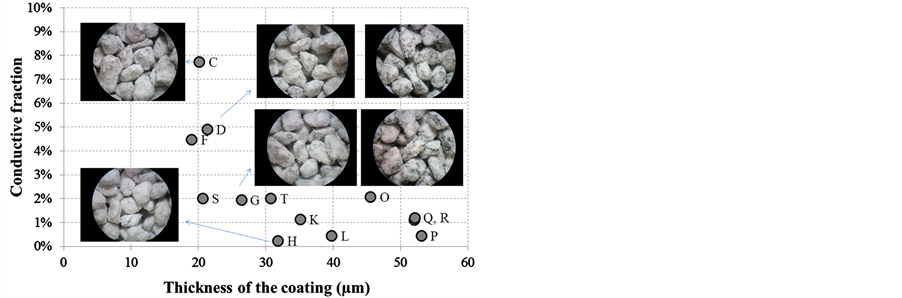
Figure 3. Relation between the relative importance of the conductive fraction and the equivalent thickness of the coating made on the hematite particles, based on spherical particles having an average 500 µm radius.
weight ratios used for the preparation: oil weight/hematite weight = 2% and talc weight/(oil + hematite) weight = 20%. With this formulation, the equivalent coating thickness is around 10% of the average radius of the hematite particle.
4.2. Influence of the Mineral Particle Size on the Coating Thickness
We suspected that a small particle cannot support a thick coating, especially when said particle is quite fragile. The question to answer is then, what is the impact on the insulating properties of the 2/20 coating and on its thickness when the size of the hematite particle decreases. In order to identify a possible connection between the thickness of the coating and its insulating capabilities, with the support of the size of the particle, hematite particles of different size grades were coated with the 2/20 coating formulation. The results of the electrostatic separation for five different particle size grades, before and after coating, are summarized in Figure 4. From the black histograms in Figure 4, representing the electrostatic separation results for the uncoated particles, we note that the importance of the conductive fraction (C) decreases in favor of the non-conductive fraction (NC) when the average size of the hematite particles decreases. This observation is in accordance with the average weight of one particle that decreases from 6.6 g, 3.1 g, 1.1 g to 0.4 g for, respectively, 1180 - 1410 µm, 850 - 1180 µm, 600 - 850 µm and 355 - 600 µm size range. As hematite particles become finer and finer, they become lighter and lighter and then the centrifugal effect rapidly decreases which is reflected, during the separation process, by a change in the distribution of the particles in the three collecting pans in favor of the non-conductive pan and to the detriment of the conductive one. At this point, it is important to keep in mind, as described in the experimental section, that the electrostatic separator parameters are deliberately kept constant while they are optimized for the 850 - 1180 µm size range. Better separation results would have been obtained for finer hematite particles by adjusting the parameters, but the only acceptable variable for these experiments was the coating itself or, in this case, the average hematite particle size.
The observation made on the bare hematite particles is also expressed in the electrostatic separation results of the coated particles. As seen in Figure 4, with the white histograms, the distribution of the coated particles in the three collecting pans is in favor of the non-conductive pan and to the detriment of the conductive pan as the size of the mineral particles decreases. In this case, the insulating coating surrounding the small and light hematite particles helps the coated particles stick better to the rotating drum while this “sticking” effect is reduced for heavy particles due to the weight counterpart.
Using the same calculations as in the previous section, an equivalent coating thickness can be obtained for each particle size range, considering a specific average particle radius for each grade. The results are presented in Figure 5, with the corresponding conductive fraction before and after coating. The histograms in Figure 5 better reflect the effect of the coating on the conductive fraction (principal Y axis) while the line in Figure 5 shows a very good correlation between the thickness of the coating and the average size of the hematite particles (secondary Y axis). The coating thickness is about 10 µm for 230 µm particles (100 - 355 µm range) and about 60 µm for 1300 µm particles (1180 - 1400 µm range). The slope of the regression line is equivalent to 9.5% of the particle’s average radius. Then, whatever the size of the mineral particles (in the 100 - 1400 µm range), a 2/20 formulation coating results in an efficient insulating layer, having an average thickness equivalent to about 9.5% of the average radius of the mineral particles.

Figure 4. Electrostatic separation results for hematite particles of different sizes, before and after coating with Hydrobrite oil and talc (2/20 formulation).

Figure 5. Conductive fractions before and after coating of hematite particles having different sizes, and corresponding equivalent coating thickness (second Y axis).
The visual aspects of the coatings are presented in Figure 6.
For the hematite particles ranging from 600 µm to 1400 µm in size, the coatings look uniform. For 355 - 600 µm particles, on the corresponding picture in Figure 6, we note that the coating is less uniform and the situation is even worse for 100 - 355 µm particles. Nevertheless, the insulating properties of these bad coatings are still very satisfactory, suggesting that the visual aspect becomes secondary as the particles decrease in size. At this point, we suspect the talc particle of being too big for the smaller hematite’s grade, affecting the coating quality. In order to improve it, finer-grained talc could be used. The size of the inorganic component of the coating is also considered while studying its influence on the insulating properties of the coating.
4.3. Influence of the Size of the Inorganic Component on the Insulating Quality of the Coating
We presume that the size of the inorganic component is directly related, to some extent, to the thickness of the coating. Using finer-grained talc for the coating should give thinner insulating coating, and thus could affect its efficiency in terms of electrostatic properties. The first observation we make with finer talc (D50 is 2 µm instead of 8 µm) is that losses during the preparation are greater, forcing us to optimize the formulation for the 2 µm talc. Table 2 summarizes data of 850 - 1180 µm hematite particles coated with 2/20 and 2/10 formulations using 8 µm and 2 µm talc.
The first important observation we are able to make, is that the 8 µm talc tends to round off the original particles while the original morphology of the particle coated with the 2 µm talc is more obvious. Then, the thickness of the coating is reduced with the 2 µm talc compared to the 8 µm one. The equivalent thicknesses given in Table 2 confirm this observation even if the difference is not as high as expected, only around 10 to 15 µm. At this point, it is important to remember that the equivalent thickness is calculated using the weight of each component, including weight lost during the procedure. So, the 5 µm increase in thickness, observed between the 2/20 and the 2/10 formulation using 2 µm talc, is only due to a lower material loss, which improved from 63% to 19% compared to the initial coating components. The ratio between the equivalent thickness of the coating and the average radius of the mineral particle (t/r) is 10% for the 2/20 formulation with 8 µm talc and 8% for the 2/10 formulation with 2 µm talc. The three coatings in Table 2 have a nice visual aspect and their insulating capabilities are also confirmed by the electrostatic separation. The corresponding results are presented in Figure 7.
From the histograms in Figure 7, a direct link can be observed between the thickness of the coating, which reaches its maximum with the 8 µm talc (51 µm), and its insulating properties, which is also at a maximum with the 8 µm talc (more than 65% of weight in the non-conductive fraction (NC)). The difference in insulating properties between the 2/20 and 2/10 formulations with 2 µm talc is not significant, with a 50% - 55% of weight fraction in the NC pan. However, the difference between the 2 µm talc and the 8 µm talc is significant, and so we can conclude that the 8 µm talc is slightly better for making insulating coatings than the 2 µm talc, probably because it produces a thicker layer than the 2 µm talc.
Because the use of finer talc affects the insulating quality of the coating, we used the 2 µm talc to coat the

Figure 6. Pictures (optical microscope 45×) of 2/20 coatings on different size ranges of hematite particles.
Table 2. Comparison of 2/20 and 1/20 coatings using 8 µm and 2 µm talc on hematite particles (850 - 1180 µm).

Figure 7. Comparison of the electrostatic separation for hematite particles (850 - 1180 µm) coated with 8 µm and 2 µm talc following 2/20 or 2/10 formulations.
small hematite particles, thus expecting to improve the quality of the coating, and possibly enhance the electrostatic separation at the same time. Hematite particles of 100 - 355 µm and 355 - 600 µm are coated with a 2/10 formulation using 2 µm talc and compared to 2/20 coating made with 8 µm talc. The data is summarized in Table 3 and Table 4 for 100 - 355 µm grade and 355 - 600 µm respectively.
The pictures and data in Table 3 show that no significant improvement is achieved by using finer-grained talc compared to the use of 8 µm talc. Coatings look very similar and the calculated thickness is also very comparable, even though slightly thinner with 2 µm talc. The coating thickness to particle radius ratios (t/r) are surprisingly exactly the same as the ones obtained previously with 850 - 1180 µm particles (Table 2), at 10% and 8% for, respectively, the 2/20 formulation with 8 µm talc and the 2/10 formulation with 2 µm talc.
Pictures in Table 4 show that the 2 µm talc coating looks better on 355 - 600 µm hematite particles than the 8 µm talc one. Particles are more uniformly coated with finer talc, but the equivalent thickness is slightly lower by 5 µm compared to 8 µm talc coating. Again, the thickness in radius ratio (t/r) is exactly 10% when 8 µm talc is used and 8% when 2 µm talc is used. This observation confirms that the t/r ratio does not depend on the hematite particle size, as we already concluded in Figure 5. However, the t/r ratio relies on the talc size, decreasing when talc size decreases. Thus, the size of the inorganic component of the coating can act, to some extent, as a jig for the coating thickness.
However, the difference between the equivalent thickness of the coating made with 2 µm talc and the one made with 8 µm talc is quite minor but varies with the size of the hematite particles. For example, the difference is 10 µm for 850 - 1180 µm particles, 5 µm for 355 - 600 µm particles and 3 µm for 100 - 355 µm particles. We confirm that such small differences cause no significant improvement in the electrostatic separation as demonstrated by the histograms in Figure 8.
In Figure 8, we see that a 3 µm difference (with 100 - 355 µm particles) has definitively no effect on the electrostatic separation while a 5 µm difference (with 355 - 600 µm particles) presents a non-consistent enhancement of the thinnest layer with a 10% enhancement of the non-conductive fraction for the 2 µm talc coating. This observation supports the conclusion that a 5 µm difference or lower is not enough to lead to significant improvements in the electrostatic separation. So, only an equivalent of 10 µm or more in thickness for the insulating coating can clearly improve the electrostatic separation.
In order to confirm the relation between the thickness of the coating and its insulating properties, as we previously did with 8 µm talc, and to identify the limit of the efficiency for the 2 µm talc, we prepared different coating formulations with 2 µm talc for 850 - 1180 µm hematite particles. Beforehand, we defined an optimized talc to oil ratio of 10 to 1 with 8 µm talc (2/20 formulation), and of 5 to 1 for 2 µm talc (2/10 formulation). In order to modulate the thickness of the coating without changing the talc/oil ratio, it is necessary to change the oil/hematite and the talc/oil + hematite) ratios while keeping the ([talc/(oil + hematite)]/[oil/hematite]) equal to 5. Doing so, we prepared 850 - 1180 µm hematite particles coated with oil and 2 µm talc with the following formulations: 0.4/2.0, 1/5, 2/10, 3/15. The thickness of the different coatings is calculated using the same principles as the ones presented earlier. The pictures of the coated particles and the results of the electrostatic separation, presented with the equivalent coating thickness, are summarized in Figure 9.

Figure 8. Electrostatic separation of coated hematite particles with 8 µm and 2 µm talc for 100 to 355 µm and 355 to 600 µm size range of the hematite particle grade.

Figure 9. Relation between the thickness of the coating and its insulating properties for different formulation using 2 µm talc and a constant weight ratio of [talc/(hematite + oil)]/[oil/ hematite] = 5 on hematite particles having 850 - 1180 µm size range.
Table 3. Comparison of coating using 8 µm and 2 µm talc on hematite particles (100 - 355 µm).
Table 4. Comparison of coating using 8 µm and 2 µm talc on haematite particles (355 - 600 µm).
For comparison, the 2/20 formulation is also added to the graph in Figure 9. Pictures in Figure 9 clearly show the improved quality of the coating when its equivalent in thickness increases, especially in the range covered by the formulations used, i.e. between 10 and 50 µm. This range is large enough to identify 20 µm as a too thin coating and 30 µm as an acceptable thickness for the insulating capabilities of the coating. The minimum t/r ratio is then around 5% (a thickness of 30 µm gives t/r = 6%). Increasing the thickness to 10% does not significantly change the relative importance of the conductive fraction, but enhances the non-conductive fraction by about 15%. Consequently, it is possible to make a good enough insulating coating so that the behavior of the hematite particles can change drastically from a highly conductive one to a near completely non-conductive one.
4.4. The Use of Another Conductive Mineral
We applied the insulating coating formulation to ilmenite particles and we confirmed that this kind of coating also works with other conductive particles in reversing their electrostatic behavior. Indeed, 95% of the bare ilmenite particles in the 850 - 1180 µm size range fall into the “conductive” pan, while once they are coated with a 2/20 coating, only 1% are still falling into the “conductive” pan. In the meantime, 86% of the coated ilmenite particles are falling into the “non-conductive” pan while 0% of uncoated ilmenite is initially falling into it. This experiment shows that the formulation of insulating coatings can be used with several conductive mineral particles to make them insulating.
4.5. Applying and Removing the Insulating Coating
Using this kind of coating to reverse the electrostatic properties of conductive particles is very easy, fast and cheap. Oil is simply added to the mineral particles, and after minimal mixing, the talc is added and the mixture is homogenized. Doing so, the coated particles do not stick together and can be used without any further manipulation. Another advantage of this kind of coating is that the original particles are recovered simply and rapidly by washing the coated particles in soap and water. Only a few minutes of stirring is needed to completely wash away the oil and to separate the talc particles floating on the water and the mineral particles sinking to the bottom.
4.6. Alternative Insulating Coatings
Several organic and inorganic components were tested for alternative insulating coating formulations [11] . We notice that any combination of an oil binder with hydrophobic inorganic fillers can lead to an efficient insulating coating. Insulating properties are degraded as soon as one of the components has some hydrophilic properties. For example, coatings with silica particles have poor insulating capabilities even if the organic binder is highly hydrophobic. In the same way, coatings made of talc and polyethylene glycol, which is a water soluble viscous liquid, have no insulating capabilities.
The viscosity of the organic binder is the critical parameter that affects the cohesion of the coating components as well as the coating and the mineral particles. We demonstrated that using a high viscous binder leads to better insulating coating than using a binder with low viscosity. For example, using a binder with a kinematic viscosity (at 26˚C) of 30 cSt instead of 615 cSt (for Hydrobrite) to coat 850 - 1180 µm hematite particles with a 2/20 formulation using 8 µm talc induces a decrease in the non-conductive weight fraction by 50% (the NC fraction passes from 67% to 17%). The reason is that the coating made with a low viscous binder degrades rapidly, affecting the coating quality surrounding the mineral particle. We determined that the kinematic viscosity of the liquid binder must be higher than 300 cSt (measured at 26˚C) to achieve effective insulating coating.
In some way, increasing the viscosity of the binder will lead to the grease state. We demonstrated that grease binders give even better insulating coating than viscous liquids [11] . For example, using Vaseline instead of Hydrobrite to coat 850 - 1180 µm hematite particles with a 2/20 formulation using 8 µm talc enhances the nonconductive weight fraction by 20% (i.e. the NC fraction increases from 67% to 87%). Because it is easier to manipulate, we chose to work with the liquid state instead of grease. Therefore, we used viscous liquid instead of grease for this study, even if grease gives better insulating coatings.
5. Conclusion
We identified the thickness required to completely insulate a conductive mineral particle by covering it with a mix of talc and viscous oil. The talc is crucial in thickening the coating. It also helps in preventing the covered particles from sticking together. The required thickness is proportional to the average radius of the mineral particles and depends on the size of the talc. With talc of 8 µm (D50), at least 5% of the average radius of the mineral particle is required, preferably 10%. So, conductive mineral particles with an average radius of around 500 µm must be coated with at least an equivalent thickness of 30 µm and preferably 50 µm. Thicker coatings were not possible with the components we used (viscous oil and talc). With finer-grained talc (2 µm), the typical thickness to radius ratio is 8%. Finer-grained talc then leads to thinner insulating coatings. Decreasing the equivalent coating thickness by 5 µm or less, has no effect on the insulating properties from an electrostatic separation point of view. A difference of 10 µm in the equivalent thickness of the coating however affects the performance of the electrostatic separation. More efficient coatings can be prepared by replacing the viscous oil by grease, and then about 20% enhancement can be expected. Another important conclusion deals with the use of an electrostatic separator as a relevant tool to qualify the insulating capabilities of different coating formulations which are revealed by the distribution of the particles in the conductive and non-conductive pans. Despite the numerous parameters affecting the separation, the sensitivity of the drum type electrostatic separator is remarkable in performing the evaluation of thin coatings surrounding mineral particles which are, in the real world, far from uniform and smooth.
Acknowledgements
Authors would like to thank Jacques Fiset and Jean-François Huard, teachers at the Cégep de Thetford, for their helpful discussions and Michel Leroux, lab technician at the CTMP, for his support and contribution to the project. We also acknowledge the Ministère des finances et de l’économie du gouvernement du Québec for its financial support of this project.
List of Symbols
t: thickness of the coating r: radius of the mineral particle X: volume ratio between the coated and the uncoated mineral particles vh: volume of hematite vt: volume of talc vo: volume of oil wh: weight of hematite wt: weight of talc wo: weight of oil dh: density of hematite dt: density of talc do: density of oil