Magnetic Barkhausen Noise Profile Analysis: Effect of Excitation Field Strength and Detection Coil Sensitivity in Case Carburized Steel ()
1. Introduction
It is well established that MBN devices, irrespective of the variation in their details, consist broadly of two main parts: 1) the generation of an excitation field and provision to the sample and 2) the detection, amplification, filtering, and handling the induced MBN signals. Part 2) is mainly a function of part 1) to a large extent. However, the second part details are also important and decide to some extent the induced MBN signal. Both parts function simultaneously and are triggered to each other by the data acquisition card. The sensitivity of the detection coil to finer details in the magnetized landscape depends on some factors and the reaction of some factors of the magnetization process with each other during the magnetization process. The applied magnetic field strength, the shape of the magnetizing waveform and the excitation frequency decide the magnetized landscape volume and hence the detected MBN signal. The excitation field applied to the test specimen can be varied by changing the potential difference applied to the electromagnet. On the other hand, the number of turns of the detection coil and its diameter together with the magnetization parameters are crucial parameters in controlling the resolution of the induced MBN signal. In spite of various studies in the literature on MBN measurements, the influence of the number of turn of the detection coil and the applied magnetic field strength on the shape of the MBN signal profile is not discussed in detail.
In steels, microstructural defects like grain boundaries, inclusions and dislocations promote both mechanical and magnetic hardening, increasing the area of hysteresis curve and reducing permeability (especially the initial permeability). This happens because the same defects which “pin” dislocations also may “pin” domain walls while moving under the effect of a time varying excitation field. There is strong relationship between microstructure and magnetic properties and this can be used for non-destructive evaluation [1] [2] . Atoms in solid solution can pin dislocations, but they cannot pin domain walls. On the other hand, atoms in solid solution can generate stress in the lattice, and this has effect on the macroscopic magnetization, i.e. hysteresis curve and on the microscopic magnetization, i.e. the MBN signal [3] . Quenching of steels promotes martensite and other fine microstructural constituents, like bainite. In such fine microstructures domain wall movement is more difficult, and domain rotation can be important as magnetization reversal mechanism. Martensite microstructure is very hard, due to: 1) large number of interfaces 2) high density of dislocations 3) carbon in solid solution generating stress in the lattice. Since, the precise nature of MBN is closely related to the microstructure of the magnetic material and consequently analysis of these signals can be used to assess the microstructure of materials. Therefore, the measurement of these emissions can be used as the basis for a method of materials characterization [2] .
Steel components are often subjected to a hardening process in which the surface gets hardened in order to improve resistance to wear. This introduces a case-hardened layer and various steel components have different requirements for the case depth. Usually, case depth is determined by measuring micro hardness profile in randomly selected samples. Sample preparation includes cutting and polishing in the areas of measurements. This method is time consuming and expensive. It is necessary to develop a non-destructive tool to monitor case depth for quality control. The case hardening process produces changes in the microstructure. As a result, the electrical conductivity and magnetic permeability in the case-hardened region are different from those in the substrate [4] . Since the magnetic properties are very sensitive to material structural changes, magnetic measurements are potential techniques to be applied as non-destructive inspection methods for the detection of material changes. This makes it possible to determine the surface treatments applied to steel using magnetic Barkhausen noise (MBN) method [4] .
Concerns have been raised over discrepancies between magnetic noise results, for example variations in the number and shape of BN peaks in different studies on very similar materials [5] -[7] . It has been suggested that inconsistencies in experimental apparatus and conditions are the cause. It is true that conditions vary widely in the experimental set up. For instance, the differences in applied field range frequency and filtering used in experiments on tempered steels. It has been shown that changes in these parameters can alter the MBN characteristics and even the number of peaks [8] . Vaidyanathan et al. [9] investigated the possibility of measuring the case depth of an induction-hardened steel using MBN measurement. They concluded that the effective depth is reflected in the MBN profile is in the range below 0.7 mm by showing a small peak in a low field strength reflecting the core material (pearlite) and larger peak at higher field strength, indicating the martensitic layer. This is due to the microstructural change through the depth with the result that two major domain walls populations contribute to the magnetization process independently. Bach et al. [10] , using a different experimental arrangement, showed that a case depth of 5 mm could be detected in the MBN profile with double peaks. They used the ratio of peak heights as an indicator of the case depth. Dubois and Fiset [11] correlated case depth in case carburized steel with the frequency spectrum of the MBE signal integrated over a range of frequencies specific to the steel type. Vaidyanathan et al. [12] used the MBN technique to evaluate the carburization depth in ferritic steels. They showed that the variation of carbon content affects the magnetic properties and consequently the BN signal level. As the carbon content increases, the intensity of MBN emission was found to decrease.
In case carburized and decarburized steels a hardness gradient is present [10] -[14] . This can cause two MBN intensity peaks to appear at different field strengths. The reason is that each peak originates in a material layer of different hardness. The variation in ferromagnetic material properties can be correlated to different parameters derived from the MBN signal generated during the magnetization cycle. The MBN profile is a plot of the rms voltage of the MBN voltage pulses as a function of applied potential difference to the electromagnet. The aim of this investigation is to optimize some experimental parameters such that, the number of turns of the detection coil and the potential applied to the electromagnet. The magnetizing frequency, filtering range and the driving waveform were kept constant throughout the experiment. The number of turns of the detection coil has been found to control the Barkhausen events from the softer material in the subsurface. The higher the number of turn of the wounded coil is the higher the detection depth of it.
2. Materials and Method
2.1. Case Carburized Specimens
The composition of the EN36 steel prior to carburization is given in Table 1. A Bar (12 × 12 × 150 mm3) was case-carburized to produce a surface carbon content of 0.85 wt% and a case-depth of 0.5 mm. The specimens were then oil quenched from 900˚C in oil. The specimen was tempered at 190˚C for 2 h (standard tempering used for gears) before testing.
2.2. Magnetic Barkhausen Noise Apparatus
The MBE measurements were conducted using equipment developed in the authors’ laboratory [4] . The testing procedure was developed to give a high degree of reproducibility, i.e., to produce minimum variations in a run of tests on the same specimen. It is essential that the process of relocation did not itself produce significant variations in the recorded MBE profile. A schematic illustration of the equipment and the MBE profile’s parameters are shown in Figure 1.

Table 1. Composition (wt%) of the EN36 steel used in this study, (balance Fe).
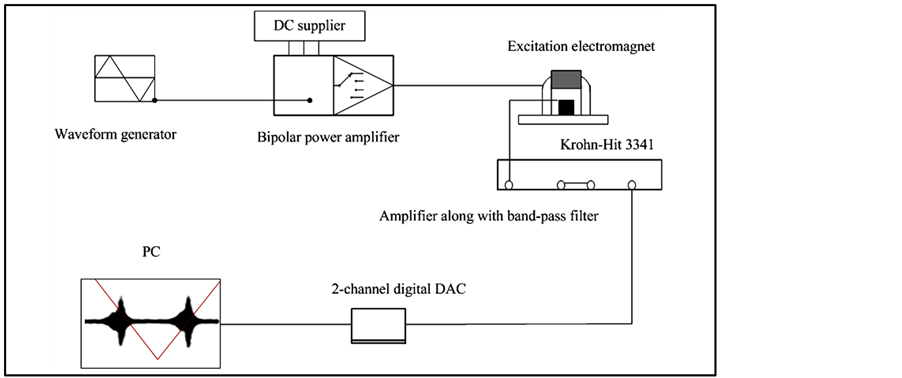
Figure 1. Schematic layout of the MBE measurement apparatus.
To produce a constant rate of magnetic induction in the specimen, the U-shape electromagnetic yoke is fed by an amplified triangular waveform (dI/dt = constant, I is the current applied to the electromagnet) from a bipolar amplifier to generate the excitation field through an inductive coil wounded on electric steel laminates.The maximum value of the driving current to produce a maximum magnetic field strength of 350 Gauss is ± 1 A (Potential difference PD ± 20 V) at a frequency of 0.2 Hz. A relatively low excitation frequency was used in the experiments to minimize eddy current opposition to the applied magnetic field and to ensure a relatively slow magnetization rate in the sample.
In general, a very sensitive detection coil is integrated with the electromagnet to probe the Barkhausen events perpendicular to the sample surface. Inductive search coi1s of 0.5 mm with 11 k-turns, 13 k-turns and 16 k-turns, wound around a 1-mm plastic cylinder, were used in this experiment. The signals were amplified at 72 dB and filtered using a 1-100 kHz band pass filter using a two channel Krohn-Hit 3341 device. The MBE signal was then acquired using a 20 Ms/s Pico Tech 12-bit DAC oscilloscope and stored in a PC. An indication of the amplified and filtered output from the search coil is shown in Figure 2(a). It is convenient to smooth emissions to produce a measure of the amplitude of the profile enclosing the signal. This is done numerically using a Matlab script. The signals were rectified by calculating the local root mean square for 100 successive points then smoothened using a digital filter for fifteen points using 5 independent cycle’s signals. An example is shown in Figure 2(b).
MBN emission, to a first approximation, was correlated with the differential permeability of the material. It follows that in a homogeneous material the emission is a maximum twice in each hysteresis loop. The intensity of the MBN emission is anticipated to peak at a positive field with increasing energizing current and peak again at a negative field as the state of magnetization of the sample moves around the BH loop [2] . As appropriate to the skin depth relationship with the excitation frequency (0.2 Hz) and the analyzing frequency range (1 - 100 kHz), the broadband MBN signal containing multiple frequencies evaluates a volume of material with a depth of about 0.6 mm below surface [5] .
3. Results and Discussion
3.1. Microstructure and Microhardness Profile
Microstructures of the specimen cross section at 50 µm and 1000 µm were produced as shown in Figure 3(a) and Figure 3(b). The microstructure of the bulk material shows a normalized microstructure consisting of granular ferrite and pearlite (Figure 3(a)) and the microstructure of the material of the carburized case indicates martensite (Figure 3(b)).
The Vickers microhardness profile was performed in the specimen cross section to indicate the hardened depth of 550 HV. Vickers microhardness measurements at a load of 100 g were made on metallographic sections taken through the case depth to obtain hardness-depth profile. The microhardenss profile is shown in Figure 4(a). The effective depth is about 0.4 mm in this specimen. The frequency content of the induced MBN signal is important indicator of any interference from the environment or the background noise. An example is shown in Figure 4(b). The spectrum of the MBN signal graph indicates that the major MBN event’s frequency was in the range of 1 - 30 kHz. Moreover, the result does not indicate anyabnormality in the frequency content.


Figure 2. MBN time domain signal of the test specimen (a), the corresponding MBN profiles of 5 signals (Optimized MBN parameters).


Figure 3. Optical micrographs of the test specimen: the bulk material (a) and the case (b).
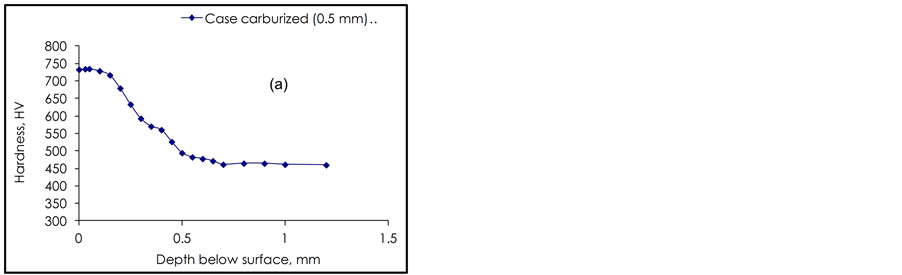

Figure 4. Microhardness profile of the specimen cross section(a), MBN frequency spectrum (b).
3.2. Barkhausen Noise Measurements
The detection of the case depth with Barkhausen noise measurement is based on the hardness difference of the surface (case) and the interior of the material. It is typical that two-peaked Barkhausen noise profiles are obtained with the first peak at lower applied field strength corresponding to the soft interior (bulk) and the second peak corresponding to the case [4] with different PD values applied to the electromagnet as shown in Figure 5.
MBN peak height variation as a function of the applied potential difference variation is shown in Figure 6. The result shows that the relative height of Peak II to Peak I increases by increasing the applied current to the electromagnet up to 0.8 A (30 V peak to peak) then it saturates at currents beyond that. The result indicates that, for this type of steel, it is sufficient to apply 0.75 A (30 V) current to the electromagnet (R = 40 Ω) to get the maximum MBN emission. An important indication of the result is that the sensitivity of Peak I to difference variation is less than that of Peak II.
The increase of the Barkhausen noise seems to be supported by raising the number of domain walls with the magnetizing frequency and therefore increasing the number of interactions between the domain walls and pinning sites [15] . This increase of the half width and the peak height value of the Barkhausen noise with the magnetizing current at constant magnetizing frequency is caused by raising the number of individual jumps (Figure 5 and Figure 6) at different positions of the magnetized landscape in the sample per unit time, with consequent increase of the number of jumps which overlap in time [16] . Since the overlapped jumps in clusters are added together, the Barkhausen noise raises too. Figure 6 indicates that, the number of Barkhausen events (represented by profile half width) increases with increasing the magnetizing current. The intensity of the magnetizing current seems only to increase the mean free bath of the moving domains and hence, the amplitude of the individual Barkhausen jumps which leads to an increase in the induced voltage in the detection coil. However, the contained details in the profile have not changed (Peaks I and II). This can be attributed to the increase in moving domain walls cluster’s population and displacement moved from pinning point to another.
3.3. Effect of Number of Turns of the Detection Coils on MBN Profile
The result of changing the number of turns of the detection coil is shown in Figure 7. The increase in the num-

Figure 5. MBN half-cycle profiles as a function of excitation voltage.
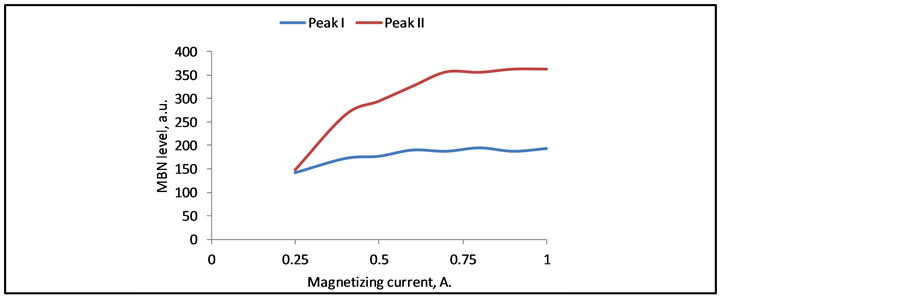
Figure 6. MBN Peak I and Peak II hight variation as a function of the potential difference applied to the electromagnet.

Figure 7. MBN profiles of complete magnetization cycle of different number of turns detection coils (optimum magnetizing parameters).
ber of turn of the detection coil results in an increase in the detection depth of the MBN signal. This has been confirmed by the increase in the height of the low field peak (Peak I) in the MBN profile. Simultaneously, the height of the second peak (Peak II), which correspond to surface MBN signal has not changed by increasing the number of turns of the detection coil.
4. Discussion
Although MBN has been attributed to a number of mechanisms, most current thinking associates it with the irreversible movement of domain walls. Theoretical models highlighting the connection MBN and the irreversible component of magnetisation Mirr have been reviewed by Jiles [2] . A basic assumption is that the intensity of emission is proportional to the differential susceptibility χirr = dMirr/dH, where H is the magnetic field. This is illustrated schematically in Figure 8, where the Mirr-H hysteresis loop is shown in relation to MBN emission for a complete magnetisation cycle. The amplitude of emission is greatest when the slope of the Mirr-H curve is a maximum, and smallest at points approaching saturation.The MBN characteristics observed (Figure 5) are consistent with the theory. If the hysteresis loop becomes narrower, with steeper sides, the peak intensity of emission will increase and the position of the peak will shift towards zero field. The converse will occur if the hysteresis loop becomes broader with a smaller maximum slope. In the experiments, peak position (Figure 5) shifted to higher values as the potential difference increased. This is consistent with the observed broadening of the BH loop with this evolution of microstructure. The increased value of peak height in Figures 5(a)-(d) suggests an increase in the maximum differential susceptibility. Again, this is consistent with BH measurements made on specimen with inhomogeneous [17] .
In real materials the structure is not perfect; it contains defects in various forms: dislocations, vacancies, interstitials and regions of second phase material, and other chemical impurities. The fluctuations will be random, but in any given finite region these fluctuations can be characterized by average amplitude of fluctuation and an average length or range of fluctuation. As a result the internal energy seen by a domain wall fluctuates as it moves through the material. It is agreed that the penetration depth of a magnetic field in a material is governed by the skin effect of eddy current given by:
 (1)
(1)
where f is the frequency of the excitation waveform in Hz, μ0 is the magnetic permeability of the vacuum (H/mm), μr is the relative permeability of the material and σ is the electrical conductivity of the material. In the case hardened specimen, the magnetization first takes place in the ferrite/pearlite core, and then in the martensitic surface layer at a higher field due to a stronger domain wall pinning strength. The low-amplitude MBN pulses in the low field region (Peak I) and the strong MBN signals observed at higher field (Peak II) are attributed to irreversible domain wall processes occurring in the core and the surface layer respectively. The relatively smaller contribution of the MBN signals from the core can be explained by considering the fact that the signals generated in the core are more attenuated by eddy current damping than those generated in the surface layer [18] . However, this experiment shows that the detection depth could be enhanced by increasing the number
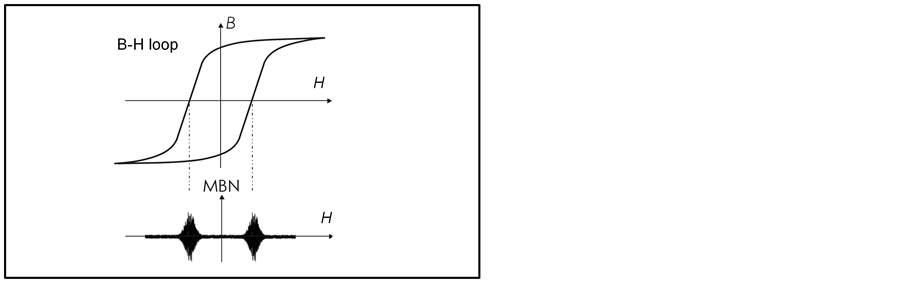
Figure 8. Schematic illustration of the theoretical relation between MBN emission and the magnetisation hysteresis loop.
of turn of the detection coil. Nevertheless, the case depth calculation formula may be modified to include the sensitivity of the detection coil used. The results indicate clearly that the Barkhausen noise is closely dependent on the apparatus specifications and set up parameters.
The increase of Peak I in Figure 7 shows that the detection depth is function of the number of turn of the detection coil. The induced MBN from the subsurface soft material attenuates due to the skin effect. Therefore, the detection depth could be increased by increasing the number of turns of the detection coil.
5. Conclusion
The magnetic Barkhausen noise method was used to qualitatively study the effect of the excitation potential difference variation and the number of turns of the detection coil. The other operational parameters that control the emission were kept constant throughout the experiments. The following point can be concluded:
• The variation in the potential difference applied to the electromagnet enhanced the intensity of the high field peak (Peak II) in MBN signal but has lower effect on the height of the low filed peak (Peak I).
• Higher magnetic field strength is required to move the magnetic domain walls through magnetic harder layers (at surface) and lower magnetic field is needed for movement of domain walls across magnetic soft phase (at bulk).
• The relative peak height of Peak I and Peak II has been improved by increasing the number of turns of the detection coil.
• Experimental parameters of MBN generation and detection process should be optimized and an operational guide standard for this type of process is needed to eliminate the discrepancy of results.