Reconstruction of Sub-Decadal Winter Half-Year Temperature during 1651-2010 for the North China Plain Using Records of Frost Date ()
1. Introduction
The reconstruction of historical temperature change can provide important background for understanding natural climate variability, which is valuable for assessing anthropogenic role in current climate changes and predicting future scenarios. It has received much attention from the IPCC and IGBP [1] [2] . Well-dated and quantitative paleoclimate records with seasonal to inter-annual resolution are important sources for reconstructing historical temperature [3] . Of these, records from historical documents are highly temporally resolved with detailed descriptive precision [4] . So they are widely used to reconstruct temperature.
Recently, many scholars have successfully developed temperature series of the past centuries to millennium using documentary evidence. For example, Japan springtime temperature variations were reconstructed since the 9th century using phonological data series of cherry tree [5] . Other historical sources, such as lake freezing and weather diary date records were also used to reconstruct summer and winter temperature series [6] . The state of art for historical climatology in Europe and North Atlantic region was comprehensively reviewed by several researchers [7] -[9] . And seasonal temperatures with a high resolution were reconstructed using historical documents. For example, Petr Dobrovolný developed monthly temperature series for Central Europe back to 1500 from documentary index series [10] . Martin Možný reconstructed mean March-June temperatures in the Czech Republic using cereal harvest dates [11] .
In eastern China, a large number of temperature series with different resolutions have also been completed, using a variety of historical documents. For instance, Chu reconstructed temperature variation, using archaeological and phonological evidence for the past 5000 years [12] . Based on the records of frost, heavy snow, river and lake freezing, Wang reconstructed seasonal and annual temperature using a cold index in North and East China [13] -[15] . Zhang calculated the frequency of cold/warm years and reconstructed winter temperature indices for the Middle of the Yangtze River and the lower reaches of Yangtze River [16] . Using phonological records and related cold/warm data, Ge et al. reconstructed winter half-year temperature for the past 2000 years with 10 - 30 years’ resolution for Eastern China [17] . With the further compilation of Yu-Xue-Fen-Cun archive, annual winter temperature was reconstructed for the middle and lower reaches of the Yangtze River extending back to 1736 [18] .
The North China Plain is located in the lower reaches of Yellow River, a region vulnerable to natural disasters, especially frost disaster (Figure 1). However, these well-dated frost disasters were rarely used in temperature
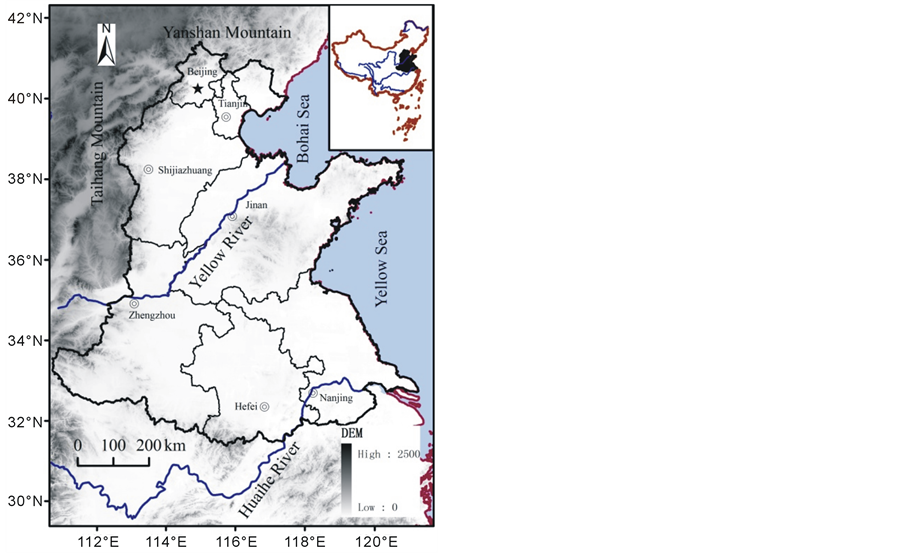
Figure 1. The general map of the study area.
reconstructions. In this paper, we use the newly collected records of frost date to reconstruct sub-decadal winter half-year temperature variations in North China Plain. This study will provide a basis dataset for studying temperature variability at the regional scale and help to evaluate the warming trend in the future.
2. Data Sources
We divided the whole research period into three subsections, the instrumental period (1951-2010), the republican era (1911-1950), and the historical period (1651-1910). We collected two types of data in this paper, meteorological data and documentary data.
2.1. Meteorological Data
China monthly surface climate data from 1951-2010 are published every year by the Chinese Meteorological Administration (CMA). To obtain regional winter half-year temperature of the instrumental period, we downloaded monthly mean temperature data of 48 stations from the CMA website (http://cdc.cma.gov.cn) and averaged them.
Meteorological data are available for only a few stations in the period of 1911-1950. To maintain the continuity of the temperature series, we chose 6 stations, at Beijing, Tianjin, Qingdao, Yantai, Baoding and Jinan, from meteorological archives of CMA. These 6 stations present good spatial representativeness for the northern China Plain and capture 70% - 90% of the variance in the regional winter half-year temperatures from 1951 to 2010 based on linear regression analysis. However, the measurements for the period of 1911-1950 at the 6 stations were missing due to persistent wars. The missing data for each station are filled with the interpolation values calculated from linear regression models showing the highest correlation coefficients between one station and its neighboring stations based on observations for the period of 1951-2010. The meteorological data both in the instrumental period and the modern period were derived from instrumental measurements, and quality assurance checks were undertaken, including examining the data for completeness, reasonableness and accuracy.
2.2. Frost Dates in the Historical Period
Our study area is mainly situated in North China Plain, which is located in the south of Yanshan Mountain, north of the Huaihe River, and east of the Taihang Mountain (Figure 1). This area is China’s traditional agricultural regions, and its climate is influenced by East Asian Monsoon. The first frost is often shifted to an earlier date when the cold air masses from Siberia arrive at northern China ahead of time in autumn. Similarly, the latest frost is always postponed to a later date when the cold air masses stay for a longer time in spring [19] . Such abnormal frost may severely affect crop growth or even kill them. Many frost disasters have been preserved in historical documents, especially in local gazettes compiled by local scholars and non-governmental groups, whose duty was to record local history and information, including natural disasters and the related impacts described in detail [20] . For example, in the 41st year since Emperor Qianlong inherited the throne, the 12th day of the fourth lunar month, a severe frost occurred in Zichuan County. It was so frosty that all the wheat and mulberry were frozen to death. The government attached great importance to the compilation of local gazettes, applied a fixed format and set up specialized organizations to supervise and check the quality of the gazettes since Qing Dynasty (AD 1644-1911). So the frost dates extracted from local gazettes are accuracy and reliable. These records have been used widely in the field of historical climate change due to their precise dating and high resolution. In this study, we compiled 374 pieces of records of abnormal frost during 1651-1910 mainly from “A Compendium of Chinese Meteorological Records of the Last 3000 years” [21] . Zhang and his research group consulted original historical documents stocked in 75 libraries and archives located in 37 cities in China. They checked the original sources carefully and corrected errors in writing. They also corrected the errors in time, place and descriptions as much as possible.
3. Methodology
3.1. Winter Half-Year Temperature Reconstruction for a Single Year
It is difficult to obtain a continuous series in a fixed location or for a fixed season, due to the uneven (spatial and temporal) distributed records. In order to reconstruct continuous temperature series, we often choose larger study areas to fill the gap resulted from data missing because frost is not a local phenomenon, it usually affects a large region. The relationship between frost dates and seasonal temperatures has been reported previously [14] . Generally, the mean temperature of autumn decreases by 0.4˚C while first frost occurs ahead of time by 10 days. Similarly, temperature in springtime decreases by 0.5˚C while last frost is proponed by 10 days.
To calibrate seasonal temperatures derived from different stations into a fixed winter half-year temperature of the whole region, we first divided the study area into three sub-regions according to the latitude due to different spatial representativeness of each station for the northern China Plain. Region I is located at between 38˚N - 41˚N, while Region II is at 35˚N - 38˚N and Region III at 32˚N - 35˚N. Second, we established regional winter half-year temperature departures and sub-regional autumn/spring temperature departures based on the reference period of 1951-1980. Then, we calculated the correlation between the winter half-year temperature departure of the whole region and the seasonal temperature of each sub-region. Finally, we established equations using regression models relating winter half-year temperature and seasonal temperature of each sub-region. We can reconstruct winter half-year temperature for a single year in historical period using these equations. For example, in the 12th year since Emperor Daoguang inherited the throne (1832), the 14th day of the eighth lunar month (8/9), a severe frost occurred in Beijing. The average date of first frost occurred in Beijing is at 12/10, with the reference period of 1951-1980. The first frost occurred ahead of time for 34 days in 1832. Thus, autumn temperature of Beijing was by 1.34˚C colder than that of the reference period. Beijing is located in Region I, and the coefficient of the regression equation between autumn temperature of Region I and winter half-year temperature of the whole region was 0.687. So the winter half-year temperature in 1832 was 0.93˚C colder than that of present.
3.2. Winter Half-Year Temperature Series for Every 5 Years
Winter half-year temperatures estimated as above do not represent the average climate conditions of that time, on the contrary they represents unusual conditions due to the fact that local gazettes always record unusual weather events outside a certain range (approximately >0.65σ, corresponding to the events occur once every 5 years). It is necessary to convert these unusual temperature values into average temperature of a specified period. To calculate the relationship between them, we first defined the coldest year’s temperature in every 5 years as the unusual temperature based on winter half-year temperature departures as mentioned above using moving methods from 1951. We also calculated average temperature of every 5 years. The repeated values resulted from moving were removed. Then, we established the regression equation using unusual temperature as predictors and average temperature as predicted. The equation is as follows:
 (1)
(1)
The Pearson correlation between the two variables is 0.922, and the explained variance, measuring the proportion of variation accounted for by the model is 0.85. The value of F statistic is very high (96.123), considering that the 99th percentile of its distribution under the null hypothesis of no real relationship is about 8.86. So using this model we can reconstruct winter half-year temperature series for every 5 years.
4. Results
Figure 2 shows the reconstructed mean winter half-year temperature anomaly since 1650 with a sub-decadal resolution (5-year resolution). Black dots represent unusual temperatures, and bar charts represent mean winter half-year temperature anomaly for every 5 years. It is worth noting that 5 gaps occurred in the period of 1746- 1750, 1771-1775, 1796-1800, 1826-1830, and 1851-1855, because there were no frost records in these periods. To maintain the continuity of the temperature series, we filled the gaps with mean values derived from 6 values before and after the gap. The characteristics of the temperature series are as follows (Table 1). Generally speaking, the climate in northern China was characterized by cold in historical period. In the second half of the 17th century, the climate was extremely cold, about 0.83˚C colder than that of the reference period of 1951-1980, including the coldest half-winter of the past 360 years. In 1701-1780, the climate experienced a relatively warm period, with a mean winter half-year temperature of 0.36˚C colder than that of present. The warmest values occurred in 1776-1780, and the 5-year mean temperature was comparable to present-day temperatures. From the year of 1781 to 1900, the climate became cold again, and the mean winter half-year temperature was 0.60˚C colder. However, since the 20th century, the climate has been in a warming phase, the mean winter half-year temperature from 1900 to 2010 was 0.11˚C higher. The highest temperatures exist in 1996-2000, and the mean winter half-year temperature was 1.25˚C higher than that of the reference period.

Figure 2. Mean winter half-year temperature anomaly for each 5-year during 1651-2010.

Table 1. Winter half-year temperature change in the North China during 1651-2010 (Unit: ˚C).
Moreover, we calculated the changing rate at centennial time scale to determine how rapidly the climate changed between cold and warm periods. The greatest warming trend was observed from 1911 to 2010, with a warming rate of 1.294˚C/100 yr. And the strongest cooling trend was detected between 1741 and 1840, with a cooling rate of 0.604˚C/100 yr. Both peak trends occurred at the transition period, which is an interesting aspect over past 360 years.
5. Discussion
In this study, we have reconstructed sub-decadal winter half-year temperature series in northern China Plain during 1651-2010. Our reconstruction improved in temporal resolution compared with the previous studies [15] [17] . Figure 3shows a comparison of our reconstruction with other 4 reconstructed series from different areas of China. The variations of our reconstruction were broadly consistent with those of other reconstructed series although these reconstructions do not cover the same regions and represent the same season. The correlation coefficients between our results and others range from 0.66 to 0.78, all passing the significance level of 0.01. The 5 temperature series all showed a similar trend during the past centuries, experiencing a relatively warm phase in the 18th century and increasing continuously and rapidly in the 20th century. However, in the 19th century, the climate entered a cooling period, reaching their lowest levels of the past 360 years.
It is noted that there are also minor differences between our reconstructions and other reconstructed series. For example, the beginning and ending time of the 18th relatively warming period varies slightly in different series. The 18th relatively warming phase in our reconstruction began in 1701 and ended in 1780, which began 10 years later than series (d) and (e), and ended 10 years earlier than series (b) and (c). These differences may be due to the following reasons. First, materials used to reconstruct temperature are different. For instance, our reconstruction used frost dates while Hao reconstructed winter temperatures using snowfall days. These proxies show different sensitivity to temperature change. Second, methods for calibration are different. Finally, different study areas and reference period may be the cause of these differences [22].
6. Conclusion
In this paper, we reconstructed a new sub-decadal resolved winter half-year temperature series based on 374
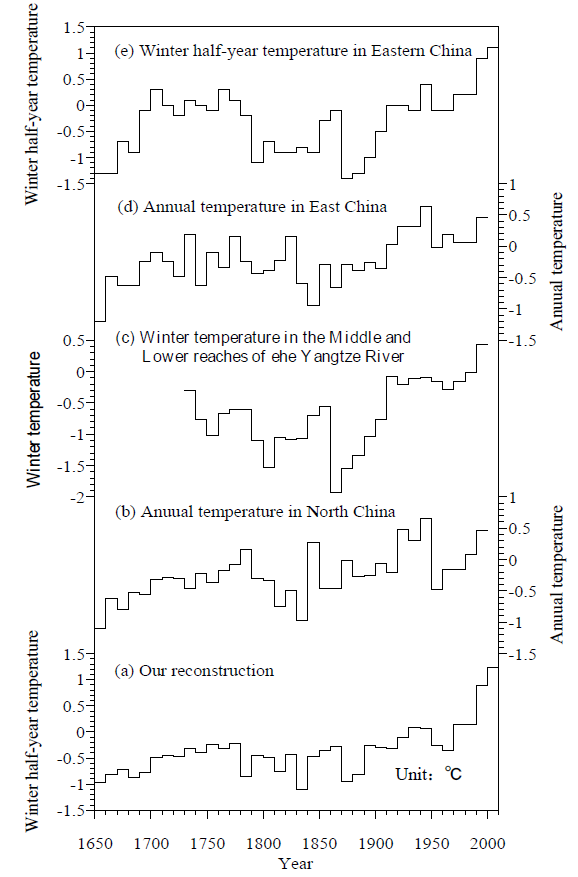
Figure 3. Comparison between different reconstructions from historical documents and our reconstruction. Series (a) is our reconstruction; (b) is the annual temperature in North China [15] ; (c) is winter temperature in the middle and lower reaches of Yangtze River [18] ; (d) is the annual temperature in East China [15] ; (e) is the winter half-year temperature in Eastern China [17] .
pieces of frost dates over the Northern China Plain during 1651-2010. The overall pattern of temperature variations during the past 360 years is analyzed in this study. In the second half of the 17th century, the climate was extremely cold, with 0.83˚C colder than that of the reference period of 1951-1980. Then, in the 18th century, especially from 1701 to 1780, the climate entered a relatively warm period, and winter half-year temperature was 0.36˚C colder, with the peak value comparable to present day. From the year 1781 to 1900, the climate became cold again, showing a −0.60˚C winter half-year temperature departure. However, since the 20th century, the climate has been in a warming phase, the mean winter half-year temperature from 1900 to 2010 was 0.11˚C higher. The highest temperatures exist in 1996-2000, with the mean winter half-year temperature 1.26˚C higher than that of the reference period, which was unprecedented during the past 360 years. The greatest warming trend was observed from 1911 to 2010, with a warming rate of 1.294˚C/100 yr. And the strongest cooling trend was detected between 1741 and 1840, showing a cooling rate of 0.604˚C/100 yr. Our reconstruction is highly consistent with other temperature series derived from Chinese historical documents on a decadal time scale although there exist some minor differences.
Acknowledgements
We would like to thank the anonymous reviewers for constructive comments and suggestions that helped to improve the quality of this study. This research was supported by grants (to IGSNRR) from the Ministry of Science and Technology of the people’s republic of China (2010CB950101), the Chinese Academy of Sciences (XDA05090104, XDA05090101), Basic Research Project of the Ministry of Science and Technology (2011FY120300) and the National Natural Science Foundation of China (41271124).
NOTES
*Corresponding author.