Study of the Adsorption Efficiency of an Eco-Friendly Carbohydrate Polymer for Contaminated Aqueous Solution by Organophosphorus Pesticide ()
1. Introduction
The contamination of surface and ground water by pesticides has become a serious environmental problem in recent years due to the extensive application of these agrochemicals in crop farms, orchards, fields and forest lands. This contamination arises from surface runoff, leaching, wind erosion, deposition from aerial applications, industrial discharges and various other sources. Consequently, pesticides have frequently been detected in water bodies in different countries of the world [1-3]. Pesticides are harmful to life because of their toxicity, carcinogenicity and mutagenicity [4]. The harmful influence of pesticides on human health and the environment has resulted in the imposition of stringent legislation on drinking water quality in many countries [5]. Ethoprophos (O-ethyl S,S-dipropyl phosphorodithioate) is organophosphorus nematicide and insecticide usually applied for the control of plant parasitic nematodes and soil insects in potatoes, sweet potatoes, tomatoes, vegetables, maize, soybeans, peanuts, bananas, citrus and other crops. The half-life (t1/2) of ethoprophos varies from 3 to 30 days. The contamination of surface and ground water by pesticides has become a serious environmental problem in recent years. The toxicity of pesticides and their degradation products are making these chemical substances a potential hazard by contaminating our environment [6]. Therefore, the removal of pesticides from water is one of the major environmental concerns these days. There are several procedures available for removal of pesticides from water which includes photocatalytic degradation [7,8], ultrasound combined with photo-Fenton treatment [9], advanced oxidation processes [10], aerobic degradation [11], electrodialysis membranes [12], ozonation [13] and adsorption [14]. The adsorption process is one of the most efficient methods of removing pollutants from wastewater. Also, the adsorption process provides an attractive alternative treatment, especially if the adsorbent is inexpensive and readily available [15]. Many studies have been made on the possibility of adsorbents using activated carbon [16-18], peat [19], chitin [20], silica [21], fly ash [22], clay [23] and others [24, 25]. A very promising natural material that can be obtained in large quantities and cheap is chitosan, a nitrogenous polysaccharide. Chitosan and its derivatives are examples of value-added materials. They are produced from chitin, which is a natural carbohydrate polymer found in the skeleton of crustaceans, such as crab, shrimp and lobster, as well as in the exoskeleton of marine zooplankton spp., including coral and jellyfishes [26]. Insects, such as butterflies and ladybugs, also have chitin in their wings and the cell walls of yeast, mushrooms and other fungi also contain this substance [27]. Chitosan is the deacetylated form of chitin, which is a linear polymer of acetylamino D-glucose. It is structurally similar to cellulose, but it is an amino polymer and has acetamide groups at the C-2 positions in place of the hydroxyl groups. Recently, chitosan which is used as an adsorbent has drawn attentions due to its high contents of amino and hydroxyl functional groups showing high potentials of the adsorption of dyes [28], metal ions [29], and proteins [30]. Other useful features of chitosan include its abundance, hydrophilicity, biocompatibility, biodegradability and antibacterial property [31]. Chitosan has good adsorption capability, due to the low porosity and weak mechanical property. Chitosan and its derivatives exhibit innumerable applications in a wide range of fields such as food preservation [32,33], pharmacy [34-36], biomedicine [37-39], cosmetics [40], biotechnology [41], dietary supplements, water treatment and agriculture [42]. These versatile materials are also widely applied in the textile, pulp and paper industries. However, only a limited number of published studies can be found in the use of chitosan as an adsorbent for pesticides removal. The use of chitosan as a precursor will provide a solution to environmental problems caused by this waste as well as produce a value-added product from a low-cost material. Therefore, in this study, removal of ethoprophos from aqueous solutions by chitosan (CH) was studied. Experimental parameters affecting the adsorption process such as adsorbent dose, initial ethoprophos concentration and contact time for removal were optimized. The equilibrium and kinetic data of the adsorption were studied to describe the adsorption process.
2. Materials and Methods
2.1. Materials
Hydrochloric acid, oxalic acid, potassium permanganates, sodium chloride, potassium hydroxide, sodium hydroxide and O-ethyl S,S-dipropyl phosphorodithioate were purchased from Merck, Germany, and were used without further purification.
2.1.1. Adsorbate
The pesticide used as adsorbate in the experiments is ethoprophos. Some properties and chemical structure of the pesticide is given in Table 1.
2.1.2. Adsorbent (CH)
The shrimp shells were collected from sea food shops and washed under running water to remove soluble organics, adherent proteins and other impurities. Then it dried in oven at 70˚C for 24 h or longer until completely dried shells were obtained.
2.2. Preparation of Chitosan
The chitinous material (shells of the shrimp) was decalcificated with 1.0 M HCl (3.0%w/v) at room temperature with constant stirring for 1.5 hours. The decalcified product was filterated, washed and dried, then deproteinized with 4% NaOH solution at 50˚C with constant stirring for 5 hours. The deproteinized chitin was filtered and washed with de-ionized distilled water until the pH became neutral. It was dehydrated twice with methanol, and once with acetone, and dried. The dried chitin was added to boiling 0.1% potassium permanganate solution to remove the odor and to 15% oxalic acid solution to remove the color. The product chitin was filtered, washed

Table 1. Some properties and chemical structure of ethoprophos.
Data were obtained from [43]. aMolecular weight. bSolubility in water at 25˚C.
with distilled water and dried. The chitosan was prepared by adding the dried chitin into a three-necked flask containing a solution of 40% (w/v) KOH, Scheme 1. It was refluxed under nitrogen atmosphere at 135˚C - 140˚C for 2 hours [44]. The deacetylated chitin (chitosan) was filtered, washed with distilled water, and dried. Then the adsorbent (Ch) were ground using ball mail (Reech, PM400, Germany).
2.3. Adsorption Experiments
The adsorption experiments of ethoprophos onto CH were carried out in a set of 150 Erlenmeyer flasks. 100 ml of the pesticide solutions of various initial concentrations in the range 10 - 60 mg/L were added to separate flasks and a fixed dose of 0.1 g of CH was added to each flask covered with glass stopper at normal pH 5.48, room temperature (25˚C ± 2˚C), for contact time 24 h, with occasional agitation to reach equilibrium. The CH dose used is the optimum in the range of initial concentrations of pesticide studied and was obtained from preliminary studies. For kinetic studies of ethoprophos onto CH, 100 ml of the solution containing 10 - 60 mg/L with 0.1 g of CH for different time intervals from 5 to 300 minutes to determine the equilibrium time. From the triplicate flasks, 40 ml of filtrate was transferred to a separatory funnel and extracted successively three times with 20, 15 and 10 ml portions of dichloromethane. The combined extract was dried on anhydrous sodium sulfate to remove moisture content and evaporated using a rotary evaporator on a water bath at 40˚C. The extracted samples were analyzed using GC-FPD. Isothermal studies of ethoprophos were conducted with an adsorbent quantity of 0.1 g of CH with pesticide concentrations of 10 - 60 mg/L in identical conical flasks containing 100 ml of distilled water. Blank solutions were treated similarly (without adsorbent).
2.4. Characterization of the Prepared Chitosan (CH)
2.4.1. Degree of Deactylation
Infrared spectra were measured by a Ati Mattson FTIR spectrophotometer. The deacetylated chitin (chitosan) CH was subjected to infrared spectroscopy to calculate the degree of deactylation (D.D) %, by the relationship:
 , (1)
, (1)
Where, A = absolute height of the absorption band of the amide group and hydroxyl group respectively [45].
2.4.2. Degree of Swelling
Swelling is the most significant characteristic of hydrogels and it reflects the affinity of the chemical structure of hydrogels for water and other surrounding fluids.
Preparation of Chitosan Gel Film.
Gel was prepared by dissolving 2% (w/v) chitosan in 1% (v/v) aqueous acetic acid with constant stirring at room temperature. The vicious solution prepared was filtered through a cheese cloth to remove any impurities and cast in petri dish to dry forming thin film. A known weight of the CH film was immersed in solutions of different pH (5, 7) at 40˚C and 25˚C until the swelling equilibrium was reached. The film was removed, dried with absorbent paper to get rid of excess water then weighed. The degree of swelling of these samples was calculated with the following equation:
 (2)
(2)
Where m and  denote the weights of sample and dried sample, respectively [46].
2.4.3. Molecular Weight Determination
Molecular weight is also one of the significant characteristics that control the functional properties of CH. Viscosity is one of the simple techniques that is widely used for estimation of the molecular weights of polymers. The viscosity-average molecular weight was calculated using Mark-Houwink equation relating to intrinsic viscosity [47].
 (3)
(3)
Where Km = 8.93 × 10⁻⁴ and a = 0.716 at 25˚C are the empirical viscometer constants that are specific for a given polymer, solvent and temperature.
2.4.4. Thermogravimetric Analysis (TGA)
The thermal stability of the chitosan was studied using a thermogravimetric analyzer (TGA). All TGA spectra were recorded under a nitrogen atmosphere up to 600˚C using a programmed rate of 10˚C/min.
2.4.5. X-Ray Diffraction Measurements
XRD patterns were obtained on Siemens (Berlin, Germany) D500 diffractometer with a back monochromator and a Cu anticathode.


Scheme 1. The preparation of chitosan by deactylation of chitin.
2.4.6. Scanning Electron Microscopy Testing
Phase morphology was studied using a JSM-T20 (JEOL, Tokyo, Japan) scanning electron microscope (SEM). For scanning electron observations, the surface of the sample was mounted on a standard specimen stub. A thin coating (~10−6 m) of gold was deposited into the sample surface and attached to the stub prior to SEM examination in the microscope to avoid electrostatic charging during examination.
2.5. Determination of Adsorption Capacity
The adsorption capacity was determined by using the following equation, taking into account the concentration difference of the solution at the beginning and at equilibrium [48].
 (4)
(4)
Where C0 and Ce are the initial and the equilibrium ethoprophos concentration mg/L, respectively, V is the volume of solution (ml) and m is the amount of adsorbent used (g). The removal percentage can be calculated as:
Removal percentage =  (5)
(5)
2.6. Determination of Ethoprophos Concentration
The concentration of ethoprophos was determined by HP 7890 A series Gas Chromatograph (GLC), equipped with Flame Photometric Detector (FPD) operated in the phosphorus mode (525 nm filter) under the following conditions. The used column was PAS: 1701 (30.00 m × 0.32 mm and 0.25 mµ film thickness. Detector temperature was 250˚C, injector temperature was 245˚C, and the column temperature was programmed so that reaches to 190˚C and hold on 2 minutes, then rose to 240˚C, at a rate of 10˚C min−1 and hold on 5 minutes. Nitrogen carrier gas flow rate was 4 ml∙min−1, hydrogen flow was 75 ml∙min−1 and air flow was 100 ml∙min−1.
3. Results and Discussion
From FTIR analysis was shown in Figure 1, the degree of deactylation (D.D) of the prepared chitosan CH was calculated and found to be 61.67%. The FTIR spectra of chitosan and with its adsorbent are shown in Figure 1, for comparison. The band at 3500 - 3300 cm−1 contributing to the NH2 Stretching of the primary amine, the band at 3500 - 3200 cm−1 corresponds to OH bonded groups and - , it makes a broad peak in the spectrum. The spectra also shows the peaks around 1420 & 1450 cm−1 contributing to -CH2COOH group, moderate peaks at 1651 & 1597 cm−1 referred to C = O group of acetyl groups, which are more appear in the CH-absorbent than that in the CH sample. The spectra also shows the peaks around 1427 & 1450 cm−1 contributing to -CH2COOH group, moderate peaks at 1652 & 1597 cm−1 referred to C = O group of acetyl groups. The NH2 stretch of amide groups & CH2 stretch, C-CH2, C-O and NH out-of-plane, all these peaks are appeared at 2920, 1427, 1090, 640 cm−1 respectively. The identically in the peaks confirmed that there is a small difference between the groups of chitosan and Ethoprophos. FTIR spectrum of chitosan
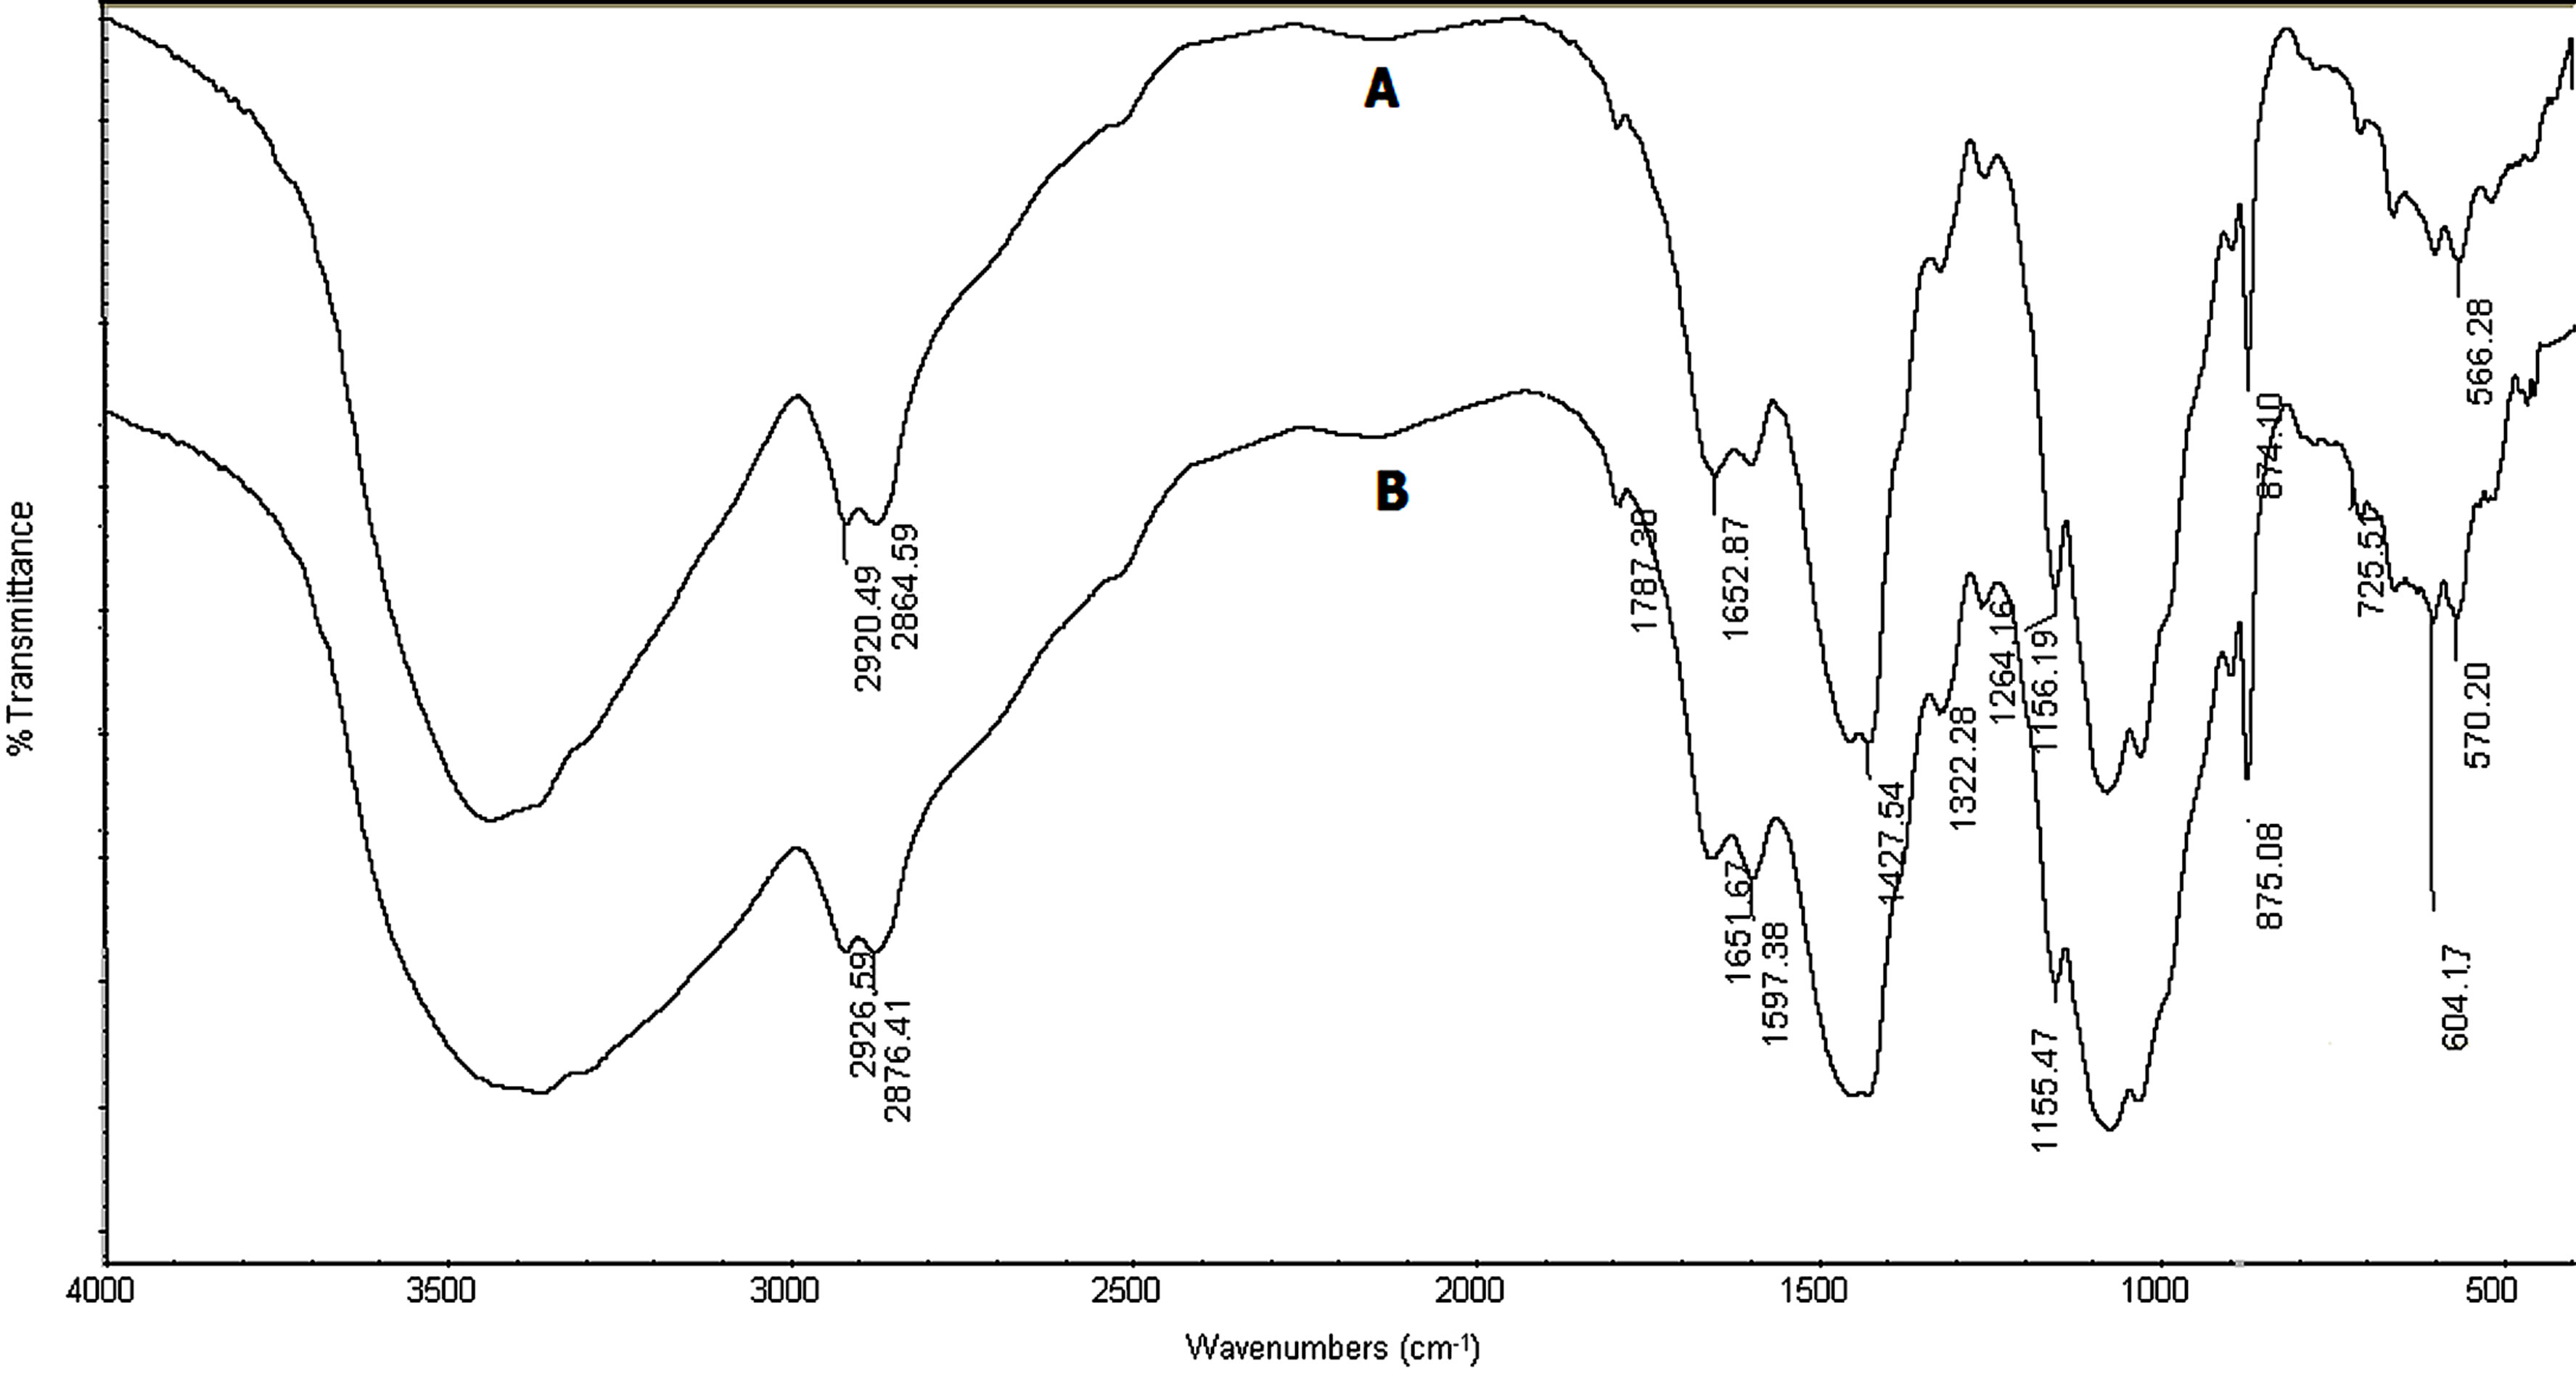
Figure 1. IR spectra of chitosan before (A)and after adsorption(B).
powder shows characteristic hydroxyl group and stretching vibrations of C-O group at 1787 cm−1. The bending vibrations of C-H bond in -CH2 are located at 2926 cm−1 and in -CH3 group are located at 2876 cm−1. The band at 1651 cm−1 is related to the stretching vibrations of amide group carbonyl bonds C-O and the band at 1597 cm−1 is related to the stretching vibrations of amine group. Bending vibrations of methylene and methyl groups are located at 1322 cm−1 and 1450 cm−1, respectively. The spectrum in the range from 1150 to 1000 cm−1 is attributed to stretching vibrations of C-O groups. The characteristic bands needed to confirm complexation between chitosan and Ethoprophos are shifted to the higher frequency.
Characteristic amide group from chitosan located at 1651 cm−1 is shifted to higher frequencies, to 1720 cm−1. The peak located at 1540 cm−1, which corresponds to the NH2-group form chitosan, is shifted to higher frequency,1590 cm−1, indicating that the acetic acid residue (CH3COO-) is attached to amine group in the chitosan chain. The shift of amide and amine group can be related to the electrostatic interaction between these groups and the negatively charged sites in the Ethoprophos structure, which confirm complexation between chitosan and Ethoprophos. The changes in the FTIR spectrum of the powders after binding with the Ethoprophos are significant. The -OH stretching, observed as strong broad band at 3445 cm−1 in unloaded CH, shifts to 3430 cm−1 after binding Ethoprophos. These results confirm that -CONH2, -NH2 and -OH groups from chitosan, are involved in binding of Ethoprophos.
3.1. Degree of Swelling
It is evident from the results of the swelling properties represented in Figure 2 that, they are affected by the, pH and temperature. The chitosan polymer contains more amino groups, -NH2, which posses a high degree of deactylation, easily protonated to form more - groups in acidic solution (acetic acid). The high swelling properties is due to the strong electrostatic interaction between the -
 groups of chitosan and hydroxyl group of water.

Figure 2. The degree of swelling (D.S) of CH samples, (at different PH & temperatures), at time intervals.
These properties decreased at pH = 5, but increased at pH = 5 at 40˚C, pH = 7 at 25˚C and pH = 7 at 40˚C. These results are attributed to the increase in the mobility of the molecules with increase of temperature; this leads to increase in the porosity of the surface of the chitosan molecules and increase in its swelling properties. At Ph < 7, the decrease in the ratio of -OH groups leads to decrease in the swelling properties. The chitosan polymer which contains more amide groups cannot be easily protonated in acidic solutions. Since the electron withdrawal by carbonyl groups makes the nitrogen of the amide groups a much poorer source of electrons than that of the amino groups, and so the electrons are less available for sharing with hydrogen ions.
3.2. Molecular Weight Determination of CH
The viscosity-average molecular weight (Mv( of the prepared chitosan sample CH was determined by using an Ostwald viscometer at 25˚C in 0.3 M acetic acid and 0.2 M sodium acetate buffer solution and were calculated by using equation [3]. AS shown in Figure 3, the intrinsic viscosity [η] of the prepared chitosan CH sample, are = 3.5 dl/g and the viscosity-average molecular weight (Mv) was 99,998 Da.
3.3. Thermal Properties Thermogravimetric Analysis (TGA)
The previous investigations have shown that the decomposition of chitosan has 2 endothermic processes, the first one around 60˚C for water evaporation, and the second one starts around 225˚C and reaches a maximum 260˚C. Thermal degradation of pure chitosan, as Shown in Figure 4, can have charred residue of up to 39% at 450˚C.
3.4. Scanning Electron Microscopy (SEM)
SEM is a widely used technique to study morphology

Figure 3. The reduced viscosity of chitosan vs. concentration at 25˚C.

Figure 4. TGA of chitosan.
and surface characteristics of the adsorbent. Figure 5 presents the SEM micrographs illustrating the morphology of the adsorbent (chitosan) before (A) and after (B) adsorption. The micrographs after adsorption of ethoprophos had their surfaces covered with irregular adhered substances which were suspected to be the adsorbate molecules; unlike the structure of the adsorbent before adsorption which had a clear plain surface.
3.5. X-Ray Diffraction (XRD)
The XRD pattern of chitosan prepared from shrimp shells waste at Figure 6, exhibits the weak diffraction peaks centered at diffraction angle 2θ = 11.9˚ and sharp diffraction peaks at 2θ = 20˚ are indicative of the high degree of crystallinity morphology of chitosan.
3.6. The Effect of Biosorbent Dose
Adsorbent dose is an important parameter influencing adsorption processes since it determines the adsorption capacity of an adsorbent for a given initial concentration of the adsorbate at the operating conditions. The effect of CH dose on removal of ethoprophos was studied in range of 0.02 - 0.1 g/100ml. Figure 7 showed that the removal percentage of pesticide increased from 85.693% to 89.234%, as adsorbent dose (CH) increased from 0.02 to 0.1 g/100ml. Such a trend is attributed to an increase in the adsorptive surface area and the availability of more binding sites. Further increase in adsorbent dose, did not show significant increase in removal percentage of pesticide, therefore, 0.1 g/100ml adsorbent dose was chosen for the successive experiments. Similar behaviour for the effect of biosorbent dosage on dye adsorption capacity was observed for different types of sorbents [49,50].
3.7. The Effect of Initial Pesticide Concentration on Biosorption
The effect of ethoprophos concentration by CH was studied at different initial pesticide concentrations of 10, 20,
 (a)
(a) (b)
(b)
Figure 5. The SEM of chitosan bowder before (a) and after adsorption (b).

Figure 6. The XRD pattern of prepared chitosan.

Figure 7. The effect of biosorbent dose on ethoprophos removal onto CH (C0: 60 mg/L, temperature: 25˚C ± 2˚C).
30, 40, 50 and 60 mg/L. Figure 8 shows that the adsorption capacity increased from 9.399 to 54.706 mg/g with increasing of the ethoprophos concentration. This is probably due to increase in the driving force of the concentration gradient, as an increase in the initial pesticide concentration [51]. However, the removal percentage of ethoprophos reduced from 93.994% to 87.76% with increasing concentration of the pesticide. At higher pesticide concentrations, lower pesticide removal percentage is probably due to the saturation of sorption sites. Similar results were reported by other workers for coniferous bark power [52] and tea [53].
3.8. The Effect of Contact Time on Biosorption
The effect of contact time was first investigated to deter-

Figure 8. The effect of initial concentration for removal of ethoprophos by CH (biosorbent dose, 0.1 g/100ml, temperature: 25˚C ± 2˚C).
mine the equilibrium time for ethoprophos adsorption onto CH at 25˚C ± 2˚C. Figure 9 shows the effect of contact time on the adsorption of ethoprophos at different initial concentrations by chitosan. The pesticide adsorption rate was high in the first 30 min for all initial concentrations of pesticides investigated and finally attained after 180 min. The rapid pesticide adsorption at the initial stages of contact time could be attributed to the large number of active sites available on the surface of chitosan. Afterwards with the gradual occupancy of these sites, the sorption became less efficient. This is in agreement with the results obtained for hazelnut shell [54].
3.9. Equilibrium Isotherms
The equilibrium adsorption isotherm has the importance in the design of adsorption systems [55]. The equilibrium data were analyzed by the most commonly used isotherms; Langmuir, Freundlich, Temkin isotherm and DubininRadushkevich (D-R) models [56-59].
3.9.1. Langmuir Isotherm
The Langmuir equation, which is valid for monolayer adsorption onto a completely homogeneous surface with a finite number of identical sites and with negligible interaction between adsorbed molecules, is represented in the linear form as follows [60].
 (6)
(6)
Where qe (mg/g) and Ce (mg/L) are the amount of adsorbed ethoprophos per unit mass of adsorbent and ethoprophos concentration at equilibrium, respectively. Qm is the maximum amount of the ethoprophos per unit mass of adsorbent to form a complete monolayer on the surface bound at high Ce and b is the Langmuir constant (L/mg). The plot of specific adsorption (Ce/qe) against the equilibrium concentration (Ce) Figure 10, shows that

Figure 9. The effect of contact time on ethoprophos removal by CH (biosorbent dose, 0.1 g/100ml, temperature: 25˚C ± 2˚C).

Figure 10. Langmuir adsorption isotherm for ethoprophos onto CH.
the adsorption obeys the Langmuir model. The Langmuir constants qm and b were determined from the slope and intercept of the plot and are presented in Table 2. One of the essential characteristics of the Langmuir isotherm can be expressed in terms of a dimensionless constant separation factor RL that is given by Equation (7) [61]:
 (7)
(7)
Where C0 is the highest initial concentration of adsorbate (mg/L), and KL (L/mg) is Langmuir constant. The RL values between 0 and 1 indicate favorable adsorption. Table 3, shows the value of RL in the present investigation was found to be 0.014 indicating that the adsorption of ethoprophos on CH is favorable.
3.9.2. The Freundlich Isotherm
The Freundlich isotherm, on the other hand, assumes a heterogeneous sorption surface with sites that have different energies of sorption. The Freundlich model can be represented as:
 (8)
(8)

Table 2. Langmuir, Freundlich, Temkin and Dubinin-Radushkevich (D-R) isotherm models constants and correlation coefficients for adsorption of ethoprophos on Chitosan.

Table 3. The parameter RL indicated the shape of isotherm.
Equation (9) can be linearized in the logarithmic form (Equation (10)) and the Freundlich constants can be determined:
 (9)
(9)
Where Kf is the relative adsorption capacity of adsorbent and nf is a constant related to adsorption intensity. The plot of log qe versus log Ce should give a straight line with a slope of 1/nf and intercept of ln Kf Figure 11. The 1/n is lower than 1.0, indicating that ethoprophos is favorably adsorbed by CH [62]. The higher correlation coefficients (R2) of the Freundlich isotherm suggest that Freundlich isotherm can be used to fit the experimental adsorption data for the removal of ethoprophos by Chitosan.
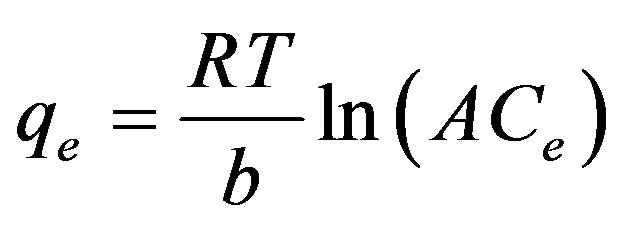
3.9.3. The Temkin Isotherm
Temkin adsorption isotherm model was used to evaluate the adsorption potentials of the ethoprophos on CH. The derivation of the Temkin isotherm assumes that the fall in the heat of sorption is linear rather than logarithmic, as implied in the Freundlich equation. The Temkin isotherm

Figure 11. Freundlich adsorption isotherm for ethoprophos onto CH.
has commonly been applied in the following form [63- 65];
 (10)
(10)
The Temkin isotherm, Equation (11) can be simplified to the following equation:
 (11)
(11)
Where β = (RT)/b, T is the absolute temperature in Kelvin and R is the universal gas constant, 8.314 J (mol/K). The constant b is related to the heat of adsorption qe (mg/g) and Ce (mg/L) are the amount adsorbed at equilibrium and the equilibrium concentration, respectively. A and B are constants related to adsorption capacity and intensity of adsorption. Plots of lnCe against qe for the adsorption of ethoprophos onto CH are given in Figure 12. The constants A and B are listed in Table 3. Examination of the data shows that the Temkin isotherm is not applicable to ethoprophos adsorption onto CH judged by low correlation coefficient R2 = 0.9112.
3.9.4. The Dubinin-Radushkevich (D-R) Isotherm
D-R model was applied to estimate the porosity apparent free energy and the characteristic of adsorption [66]. The D-R isotherm is dose not assumes a homogeneous surface or constant sorption potential and it has commonly been applied in the following form (Equation (12)) and its linear form can be shown in Equation (13):
 (12)
(12)
 (13)
(13)
Where K is a constant related to the adsorption energy, qe (mg/g) is the amount of pesticide adsorbed per g of adsorbent and qm represents the maximum adsorption capacity of adsorbent, β (mol2/J2) is a constant related to adsorption energy, while ε is the Polanyi potential can be calculated from Equation (14):

Figure 12. Temkin adsorption isotherm for ethoprophos adsorption on CH.
 (14)
(14)
The values of β and qm can be obtained by plotting ln qe vs. ε2. The mean free energy of adsorption (E, J/mol), defined as the free energy change when one mole of ion is transferred from infinity in solution to the surface of the sorbent, was calculated from the K value using the following relation (Equation (15)) [67]:
 (15)
(15)
The calculated value of D-R parameters is given in Figure 13 and Table 2. The saturation adsorption capacity qm obtained using D-R isotherm model for adsorption of ethoprophos onto CH is 121.75 mg/g. The E value is useful as can be used to estimate the type of adsorption process. If the value falls in between 8 and 16 kJ/mol, the adsorption process can be explained by ion-exchange mechanism. Meanwhile, if the value is less than 8 kJ/mol, it shows that the adsorption process is of a physical nature [68]. The values of E calculated using Equation (16) is 5.56 kJ/mol, which indicating that the physico-sorption process plays the significant role in the adsorption of ethoprophos onto Chitosan. To study the applicability of the Langmuir, Freundlich, Temkin and D-R isotherm models for the ethoprophos biosorption by CH, all calculated parameters of these models are shown in Table 2. From the linear regression correlation coefficient R2, it shows that the equilibrium data could be well interpreted by the Freundlich isotherm.
3.10. Adsorption Kinetics
The kinetic studies provide useful data regarding the efficiency of adsorption process and feasibility of scale-up operations [69]. Several kinetic models are available to describe the adsorption kinetics. Mostly used models including the pseudo-first order, pseudo-second order and intraparticle diffusion were applied to the experimental data to evaluate the kinetics of ethoprophos adsorption by Chitosan.

Figure 13. Dubbinin radushkevich for ethoprophos adsorption on CH.
3.10.1. The Pseudo First-Order
The pseudo-first order kinetic model can be expressed in a linear form as:
 (16)
(16)
Where qe and qt are the amount of ethoprophos adsorbed (mg/g) on the adsorbent at the equilibrium and at time t, respectively, and k1 is the rate constant of adsorption (min−1). Values of k1 were calculated from the plots of log (qe − qt) versus t. The application of this equation to the data of ethoprophos on CH (data not shown) indicated the inapplicability of the model.
3.10.2. The Pseudo-Second Order
The Pseudo-second order kinetic model can be represented as:
 (17)
(17)
Where K2 is the rate constant for the pseudo-second order kinetics (g/mg min). The linear plot of (t/qt) versus t is shown in Figure 14. The initial sorption rate can be calculated using the relation [70].
 (18)
(18)
The parameters calculated for the pseudo-second order kinetic model are listed in Table 4. As seen from the table, due to high R2, the pseudo-second order is predominant kinetic model for the ethoprophos adsorption by chitosan. Similar kinetic result was reported for hazelnut shell and Pyracantha coccinea [71,72].
3.10.3. The Intraparticle Diffusion Model
In order to identify the diffusion mechanism, the intraparticle diffusion model can be represented as:
 (19)
(19)
Where Ki is the intraparticle diffusion rate constant and C is a constant which gives information about the thickness of boundary layer. The intraparticle diffusion

Figure 14. Pseudo-second order kinetic for adsorption of ethoprophos onto CH.

Table 4. Kinetic models parameters adsorption of ethoprophos onto prepared chitosan at 25˚C.
rate constants values are shown in Table 4. The plot of qe versus t1/2 Figure 15, could yield a straight line passing through the origin if the biosorption process obeys the intraparticle diffusion model. The line does not pass through the origin; therefore, intraparticle diffusion is not the only rate-limiting step. It could be stated that this process is complex and involves more than one mechanism [73]. The results demonstrated that the value of coefficient of determination (R2) for the intraparticle diffusion was slightly lower than those of a pseudo-second order kinetic model indicating that pseudo-second order model is better obeyed than intraparticle diffusion model.
4. Conclusion
In this study, the biosorption removal of ethoprophos from aqueous solution by Chitosan as a low-cost and natural available adsorbent was investigated. The results show that the increase in mass biosorbent leads to increase in pesticide biosorption due to increase in number of biosorption sites. The equilibrium uptake was increased with increasing the initial concentration of pesticide in solution. The equilibrium data could be well interpreted by Freundlich isotherm. The value of activation energy

Figure 15. Intraparticle diffusion kinetic for adsorption of ethoprophos onto CH.
calculated from the D-R isotherm model 5.56 KJ/mol suggest that the ethoprophos adsorption on CH is physical. Different kinetic models were used to fit experimental data. The biosorption process could be best fitted by the pseudo-second order kinetic model. The results revealed that prepared chitosan can be used as an effective natural economical biosorbent for the treatment of water containing synthetic pesticide.
NOTES