Gravity Survey along the Mizuho Traverse Routes, East Antarctica: SEAL Seismic Exploration in 1999-2000 ()
1. Introduction
The Japanese Antarctic Research Expedition (JARE) has been placed emphasis on the geophysical prospecting on the Mizuho Plateau, East Antarctica. Several geophysical investigations have been carried out to understand the physical characteristics beneath the continental ice-sheet on the Plateau. The Mizuho Plateau locates in the Paleozoic Lützow-Holm Complex (LHC), where a regional metamorphism has occurred in 550 Ma as a Pan-African orogenic event [1]. A regional tectonic history involving evolution on a super-continent could be revealed by attributing a uniform interpretation on the geophysical crustal structure of the region.
A multidisciplinary geosciences project on “Structure and Evolution of the East Antarctic Lithosphere (SEAL)”
[2] had been carried out in a framework of JARE. In the program, geological and geomorphological field surveys, paleo-magnetic and geomagnetic measurements, as well as the seismic and gravity investigations were conducted in Western Enderby Land -Eastern Dronning Maud Land, in particular at the LHC. Among several SEAL projects, the JARE-41 conducted a seismic refraction and wideangle reflection survey with a dense station distribution along the Mizuho routes in the austral summer of 1999- 2000 [3]. The velocity structure of the ice-sheet together with the uppermost crust along the seismic profile was clearly revealed by analyzing seismic travel-time data [4].
Land traverse gravity surveys on the Mizuho Plateau were carried out for several times by geophysical and glaciological perspectives since 1961 [5-8]. A significant inclination of the Moho discontinuity from inland to the coast was estimated by the crustal density model [9,10].
From these previous studies, however, distribution of the gravity measurement sites was very spare and was not enough numbers in order to compare with the detailed velocity model derived by the JARE-41 seismic exploration. Therefore, we carried out the gravity survey with a dense distribution of the gravity observation sites along the JARE-41 seismic profile to study crustal density characteristics beneath the Plateau.
2. Gravity Measurements
Gravity measurements were conducted by using a SCINTREX (CG-3M) gravimeter at about 1 km-interval along the Mizuho routes. The survey line was spread over 190 km in length from S16 to Z20 along the traverse routes (Figure 1). The number of the measurement sites was 160 and the total number of the measurements was 211 except the re-measurements of the campsites. Locations of all sites were determined by GPS measurements on WGS-84 ellipsoid. The GPS locations were precisely calculated by using the “autogipsy” as a global GPS database (http://gipsy.jpl.nasa.gov) and the rapid static positioning between permanent GPS sites of Syowa or Mawson Stations. Locations of all observation sites included error within 1 m.
As a reference of the gravity measurements, the gravity measurements were connected to the International Absolute Gravity Basestation Network (IAGBN-A) at Syowa Station. Since our gravity survey line in inland ice-plateau area was remote from the gravity reference point, we established a subreference point at S16, where
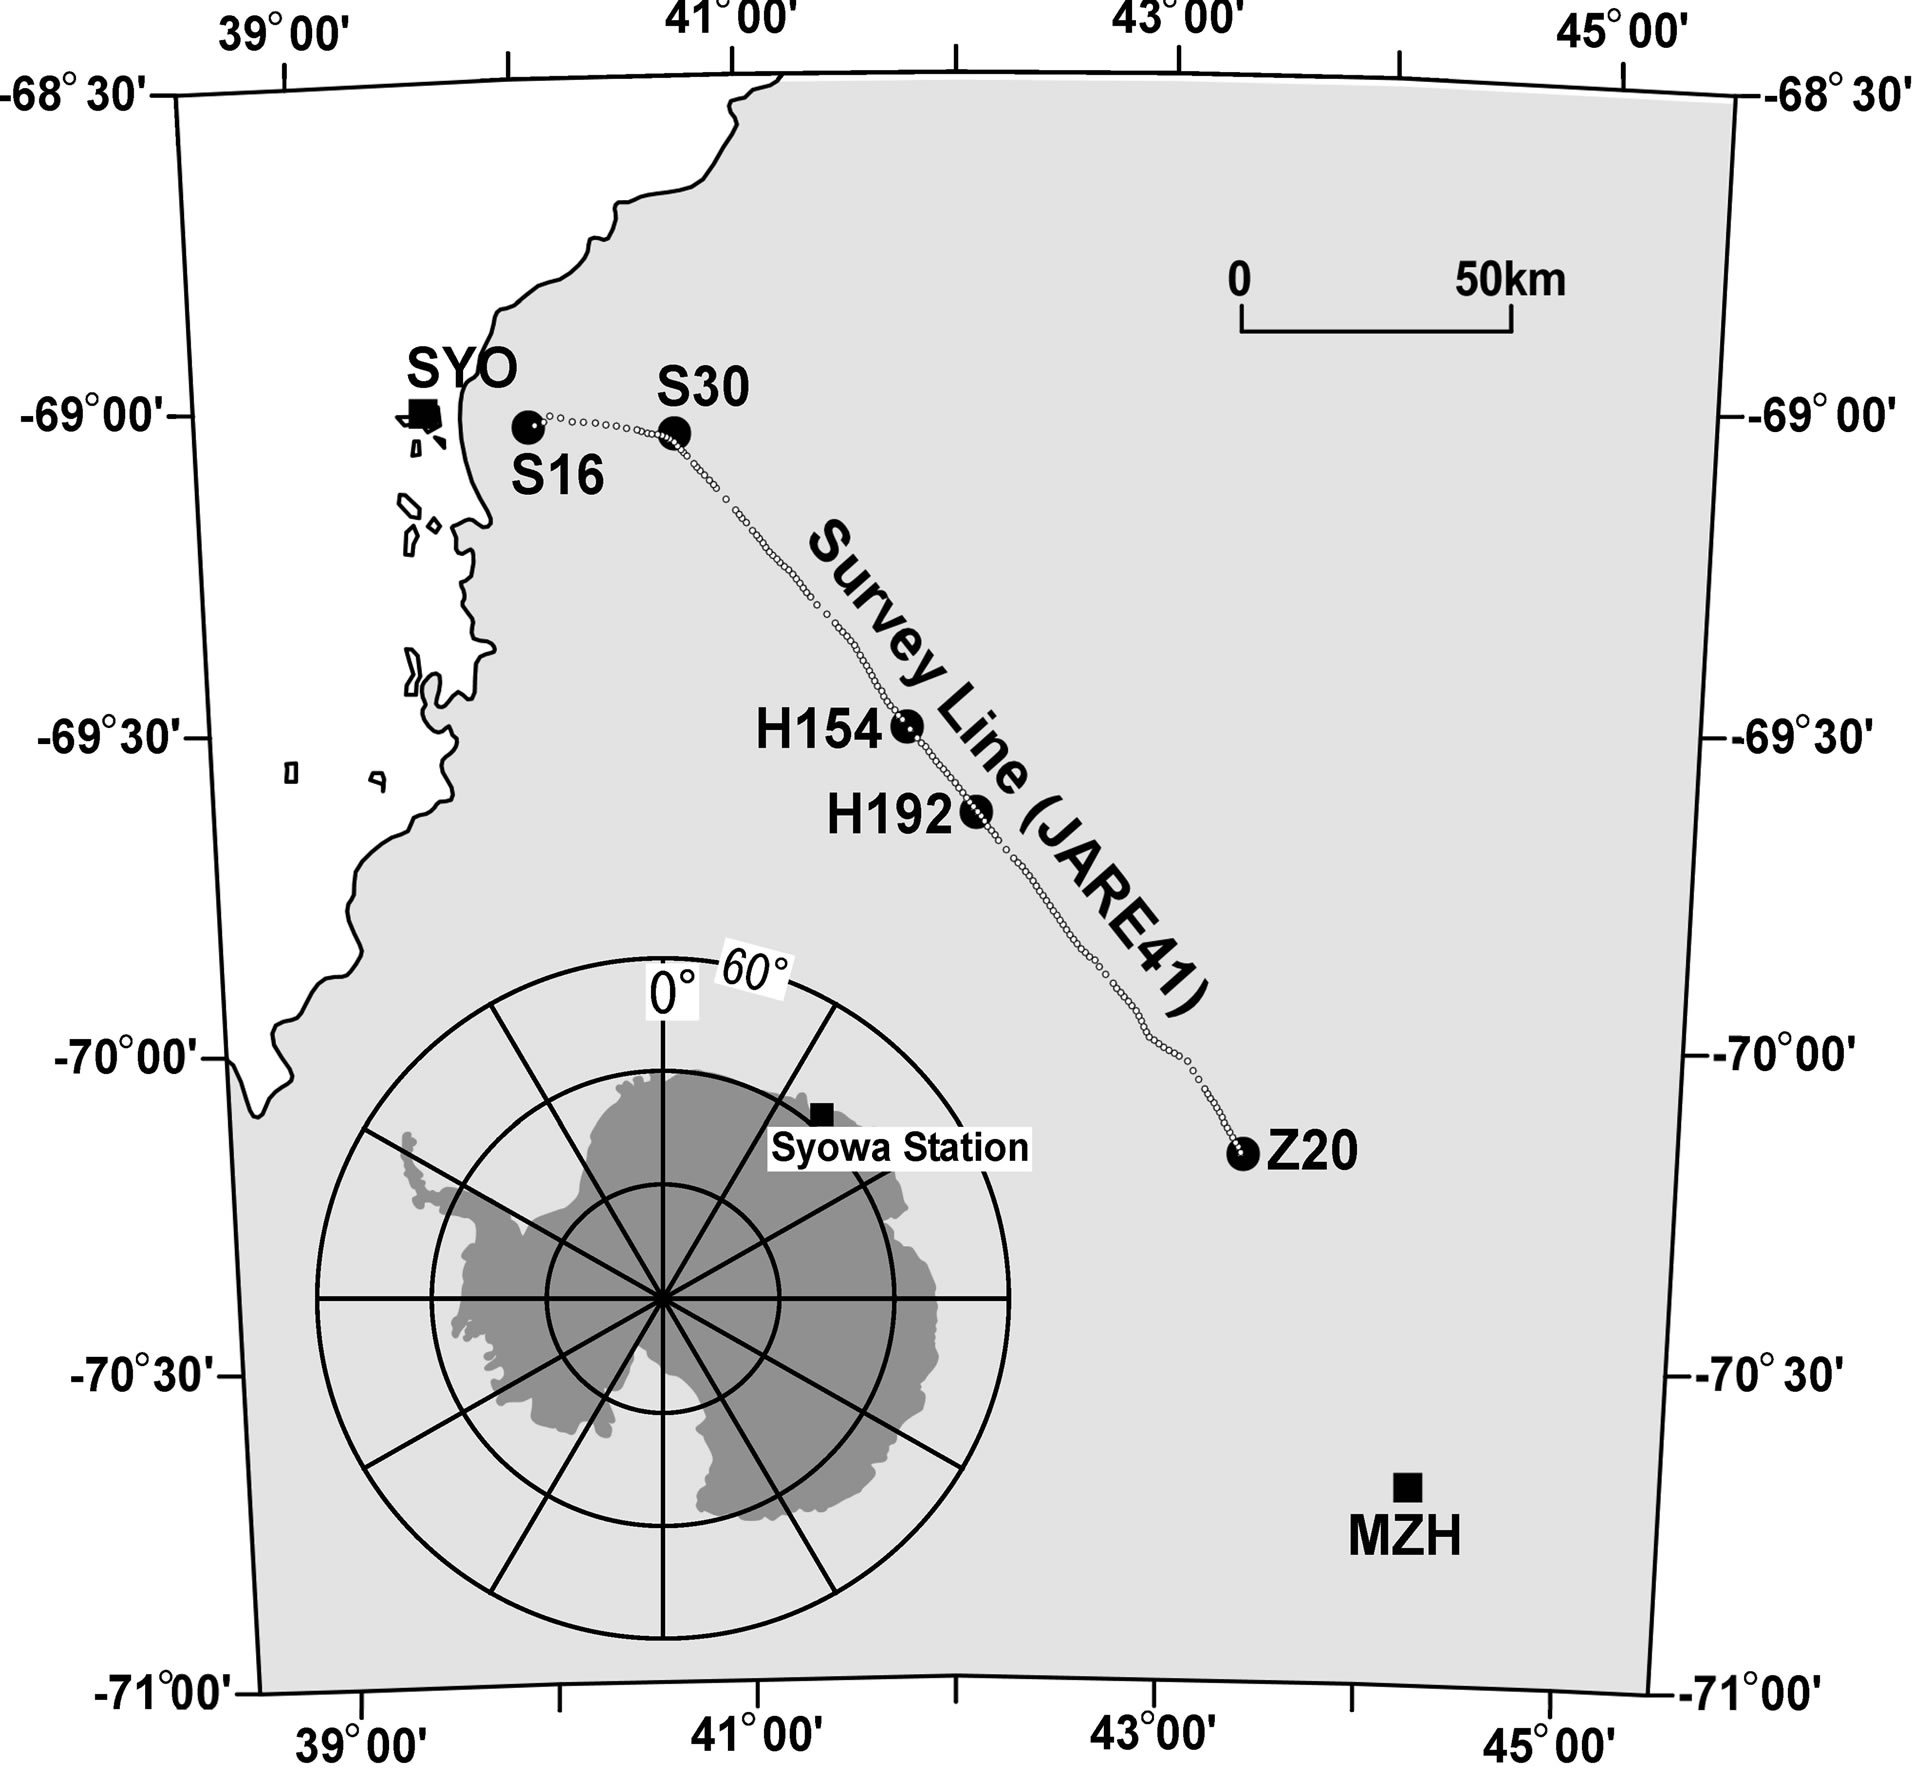
Figure 1. Map showing the JARE-41 gravimetric survey line. Small open circles indicate 160 measurement points. Large solid circles and squares indicate important route points (S16, S30, H192 and Z20) together with the Japanese Antarctic Stations (Syowa: SYO; Mizuho: MZH).
was linked directly to the IAGBN-A at Syowa. In the gravity survey, we could not adopt a closed-loop method, which is usually adopted in the gravity survey. It is necessary to measure the gravity values at the identical site every day, so as to obtain precise drift-rate estimation. However, in actual situation such as bad-weathers and/or cold temperature, a frequent gravity measurement was very difficult in the Antarctic inland filed operation. Consequently, we carried out gravity measurements more than twice at several observation sites including S16 subreference station during the whole time-period of our survey. A drift rate throughout the measurement period (total of 52 days) was 0.57 mgal/day and without any significant tare-jumps (Figure 2).
At all stations on the survey profile, a measurement was continued during 60 s. If the three successive measurements agreed within a certain allowance (10 microgal), the final gravity value at the site was determined to be a mean value of these measurements. We also adopted the automatic compensation functions for the temperature and the tilt equipped in the SCINTREX (CG-3M) gravimeter. The Earth tide and drift corrections were additionally calculated during the analyzing procedure as described in Chapter 3.
3. Gravity Calculations
As a reference point of the measurements, we used the absolute gravity station (IAGBN-A) at Syowa Station, where the value gSyowa = 982524.327 mgal had already been obtained [11]. After the correction of Earth tide and drift of the gravity meter, Free-air and simple Bouguer gravity anomalies were calculated by the following formula. Free-air anomaly Δg is given by,
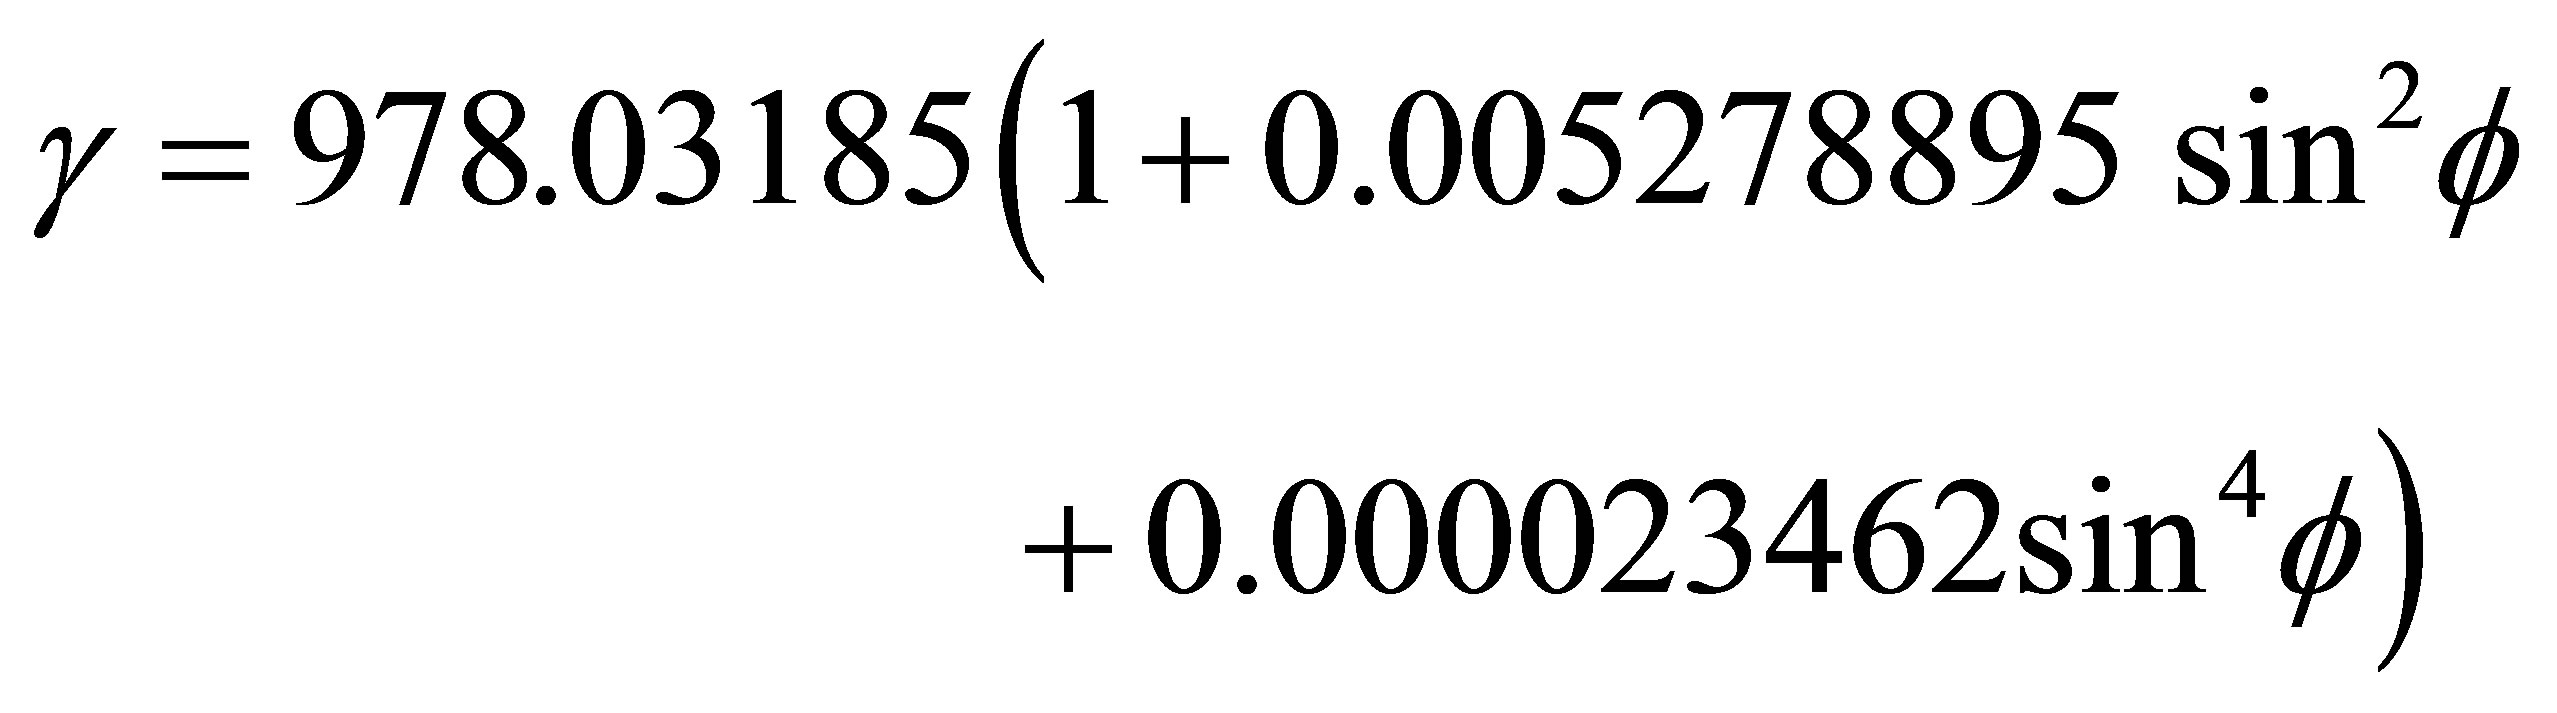

where g and γ are the measured gravity value and the normal gravity defined on the reference ellipsoid 1967 in
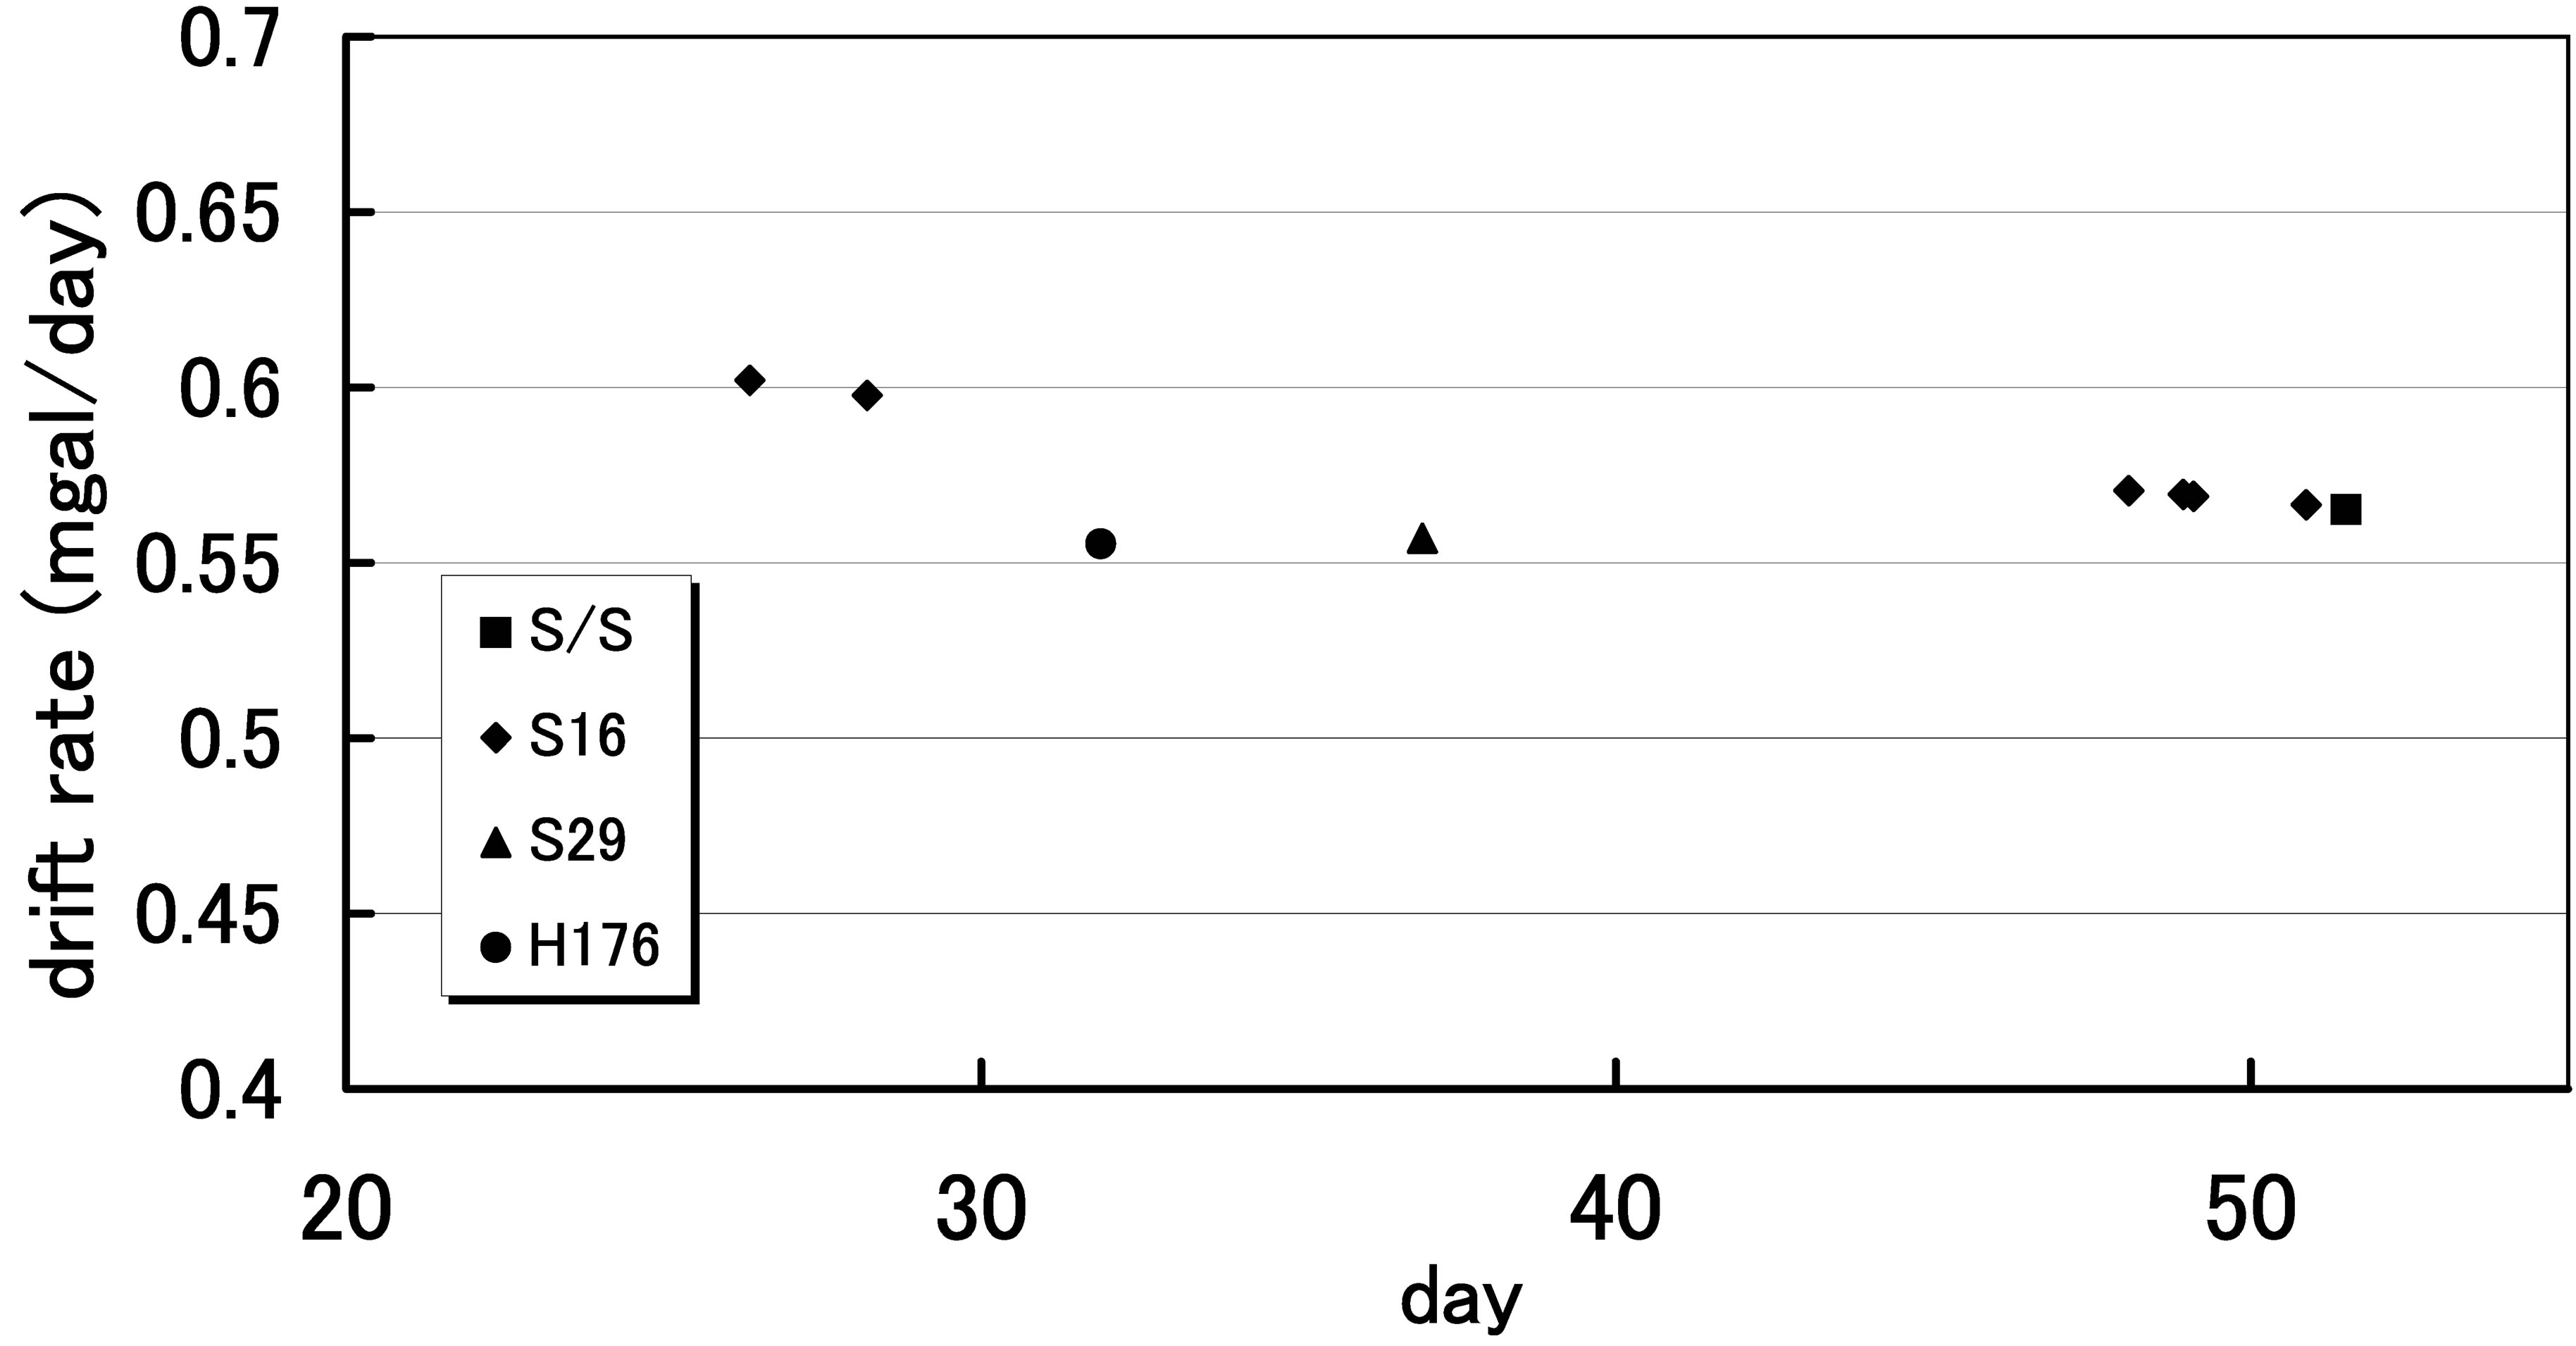
Figure 2. A drift rate of the SCINTREX (CG-3M) gravity meter throughout the measurement period in 1999-2000 field operation.
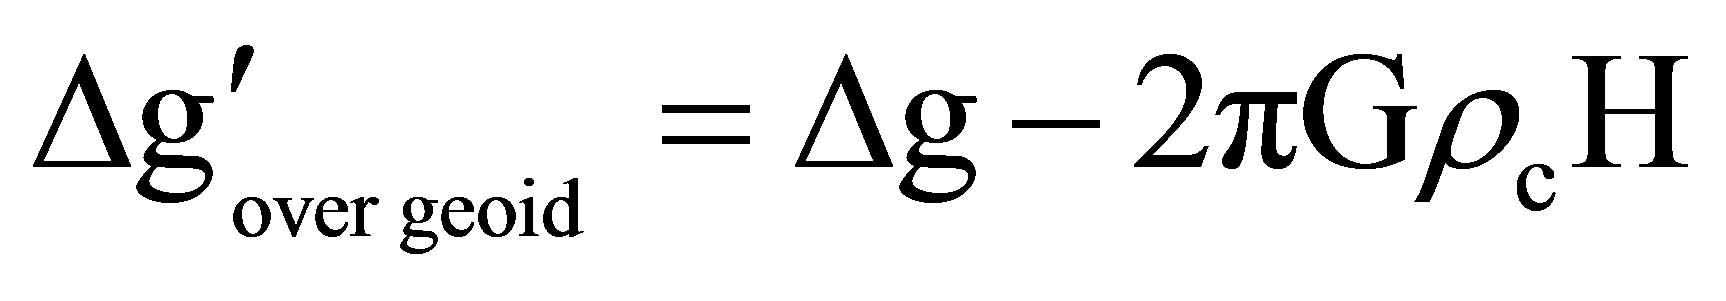
mgal, respectively. H is the elevation of the gravity site in meter and the last two terms of the right hand side in second formula represent the corrections for atmospheric mass effects. The simple Bouguer anomaly Δg' is calculated by the formula,
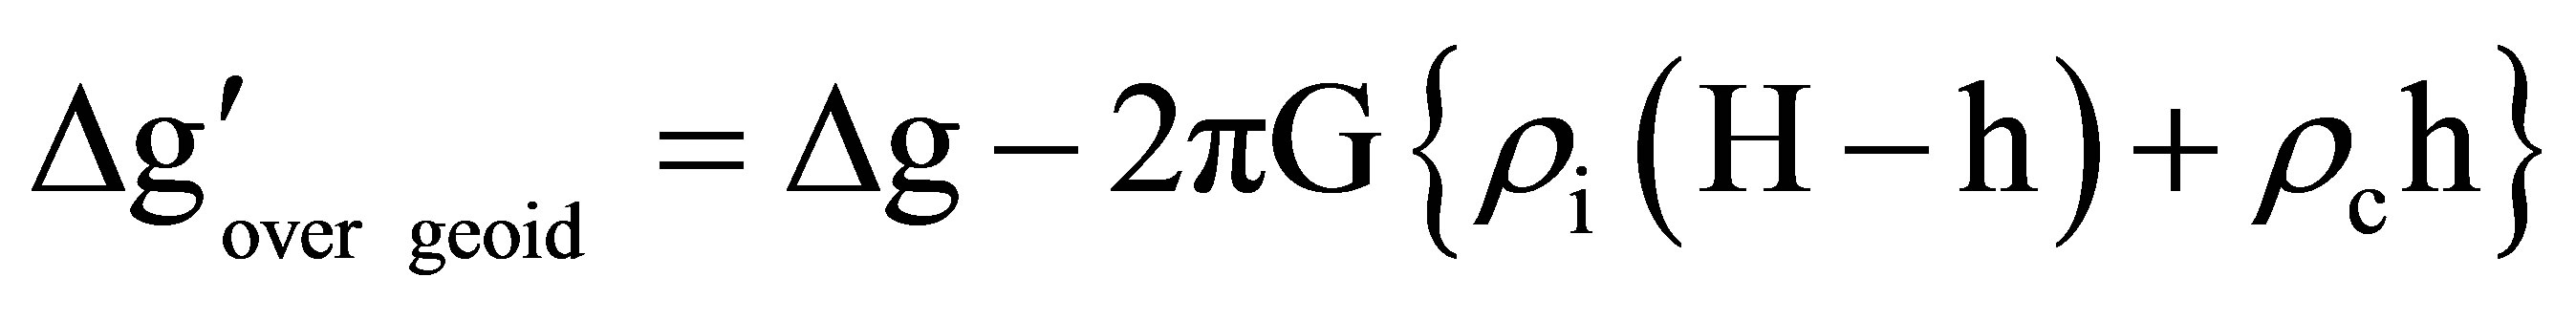
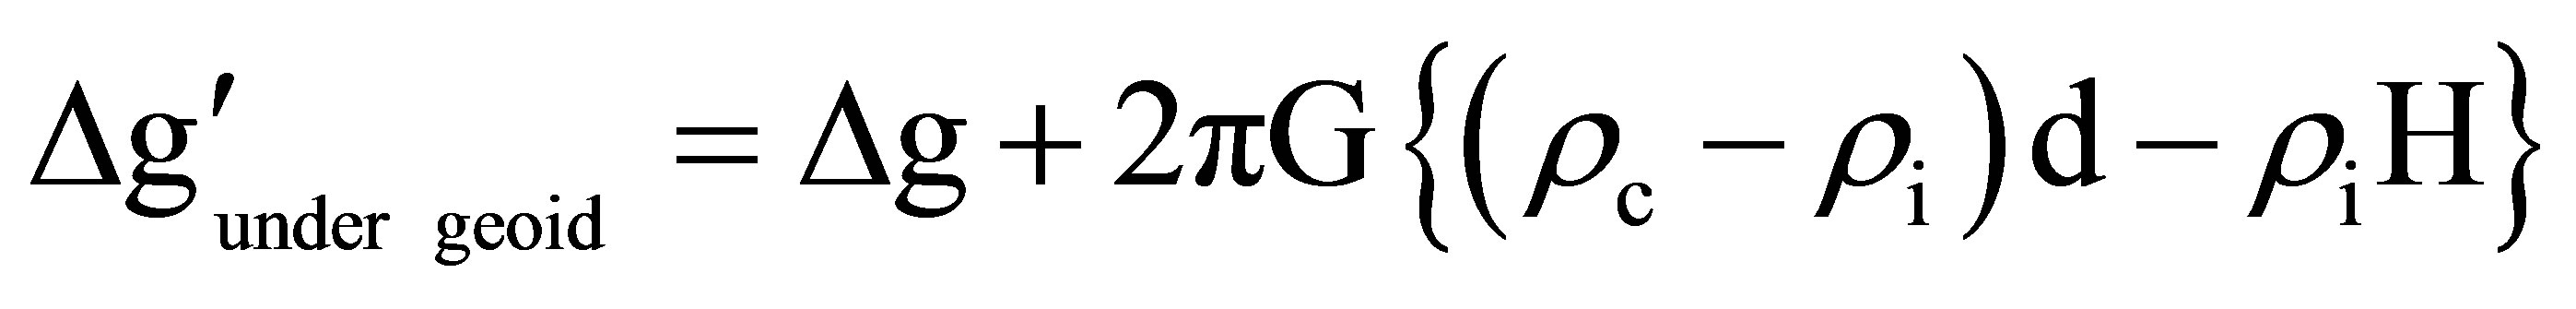
where ,
,  and
and 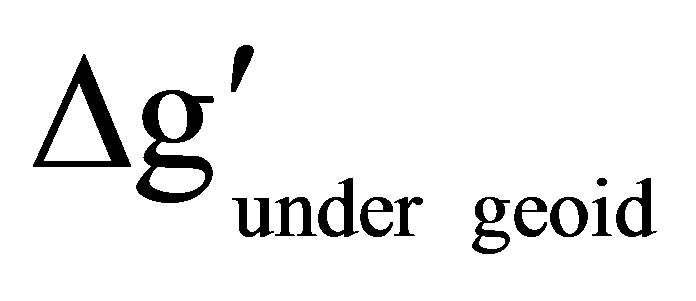 are the Bouguer anomalies of the ice free area, the bedrock elevation over the geoid and the bedrock elevation under the geoid, respectively (Figure 3). The G is the gravitational constant, and ρc and ρi are the density of bedrock (assumed 2.67 g/cm3) and of ice (assumed 0.9 g/cm3), respectively. h and d are the elevation and the depth of the bedrock in meter, respectively. This calculation procedure is the same as that of [12].
Elevation of all gravity measurement sites are determined by GPS positioning on WGS-84 ellipsoid, as mentioned in the previous Chapter. A difference between the GPS height and geoid plane at the astronomical point of Syowa Station was obtained to be 22.2 m [13,14]. The geoid height around the Japanese Antarctic Stations (60˚ - 80˚S, 20˚ - 50˚E) was determined by using both satellite altimeter data and surface gravity data [15]. Hereafter, we refer to the Bouguer anomalies based on the GPS ellipsoid in the following discussion. Practically, there is
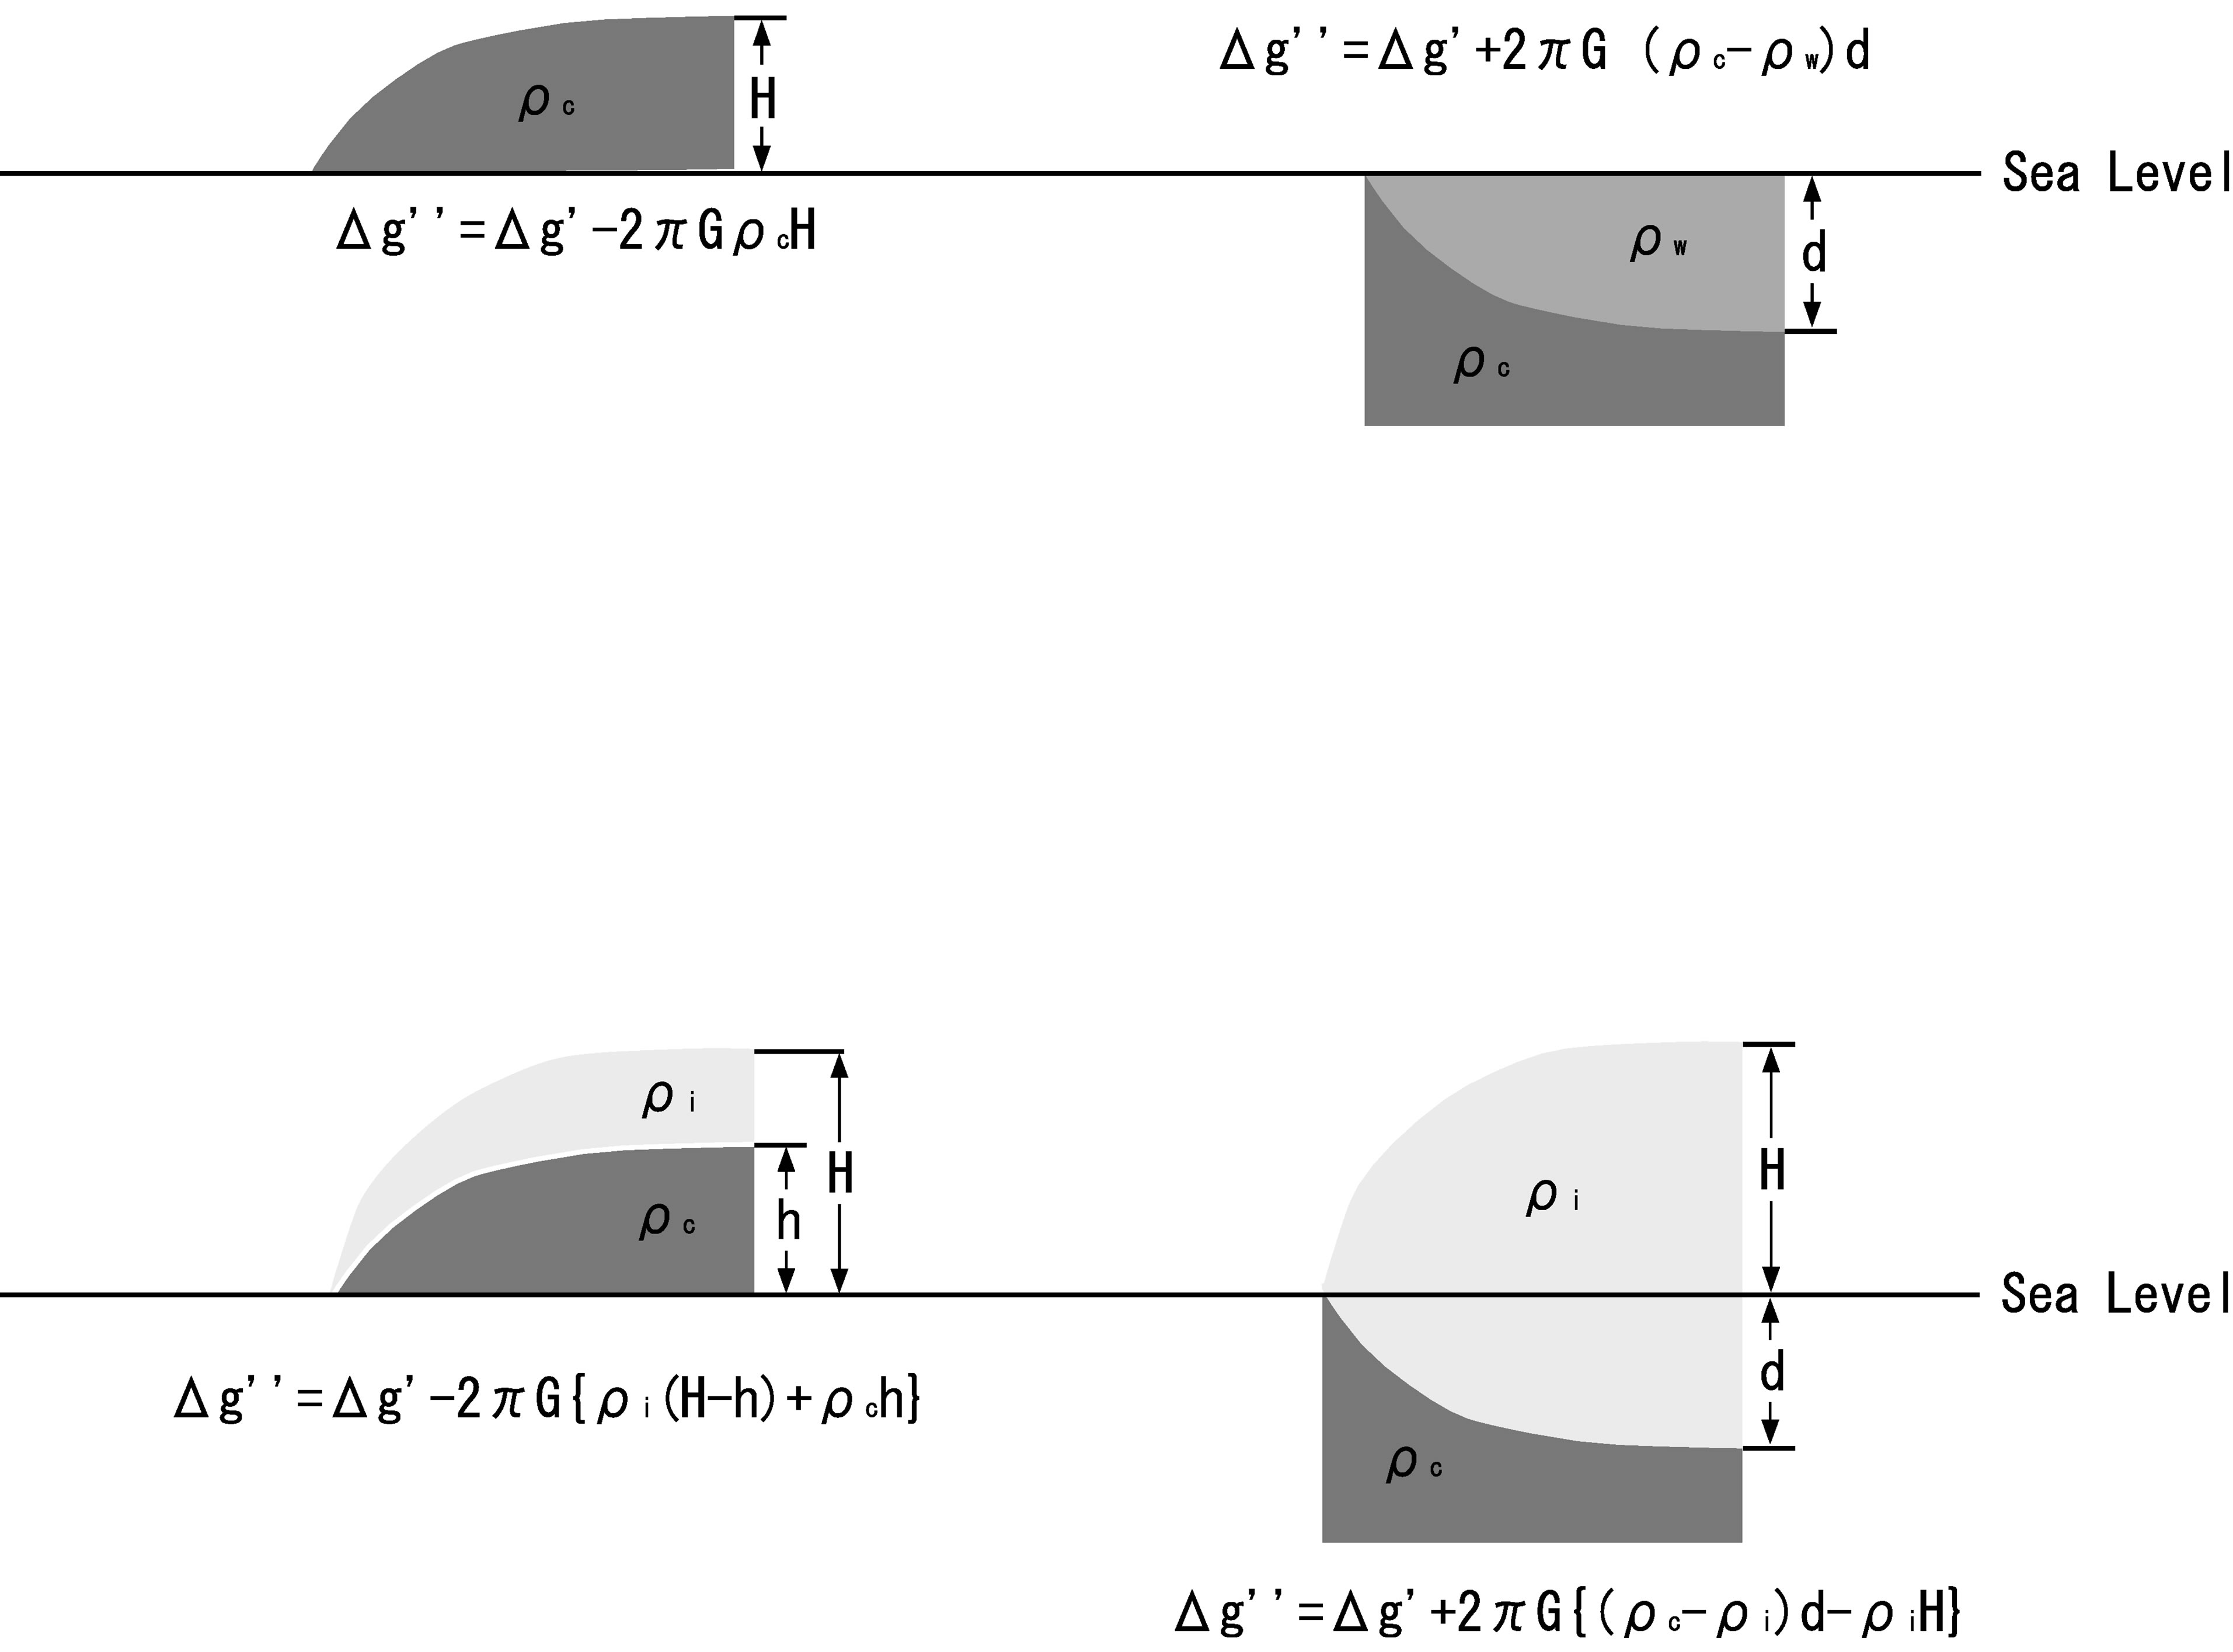
Figure 3. Notation for the Bouguer correction in this study. Upper left and right figures: Land and sea area. Lower left figure: Bedrock elevation over sea level on the continental ice sheet. Lower right figure: Bedrock elevation under sea level on the continental ice sheet. Δg' and Δg" are the Freeair and the Bouguer gravity anomalies, respectively. G is the gravitational constant, and ρc, ρw and ρi are the density of bedrock, sea water and ice sheet, respectively. H, h and d are the surface elevation, the bedrock elevation and the depth in meter, respectively.
no confusion in the interpretation of the result obtained from this elevation.
Elevations determined by GPS positioning included errors less than 1 m, which caused about 0.3 mgal for Free-air anomalies. In calculation of the simple Bouguer anomaly, it is required to remove an effect of the icesheet which overlaying on the bedrock from the gravity values. A thickness distribution of the ice-sheet beneath the survey profile was available from the radio echo sounding results by JARE-33 [16]. They used a 179 MHz radio echo sounding system set on over-snow vehicle, with every 2 km of stopping at least 2 min beside the snow stakes along the traverse routes. [4] obtained an elevation distribution of the bedrock beneath the seismic profile, which is identical to the gravity survey line, by analysis of the travel time data by JARE-41 seismic exploration.
Figure 4 shows a distribution of the bedrock elevations derived from the seismic data; which is different from that obtained by the radio echo sounding, as pointed out by [4]. A maximum error of the bedrock elevations estimated by the radio-echo sounding and the seismic data along the survey profile were about 100 m [16] and 350 m [4], which corresponded to 7 mgal and 25 mgal on the Bouguer anomalies, respectively. However, it is not clear which elevations are actually correct. Therefore, in this paper, we evaluated the simple Bouguer gravity anomalies by using both the data of bedrock elevations. It is also noted that the bedrock elevations beneath all gravity stations are not determined by the radio-echo sounding because of no data achieved. An elevation beneath such the observation sites was evaluated from those of surrounding sites whose elevations are known.
Table 1 present a list of the locations of the gravity measurement sites, the normal gravity values, calculated Free-air and Bouguer anomalies, together with the bed-
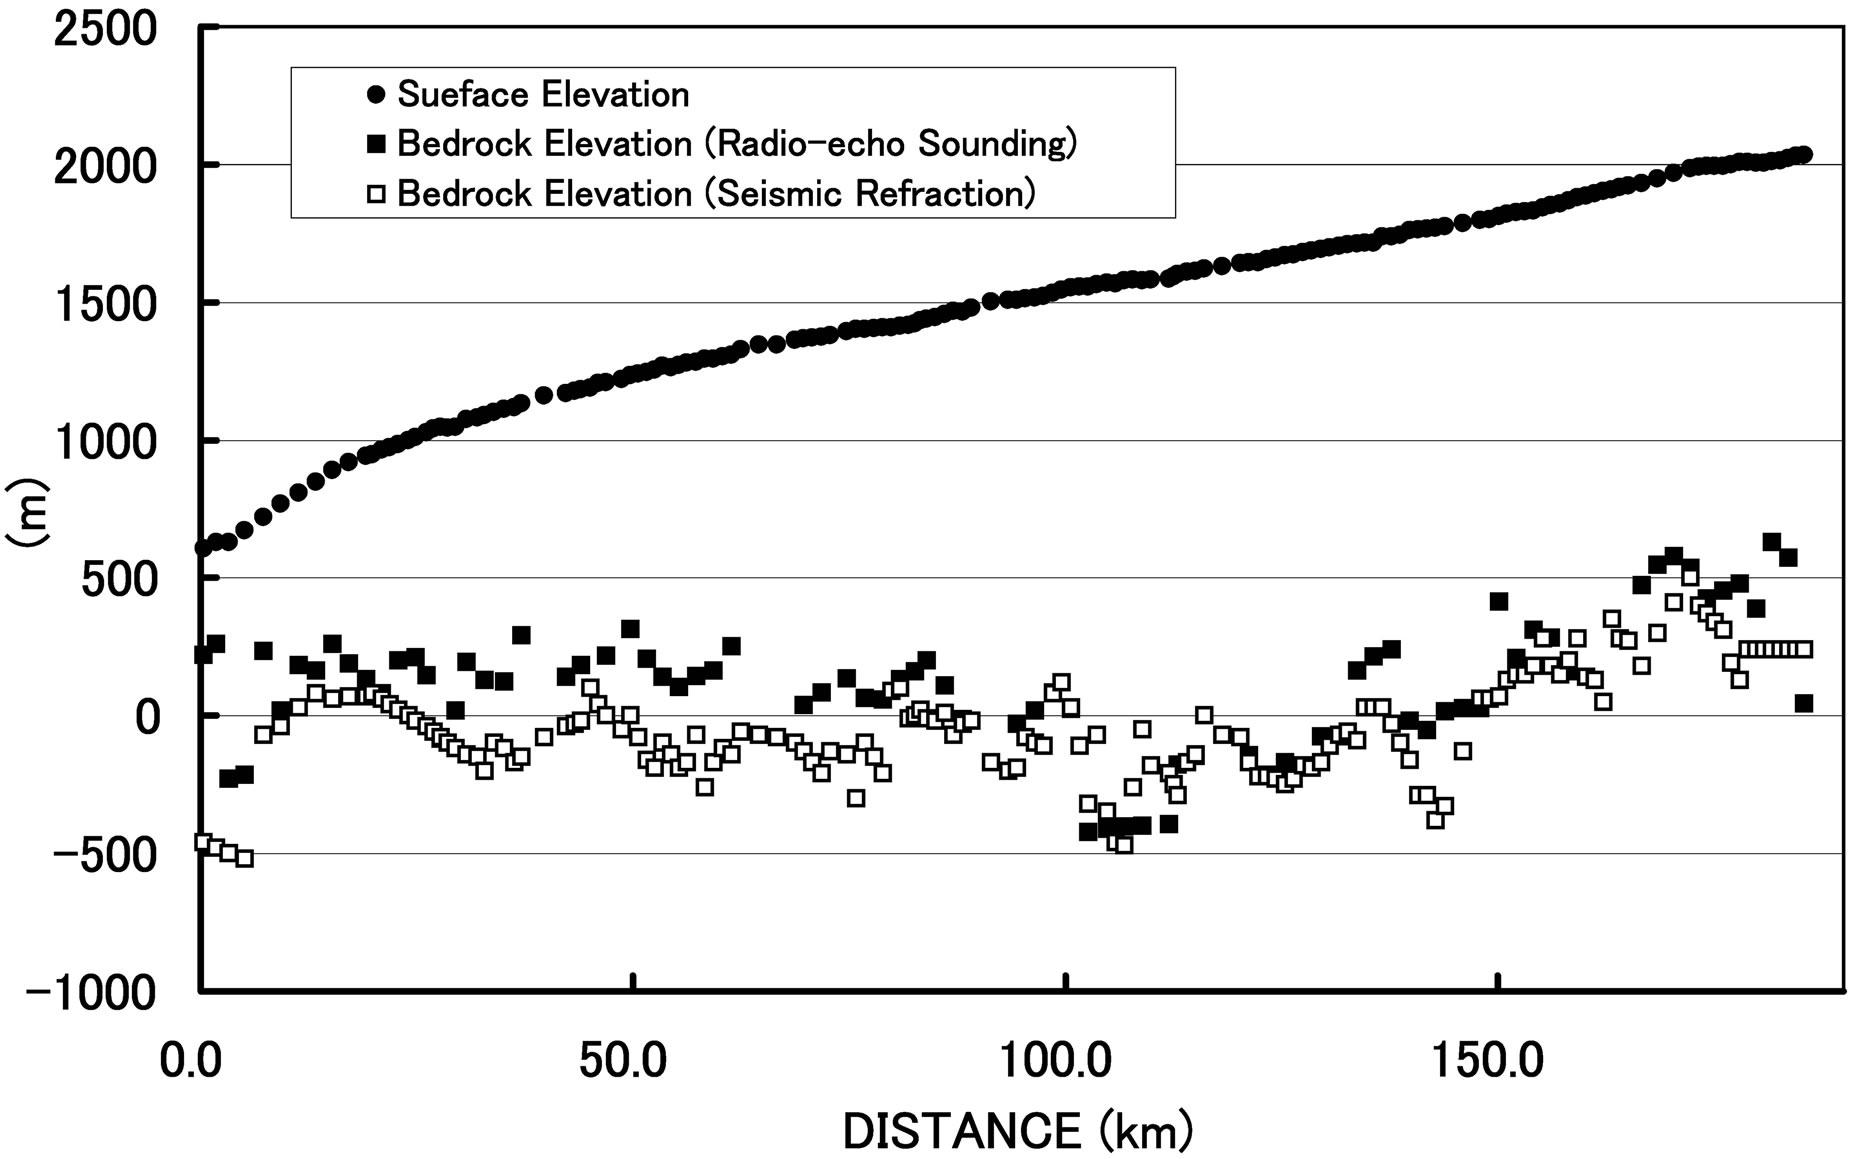
Figure 4. Surface elevation and bedrock topography along the survey line. Solid circles indicate surface elevation determined by the GPS measurements. Solid and open squares indicate the bedrock topography obtained by radio-echo sounding [23] and by seismic refraction survey [6], respectively. The horizontal axis shows a distance from S16 point.
rock elevations used in this study. Free-air and Bouguer anomalies were also illustrated in Figures 5 and 6, respectively.
4. Results and Discussion
4.1. Surface and Bedrock Elevations
The obtained surface elevations (Figure 4) indicate a drastic change around S30 point, from where a slope of the ice-sheet becomes flatter toward the inland. On the other hand, the bedrock topography appears to undulate between +600 m and −600 m throughout the whole traverse routes. It is also recognized that the bedrock elevation obtained by seismic refraction analyses could be deeper than that by the radio-echo sounding (Figure 4). [17] pointed out the discrepancy between the bedrock elevation by radio-echo sounding and by gravity anomaly along the Mizuho routes. This discrepancy might be caused by the considerable errors in ice-sheet thickness [17], otherwise the existence of a mixture layer composed from ice and moraine rocks spreading over the bedrock [10]. The third candidate is the existence of
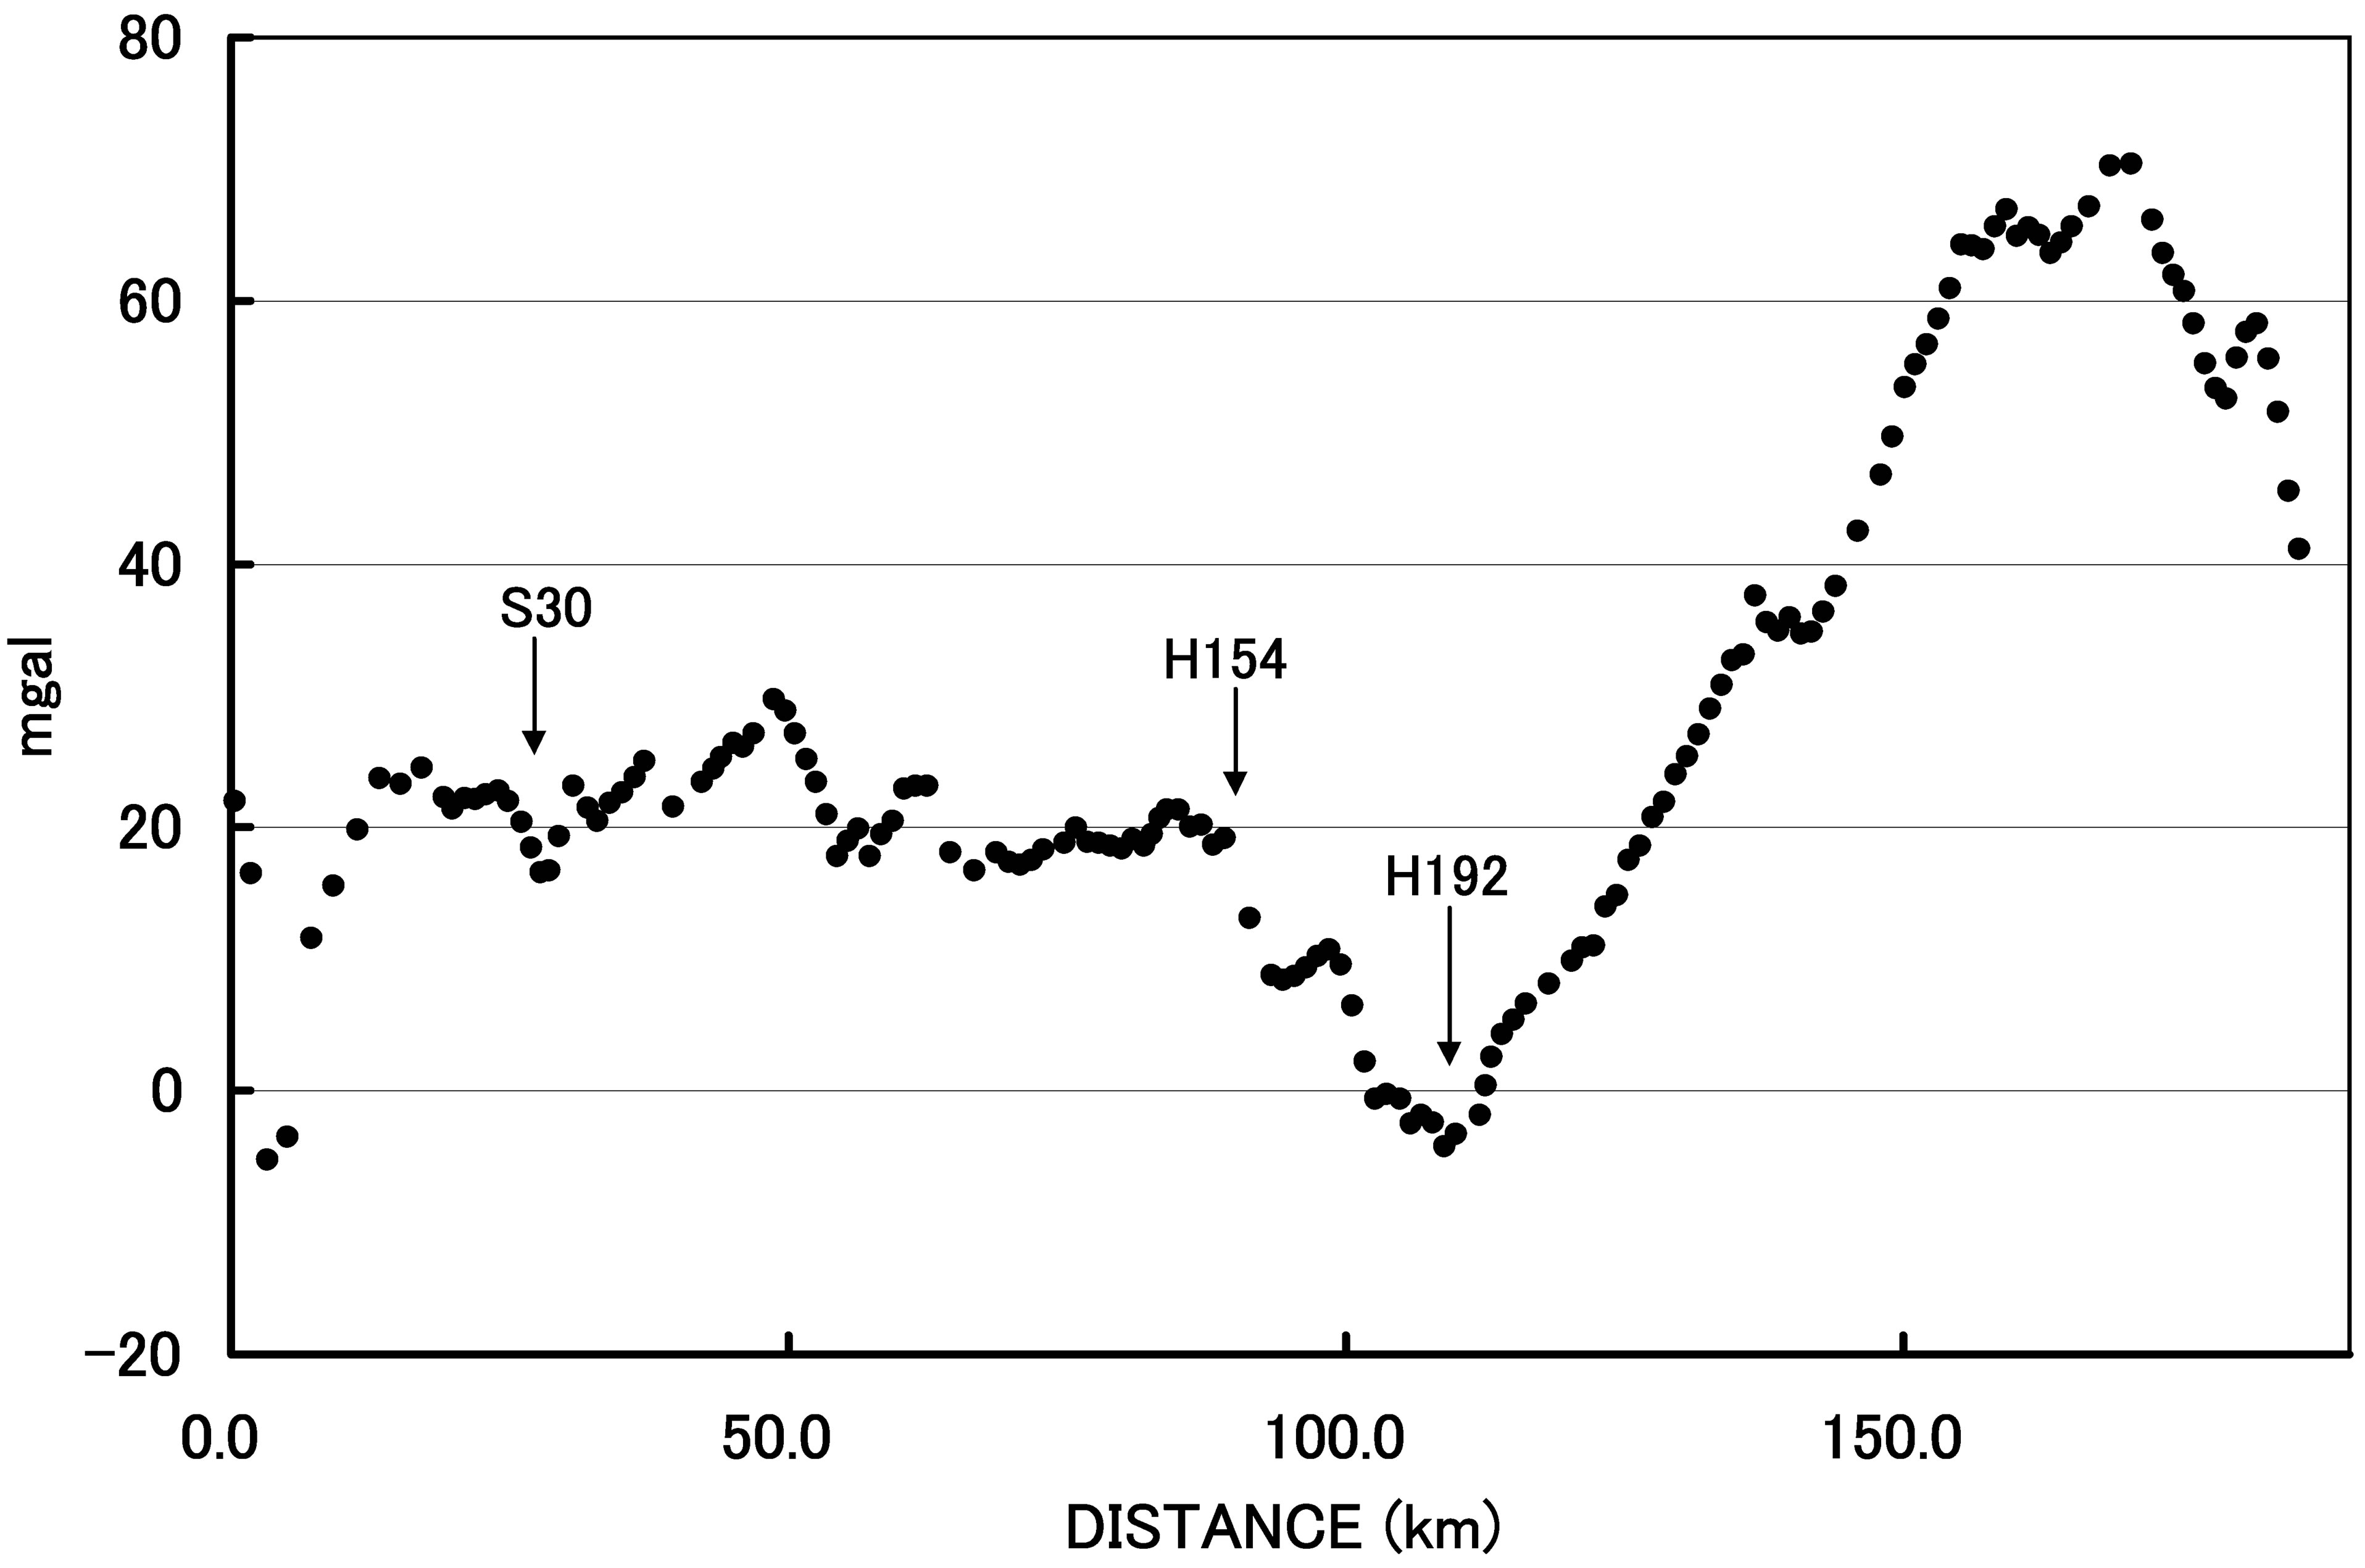
Figure 5. Free-air gravity anomaly along the survey line. The horizontal axis shows a distance from S16 point.
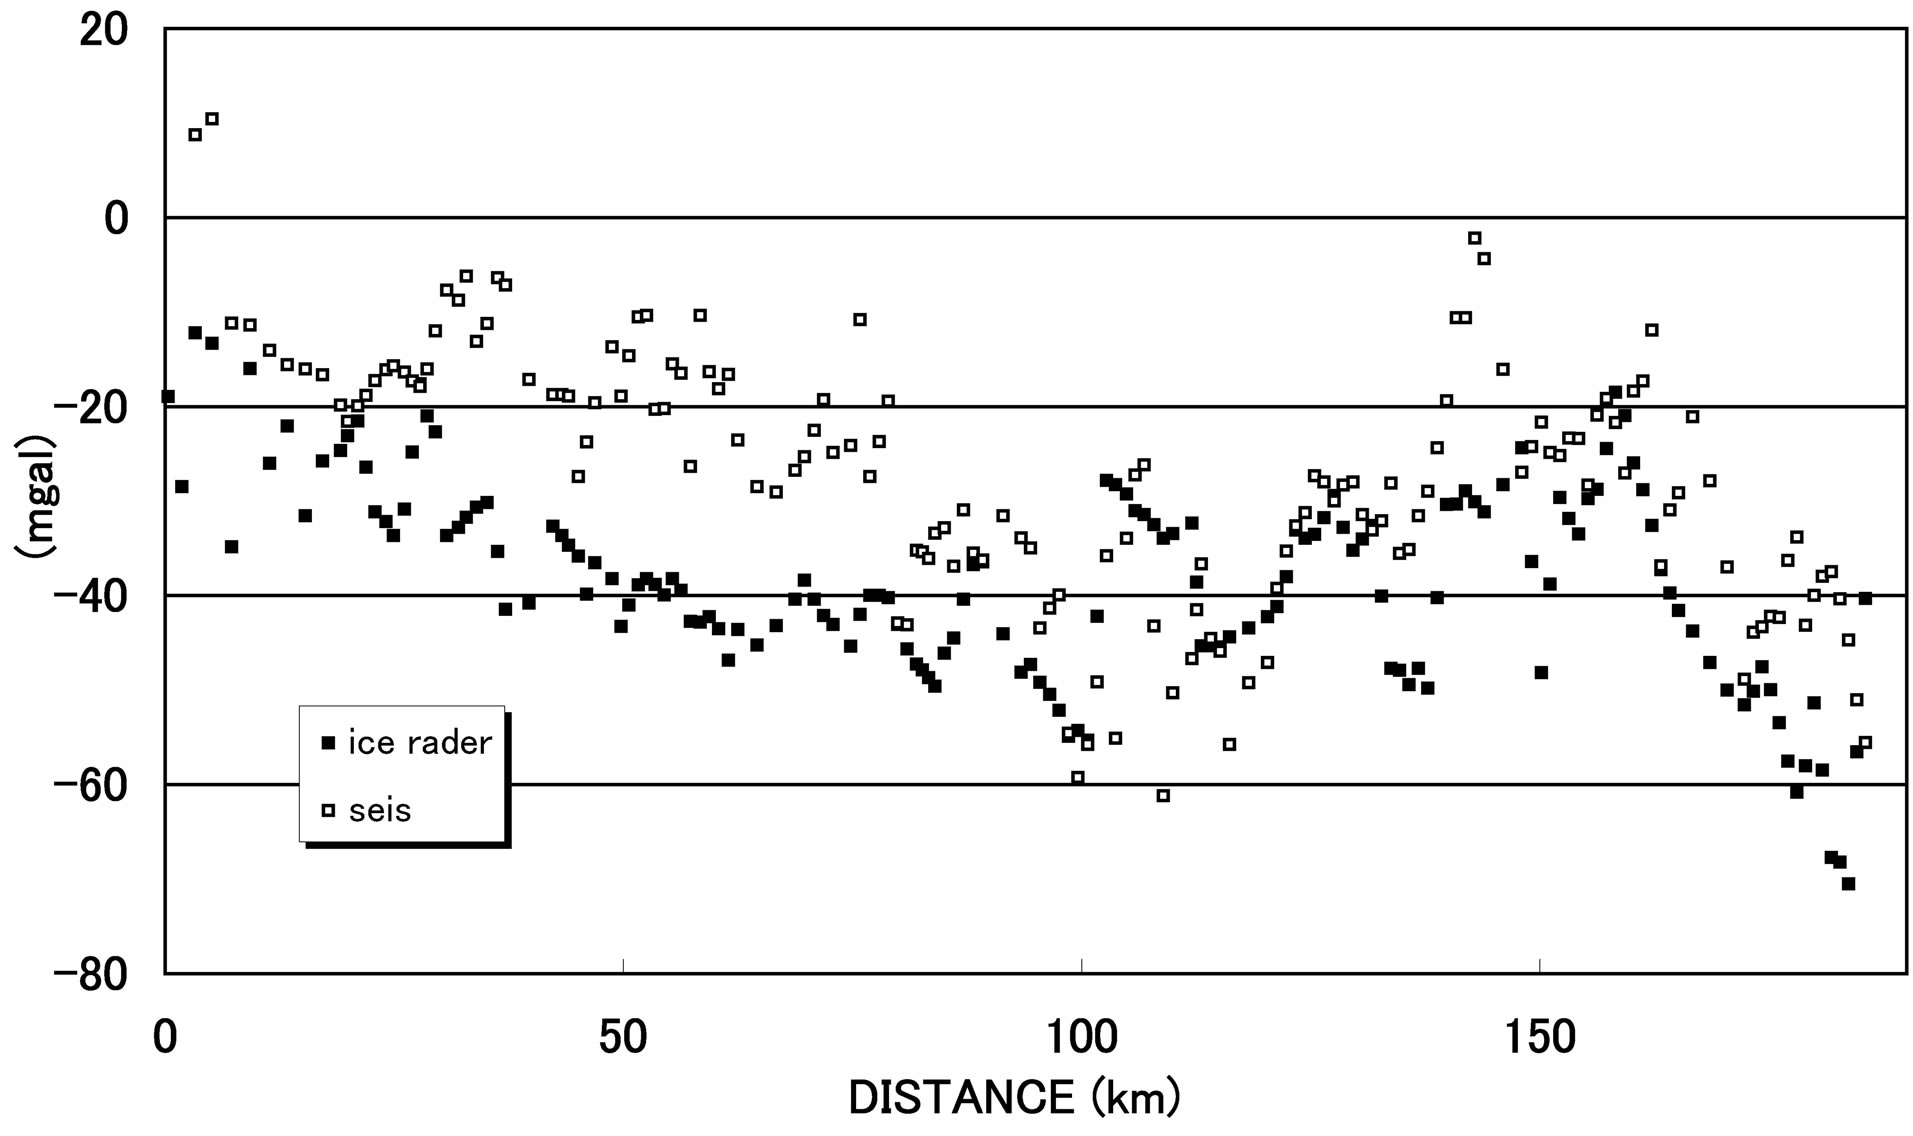
Figure 6. Bouguer gravity anomalies along the survey line. The horizontal axis shows a distance from S16 point. Solid and open squares indicate the anomalies calculated by radio-echo sounding [23] and by seismic refraction survey [6].
sub-glacial lakes along the routes. As the combined researches by both the seismic surveys and radio echo soundings have been scarcely held at the inland part of Antarctic ice-sheet, our results imply the new proxy for detecting the structure and dynamics of sub-glacial environment.
[4] showed the discrepancy of 0.3 km in thickness between the bedrock elevation determined by radio-echo sounding and that by seismic refraction survey along the same traverse routes. They also suggested that it is caused by a difference in resolution of the utilized methods. Resolutions of the radio-echo sounding and seismic refraction analyses represent the ranges in 5 - 85 m and 100 - 350 m, respectively. The other considerable candidate is a difference in a wavelengths used in the two different methods. Generally, the wavelengths are several meters for radio echo sounding, in contrast, a few hundreds meters for seismic refraction analyses. Therefore, if there exist a mixture layer of the ice and moraine rocks just over the bedrock, it is expected that the radio-echo sounding may detect the top of the mixture layer, on the contrary, seismic refraction analyses could detect the bottom of the mixture layer (that is the surface of bedrock).
4.2. Free-Air and Bouguer Anomalies
The furrowed negative Free-air anomalies were discovered by the dense gravity survey around H192 route point (Figure 5). This fluctuation of the short-wavelength gravity anomalies indicates the existence of valleys in the bedrock topography. This portion corresponds to the exact points where no reflected signals from the bedrock are observed by the radio-echo sounding.
Short-wavelength variations in Bouguer anomalies (Figure 6) was considered to be caused by the shallower structure, in contrast, long-wavelength variations for more than 100 km were caused by the deeper structure such as an inclination of the Moho discontinuity. Figure 6 indicates the long-wavelength variations in Bouguer anomalies. A gradual decrease in the Bouguer anomalies is identified between S16 and H192; on the other hand, an increase in the anomalies is found between H192 and Z20 for both the results from seismic and radio echo soundings. In totally, the anomalies decrease gradually down to approximately 40 mgal from S16 to Z20 along the whole traverse routes. The inclination of long-wavelength trend suggests the crustal thickness varies with lateral heterogeneities along the traverse routes. It also suggests that the density discontinuity of the deeper part of the crust gradually change from the coast to the inland area.
Precise gravity anomalies are revealed by the gravity survey with dense observation sites along the Mizuho traverse routes by JARE-41. We compared our result with previous study that by JARE-21 [18] from Syowa Station to Mizuho Station and by JARE-33 [10] and JARE-38 [8] from Syowa Station to Dome Fuji, respectively. A well coincidence between the previous and our study is found in Free-air anomalies except for a few gravimetric stations. The similar tendency can be confirmed in the Bouguer anomalies associated with the difference in the bedrock elevations.
4.3. Crustal Thickness Estimation
[8] estimated the crustal thickness beneath the inland Dome Fuji Station based on the Bouguer anomalies of both at Dome Fuji and Mizuho Station; the Moho depth at Mizuho Station was also utilized by using the following formula:
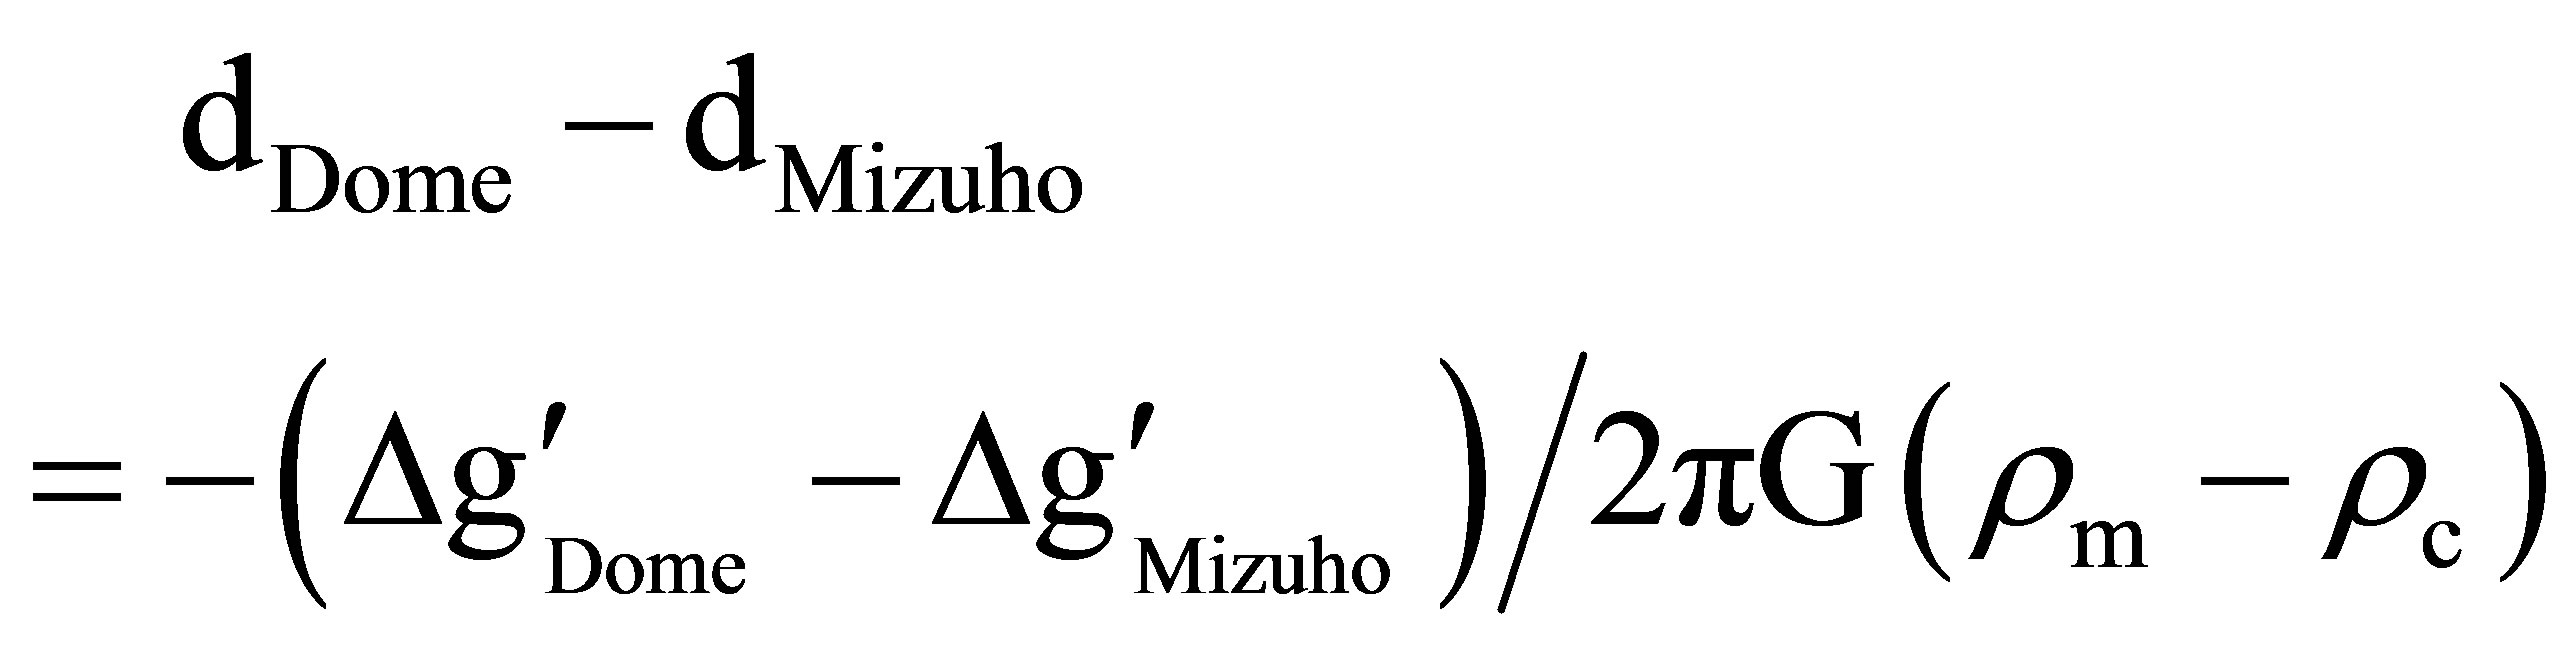
where ρm was the density of the upper mantle (3.27 g/cm3) [26], and Δg'Dome and Δg'Mizuho were the Bouguer anomalies of Dome Fuji and Mizuho Station, respectively. dDome and dMizuho were the crustal thickness of Dome Fuji and Mizuho Station in meter.
In this study, the differences in the Bouguer anomalies determined by seismic refraction survey and radio-echo sounding in both sides of the survey line (traverse routes) were estimated about 24 mgal and 13 mgal by Leastsquares method. The different thickness of the crust between inland and coast along the survey line (190 km in length between S16 and Z20) was calculated about 1 km and 0.5 km based on the concept of [8] as mentioned above paragraph. (We replaced the suffix of Dome and Mizho in the formula of [8] into Z20 and S16, respectively). These results indicate that the inclination of the Moho discontinuity is rather gentle than the previous studies obtained by much sparser station distribution. According to [10], the depth of the Moho discontinuity was calculated from the method of [20] as 40 km beneath S16 route point (coastal side) and as 43 km beneath Mizuho Station (inland side) below the sea level. The inclination of the Moho discontinuity in this study could be within the estimation errors with the crustal density model by [10]. Moreover, the results obtained by this study have ten times higher spacial resolution compared with those by [10], it is more incredible model and represents the realistic crustal structure. High bedrock topography, and corresponding high Free-air gravity anomalies around the Latitude 70˚S may affect the relatively high Bouguer anomalies at the same location along the routes.
5. Conclusion
Gravity survey was carried out with a dense station-interval about 1 km along the traverse routes on the Mizuho Plateau, during the 1999-2000 seismic exploration. The furrowed negative Free-air anomalies about 10 mgal was observed around H192 route point. Two models of the bedrock elevation by radio-echo sounding and the seismic refraction survey suggest the existence of the top and the bottom of a mixture layer composed from the icemoraine rocks spreading over the bedrock. Thickness of the crust estimated by Bouguer anomalies is 0.5 - 1 km larger toward inland at the southern terminal point of Z20.
6. Acknowledgements
The authors would like to express sincere thanks to their collaborated investigators who provided valuable assistance in the field operation of JARE-41: M. Yanagisawa, T. Minta, Y. Shimoda, N. Imae, H. Yamashita, S. Nomoto, J. Matsunaga. We are also grateful to all the other members of JARE-41 (lead by Profs. M. Ayukawa and K. Watanabe), members of JARE-40 (the leader Prof. Miyaoka) and crews of icebreaker “Shirase” (the captain S. Shigehara). They wish to express our thankfulness to Profs. K. Kaminuma, K. Shibuya, Y. Nogi and other staffs of the National Institute of Polar Research. They would also like to express sincere acknowledgments to Prof. Y. Fukuda of Kyoto University for many helpful suggestions and assistance in analysis of gravity data.
NOTES