1. Introduction
International debates about reduction of greenhouse gas emissions, such as the debate surrounding the Kyoto Protocol, are in progress, focusing on the participation of developed countries. In these debates, signatory countries are classified into two groups: obligatory participants and voluntary participants. Most of the obligatory participants are developed countries, such as the OECD (Organization for Economic Cooperation and Development) member countries, while most developing countries are considered voluntary participants.
International protocols usually set the reduction targets for greenhouse gas emissions for the developed signatory countries. According to the Kyoto Protocol, the target for each developed country is to reduce greenhouse gas emissions by an average of 5%. In the near future, the PostKyoto Protocol will require the developed signatory countries to reduce greenhouse gas emissions further.
These countries need to consider introducing nationwide legal systems to address international regulations. Nationwide greenhouse gas-related policies can address how to induce domestic industries and companies to reduce emissions. A national government can introduce a greenhouse gas emissions allocation system (“carbon taxes”) that gives an allowance of greenhouse gas emissions to each firm or institutionalizes a carbon trading system. A number of countries, especially OECD countries, have implemented carbon tax systems for greenhouse gas emissions. In many cases, carbon taxes are levied on energy-consuming activities (e.g., electric power generation, operating facilities, and running machines) and motor vehicle activities (e.g., transportation and heavy equipment operation).
Along with a carbon tax system, a carbon trading system can be an effective method for controlling worldwide greenhouse gas emissions. In 2005, the EU implemented the EU ETS (emissions trading system), which is a European policy to cope with climate change and reduce industrial greenhouse gas emissions in a cost-effective manner. Because carbon trading gives companies incentives to reduce their greenhouse gas emissions, the use of carbon trading is expected to become more widespread throughout the world.
In this study, we assume that government regulations pertaining to greenhouse gas emission allowances are constantly being enhanced, which can contribute a huge amount to the cost.
From the perspective of a supply chain involving various firms, such as suppliers, manufacturers, distributors, and retailers, the cumulative greenhouse gas emissions per unit product increase as materials and products move from one stage to the next. A supplier’s raw materials can include carbon, which will contribute to greenhouse gas emissions during production, and the transportation of those raw materials results in greenhouse gas emissions by transporting vehicles. A manufacturer can generate greenhouse gases during the production (e.g., operating machines) and also during transportation of products from the manufacturer to the distributor. The distributor maintains inventories, which also results in greenhouse gas emissions, albeit in an indirect way (e.g., using electricity to refrigerate foods). Transportation of products from the distributor to the retailer also generates greenhouse gases. Finally, consumers purchase products from the retailer and use them. Transportation of products from retailers to consumers generates greenhouse gases, as does the use of products by consumers, particularly the usage of electricity, which is mainly produced from fossil fuels. In short, as products move along a supply chain from supplier to consumer, the revenue of the firm increases but the cumulative emission of greenhouse gases increases as well.
The objective of this study is to develop a mathematical model to determine the optimal green investment cost in the supply chain, assuming that the allowance of greenhouse gas emissions for a firm will decrease due to expected increases in the stringency of regulations on carbon dioxide emissions. The alternatives for our green investment are as follows: 1) purchasing eco-friendly raw materials that cost more than convention raw materials but whose use in production results in lower CO2 emissions; 2) replacing current facilities with new ecofriendly facilities that have the capability to reduce CO2 emissions; and 3) changing modes of transport from less eco-friendly to more eco-friendly modes.
This paper is organized as follows. In Section 2, we review the literature on green supply chain management. In Section 3, we present a mathematical model for green investment cost optimization in the supply chain. In Section 4, we demonstrate the applicability of the proposed model using a numerical example. In Section 5, we present concluding remarks and suggestions for further research.
2. Literature Review
In this section, we review the literature on green supply chain management (GSCM) issues such as green purchasing, green supply chain planning, and green supply chain design. Reference [1] proposed a green supply chain planning model for aluminum processing processes to consider the environmental effects of the generated supply chain plan. Reference [2] developed a mixedinteger programming model for determining green investment for technology adoption and facility location in terms of both the required cost and the environmental impact. Reference [3] argued that “green purchasing”, “green manufacturing/materials management”, “green distribution/marketing” and “reverse logistics” could be regarded as the key elements of GSCM. Reference [4] proposed a credibility-based fuzzy mathematical programming model to address a green logistics network design problem under uncertain conditions and solved this model using an interactive fuzzy solution approach. The proposed model took into account both environmental and economic aspects in the design of the multi-stage logistics network of interest. The CO2 equivalent index was used to model the environmental impact across the logistics network.
Various studies have been conducted on the validity and efficiency of the implementation of GSCM [5-8]. Reference [5] identified and evaluated hypotheses on eco-friendly purchasing strategies, and [6] examined the components of GSCM, their role, and relative importance through an analytical network process (ANP). Reference [7] conducted a study on the effects of eco-friendly purchasing in supply chains. Reference [8] examined the effects of GSCM from the perspective of managing environmental control systems. Reference [9] analyzed the relation between average SO2 concentration and total environmental investment costs, such as pollution-preventing equipment cost, using a simulation model. The results showed that minimizing total environmental investment costs was not an adequate solution and that positive environmental investments were effective in the prevention of pollution and protection of a healthy natural environment.
In recent years, some studies on GSCM using direct modeling have been conducted. Reference [10] addressed the effort involved in maximizing profit while reducing carbon dioxide emissions in supply chains assuming the existence of a carbon tax and a carbon emissions trading system. Reference [11] developed and solved a mixed integer programming model for a carbon-sensitive supply chain that minimizes emissions throughout the supply chain by taking green procurement into consideration. The analysis results showed that companies could reduce their carbon emissions significantly with the introduction of carbon pricing by decentralizing the supply chain and multi-sourcing to reduce transportation and production emissions. As for sustainable supply chain management (SSCM), which could be regarded as a broader concept than GSCM, [12] summarized the related literature well for those who have an interest in both GSCM and SSCM.
Although green investment has been a key issue in the area of GSCM, there has been little research on the optimization of green investment. Accordingly, the next pressing issue in GSCM might be the optimization of green investment costs to reduce greenhouse gases. Thus, as mentioned in the previous section, a mathematical model for green investment cost optimization needs to be developed. Through optimized green investment, firms will be able to appropriately respond to fast-changing global environmental regulations or issues and strengthen their global competitiveness.
3. Green Investment Cost Optimization
We consider a supply chain network consisting of a supplier, a manufacturer, and a distributor. The supplier provides the manufacturer with raw materials, and the manufacturer produces a product by processing the raw materials or by assembling multiple components that might be made of various raw materials. Each component can be processed on a specific machine; for example, component c1 is only processed on machine m1 or m3. After the manufacturing processes, the final product moves to the distribution center or the consumer via transport modes such as road, rail, air, and marine.
Before proceeding to build a mathematical model, the following assumptions must be made:
A1: The firm owns its supply chain and has the power to control it.
A2: The firm’s supply chain has sufficient production and transportation capacity.
A3: Greenhouse gases are generated along the whole supply chain (e.g., production and transportation).
A4: The firm is given a greenhouse gas emission allowance in accordance with related regulations.
A5: If the total emissions of the firm exceed the allowance, the government imposes a CO2 tax.
A6: If the total emissions of the firm are lower than the allowance, the firm can sell the margin (emissions permit).
A7: Another firm that needs to obtain an emissions permit must buy it from the firm, which wants to sell it.
Raw materials purchased from a supplier have indirect greenhouse gas emissions associated with them which are generated by raw material production processing. In the manufacturing stage, raw materials are transformed into components or products. Greenhouse gases are emitted by chemical processes or assembly processes using electric power. Final products are distributed from a factory to a distribution center by various transport modes (e.g., road, railroad, and air). Each transportation system emits greenhouse gases in the use of fossil fuels or electric power.
Assumptions 4 and 5 indicate that the firm has to meet its allowance level of greenhouse gas emissions if possible. If the firm exceeds this level, a greenhouse gas tax can be charged by the authorities concerned. If the greenhouse gas emissions of the firm are below this level, the firm can sell the surplus on the carbon trading market.
Assumptions 6 and 7 indicate that emission’s trading is a market-based approach used to control pollution by providing economic incentives for achieving reductions in CO2 emissions [13].
We now propose a green investment cost optimization model (GICO model). A mathematical model is established for the cost optimization problem. Without loss of generality, the purchasing lead times and production setup times are not considered in this model. The decision variables of the model are the production quantity, the transportation quantity for each transport mode, the emissions reduction coefficients, raw material costs, manufacturing costs from component to product, transportation costs, investment costs for raw materials, facilities and so on. The tradable permit quantity of CO2 and the excess CO2 emissions quantity have either 0 or positive real values.
3.1. Indices
 : raw material;
 : component;
 : product;
 : machine;
 : transport mode;
 : fiscal year, base year, and target year.
3.2. BOM Parameters
 : amount of raw material r to product one unit of component c;
 : amount of component c to produce one unit of product p;
 : set of components which can be processed at machine m.
3.3. Cost (Profit) Parameters
 : unit GHG tax in time period t;
 : unit CO2 trading profit in time period t;
 : penalty cost of unsatisfied GHG emission target quantities at target year.
3.4. Green Investment Parameters
 : GHG investment ratio in time period t;
 : GHG emissions reduction per unit green investment cost of raw material r in time period t;
 : GHG emission reduction quantities per unit green investment cost of (c, m) in time period t;
 : GHG emission reduction quantities per unit green investment cost of (p, l) in time period t.
3.5. Decision Variables
 : amount of production of product p in time period t;
 : amount of transportation of product p by transport mode l in time period t;
 : actual GHG emission quantities in time period t;
 : GHG emission reduction quantity by green investment in time period t;
 : investment cost of raw material r in time period t;
 : investment cost of (c, m) in time period t;
 : investment cost of (p, l) in time period t;
 : tradable permit quantity in time period t;
 : excess emissions quantity in time period t;
 : unsatisfied emissions quantity in time period t;
 : green investment budget in time period t;
 : unit GHG emissions of raw material r purchased in time period t;
 : unit GHG emissions of component c when processed at machine m in time period t;
 : unit GHG emissions of product p when distributed by transport mode l in time period t;
 : unit cost of raw material r in time period t;
 : unit processing cost of product p by transport mode l in time period t;
 : unit transportation cost of product p by transport mode l in time period t;
 : unit profit of product p in time period t.
3.6. Constants
 : GHG emissions allowed in time t;
 : production capacity of product p in time period t;
 : transportation capacity of transport model l in time period t;
 : transportation load sharing ratio of transport mode l;
 : loading volume of product p;
 : demand of product p in time period t;
 : profit margin rate.
The GICO model can be formulated as follows:
Maximize
 (1)
(1)
Subject to the following constraints:
 (2)
(2)
 (3)
(3)
 (4)
(4)
 (5)
(5)
 (6)
(6)
 (7)
(7)
 (8)
(8)
 (9)
(9)
 (10)
(10)
 (11)
(11)
 (12)
(12)
 (13)
(13)
 (14)
(14)
 (15)
(15)
 (16)
(16)
 (17)
(17)
 (18)
(18)
 (19)
(19)
 (20)
(20)
 (21)
(21)
 (22)
(22)
 (23)
(23)
 (24)
(24)
 (25)
(25)
 (26)
(26)
 (27)
(27)
 (28)
(28)
 (29)
(29)
 (30)
(30)
 (31)
(31)
 (32)
(32)
 (33)
(33)
 (34)
(34)
Equation (1) is the objective function of the GICO model, which includes the total greenhouse gas tax, the carbon trading profit and the penalty cost. In the target year, the firm must meet a greenhouse gas emissions target set by government or the firm itself. If the firm does not meet this goal, the greenhouse gas penalty cost, which is the product of the unit penalty cost and unsatisfied emissions quantities, can be charged. For example, the greenhouse gas penalty cost is $1,000,000 when the unit penalty cost is $1000 per tCO2 and the unsatisfied emissions quantity is 1000 tCO2. This objective function minimizes the total cost of greenhouse gas. The constraints of the model are given as Equations (2) to (34).
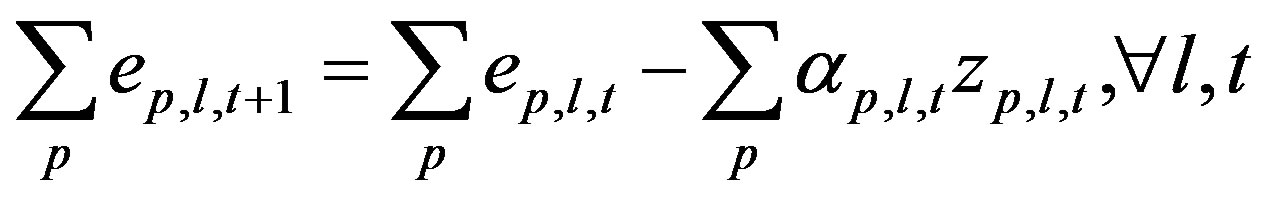
Equation (2) is the CO2 emissions balance equation, according to which current actual CO2 emission quantities minus reduction quantities through green investment minus greenhouse emissions allowed plus tradable emission quantities minus excess emission quantities equals zero. Equations (3) and (4) define total CO2 emissions quantities accumulated from raw material to final product in the supply chain and the green investment cost of raw materials or manufacturing and transportation facilities. Equations (5) and (6) define mutually exclusive constraints for CO2 emissions excess or surplus. If the tradable permit quantity is positive, the excess emissions quantity is zero. Similarly, if the excess emissions quantity is positive, the tradable permit quantity is zero.
Equation (7) implies that the reduction quantities achieved by green investment are at most the current emission quantities.
We assume that the actual CO2 emission quantities exceed CO2 emissions allowed in time period t0. As mentioned earlier with respect to Assumption 4, this implies that the firm needs to reduce CO2 emissions in the supply chain in accordance with the related regulations. The alternatives for reducing CO2 emissions are bearing a greenhouse gas tax burden or CO2 trading.
The firm must meet the CO2 reduction target by time tT. In other words, the firm must reduce CO2 emissions in the supply chain from the base year t0 to the target year tT. Though the firm is obliged to meet the CO2 reduction target identified by government regulations, ever-increasing demand for products will increase total CO2 emissions. This means that the firm may not meet the CO2 reduction goal. In view of this situation, we assume an unsatisfied emissions quantity in target year T and add the related penalty cost from Equation (1). Equation (8) describes the CO2 reduction target constraint at time tT.
Equations (9) and (10) imply that the unit cost of raw material r in time period t + 1 increases by the green investment of raw material r divided by total raw material quantities purchased in time period t compared to the previous year. The GICO model focuses on green investment decision-making ensuring minimum economic profit and minimizing total CO2 cost. Thus, we can assume production quantities equal to production demand, according to Equation (24). Equations (11) and (12) imply that the unit CO2 emissions coefficient of raw material r in time period t + 1 decreases by the CO2 emission reduction quantities divided by total raw material quantities purchased in time period t. This signifies return on green investment, which results in the use of eco-friendly raw material with lower CO2 emissions than conventional materials.
Equations (13) and (14) imply that the unit cost of processing component c with machine m in time period t + 1 increases by the green investment of machine m divided by the total number of components, compared to previous year. Equations (15) and (16) imply that the unit CO2 emissions coefficient of processing and assembling component c with machine m in time period t + 1 decreases by CO2 emission reduction quantities divided by the total number of components processed with machine m in time period t. As with Equations (11) and (12), these equations mean that green investment in processing facilities results in eco-friendly facilities with low CO2 emission rates.
Equations (17) and (18) imply that total transportation costs by transport mode l in time period t + 1 are equal to total transportation costs by transport mode l in time period t plus the investment cost of transportation facilities in time period t. Equations (19) and (20) imply that the unit CO2 emissions coefficient of transportation facilities in time period t + 1 decreases by the CO2 emission reduction quantities from green investment in transportation facilities in time period t.
Equation (21) is a budget constraint, and Equation (22) implies that the total budget in time period t + 1 is determined by the product of the greenhouse gas investment ratio and the total profit. For example, if the total profit is $1,000,000 and the greenhouse gas investment ratio is 5%, the total budget available during time period t+1 is $50,000. From Equation (23), the total profit is calculated as the fixed ratio to the total cost. We assume that the profit margin rate is 10%.
Equation (24) is the demand constraint for each product. As mentioned previously because the proposed model focuses on green investment decision-making for minimizing total CO2 cost, we assume production quantities equal to production demand to evaluate the impact on green investment only.
Equation (25) is the transportation network constraint for each product, and Equation (26) is the transportation mix constraint for each transport mode. The transportation load sharing ratio of each transport mode in Equation (26) can be determined using national transportation statistics data.
Equations (27) and (28) are production and transportation capacity constraints, respectively. Transportation capacity is dependent on the product of the product volume and production quantities. Equations (29)-(34) are nonnegativity constraints.
The solution of the model yields green investment values for various alternatives, and these result in the replacement of raw materials and facilities by new ones. The value of greenhouse gas emissions at time t, namely current total emissions GHGt, is expressed by Equation (35).
 (35)
(35)
We introduce the concept of a Green Index (GI) to evaluate the current status in comparison with the base status and target status, using Equation (36). GI has a value between 0 and 1. The GI equals 1 when the greenhouse gas emissions target is met.
 (36)
(36)
4. Illustrative Example
To demonstrate the applicability of the proposed model, a case study based on a real situation in South Korea is presented. Though South Korea is not an obligatory participant in the Kyoto Protocol, the South Korean government aggressively set the reduction target for nationwide greenhouse gas emission at 4% below the 2005 level by 2020 to prepare for the Post-Kyoto mechanism, which will require the active participation of developing countries. This reduction target corresponds with 30% below BAU (business as usual). The BAU refers to the predicted level of greenhouse gas emissions that will be reached by a certain year if emissions increase at the current pace.
To meet the international requirements for greenhouse gas emissions reduction, the South Korean government is considering launching greenhouse gas emissions allocation and controlling systems. To address the Post-Kyoto mechanism, the government will expedite implementation of a carbon tax system and a carbon trading system. The South Korean government will introduce a capand-trade system for carbon dioxide in 2015. However, the greenhouse gas reduction plan still faces differences of opinion among policymakers and businesses concerning the feasibility of greenhouse gas emissions reduction by target year. Nevertheless, many companies in Korea will consider alternatives to greenhouse gas emissions reduction ranging from tax burdens to green investment.
We assume that there is an electronics company (Company A) in Korea that produces four types of products, namely, DRAM/flash memory, mobile phones, LCDs, and TVs. Company A has three factories, three distribution centers, and nine submarkets in the domestic market. The production and distribution facilities can be divided into three areas, namely, a metropolitan area, a southwestern area, and a southeastern area. The metropolitan area contains factory 1 and distribution center 1. The final products produced at factory 1 are gathered at distribution center 1. Products stored at distribution center 1 can be directly distributed into submarket 6 by truck or distributed into distribution center 2 and subsequently to submarket 7 by rail. We also assume that the following three transport modes exist: road, railroad, and air. In terms of transportation cost, road transportation is the most efficient of the three transport modes. In terms of carbon emissions, air transportation may be the worst of the three transport modes. We consider real situations and assume that the more expensive a transport mode is, the lower its carbon emission rate is, except for air transportation.
From the financial and sustainability report of Company A, we can calculate and estimate values of the costrelated parameters and CO2 emissions-related parameters [14]. We extract domestic revenue and cost data from globally integrated data and domestic market share data. Table 1 shows the supply chain information of Company

Table 1. Supply chain information of company A.
A, which consists of total revenue and unit cost for each product type and the CO2 emissions from raw material to customer. We assume that the total cost of each product is 70% of the total revenue and that total sales are calculated using estimated unit costs and total costs.
For example, the total revenue, total cost, total sales, total CO2 (unit: tCO2), and unit CO2 (unit: tCO2) for memory (P1) are 3880, 2716, 271,607,000, 1,776,757, and 0.0065, respectively. Similar to the memory, the revenue, cost, sales, and CO2 values are generated for the other three products: mobile (P2), LCD (P3), and TV (P4).
Then, we can calculate and estimate the unit raw material cost, unit assembly cost, and unit transportation cost of each transport mode. The raw material cost and assembly cost are calculated by multiplying the unit production cost by 30%. The cost of road transportation is calculated by multiplying the unit production cost by 40%. We assume that the cost of rail transportation is 150% of the road transportation cost and that the cost of air transportation is 200% of the road transportation cost. Air transportation is the most expensive of the three transport modes but is the worst transport mode in terms of carbon emissions.
Similarly, we can calculate and estimate unit CO2 emissions coefficients for raw material costs, assembly, and transportation. The unit CO2 emissions coefficient of P4 is greater than that for any other products, but the total CO2 emissions quantity for P2 are greater than for that of P4. To comply with the greenhouse gas emissions regulations, therefore, the company must control and reduce these coefficient values by priority.
Cost parameters, except cGHG and ctrade and CO2 emissions-related parameters, are generated using publicly available information about Company A. For example, total revenues for the company’s four products and domestic market share data are used to generate cost parameters.
To focus on the impact of cost and CO2 emissions on green investment, we apply a simple BOM and logistic structure in which one product is composed of one component, one component is composed of one raw material, and four products are manufactured in one factory and subsequently, distributed through one distribution center. We choose $15 per tCO2 for cGHG, which is regarded as a typical carbon emission tax rate, and $20 per tCO2 for ctrade (Metcalf, 2007). The initial CO2 reduction rates per unit green investment cost are set using the greenhouse gas reduction results for 2011. In 2011, Company A invested $360,700,000 in greenhouse gas reduction facilities and $342,300,000 in eco-friendly operations, which are different from traditional eco-unfriendly operations. As a result, the company was able to reduce greenhouse gas emissions by 346,000 tCO2. With this information about CO2 reduction, we can determine the CO2 emissions reduction per unit green investment cost of raw material, assembly, and transportation. For example, the CO2 emissions reduction coefficient of raw material is 0.0001477 tCO2/$, which implies that if the company purchases eco-friendly raw material for $1,000,000 instead of conventional raw material for $5,000,000, the company can reduce CO2 emissions quantities equivalent to the extra price. Thus, the CO2 emissions reduction quantity is 0.0001477 tCO2/$ times $5,000,000.
To verify the GICO model, we use the MILP (mixed integer linear programming) module of the ILOG OPL Development Studio 14.0 software tool. The basic model is based on the current situation in which product demand is ever increasing but regulation of CO2 emissions is becoming stricter. We assume that demand increases at a rate of 5% per year and also assume that maximum CO2 emissions quantities allowed are decreasing at a rate of 5% per year.
The basic model results are as shown in Figure 1 and can be analyzed in both economic and environmental terms. First, actual CO2 emission quantities increase when demand increases and maximum CO2 emission quantities allowed decrease. Thus, excess emission quantities in time period t increased by the corresponding amount, i.e., the gap between actual CO2 emissions and maximum CO2 emissions allowed. Second, the company cannot invest in eco-friendly raw materials, facilities, and transportation infrastructure because the earned value from green investment is less than the investment amount. Based on these analysis results, we can appreciate why the company hesitates about green investment. Third, the company cannot achieve the CO2 emissions reduction goal for the target year. Increasing demand and more stringent CO2 reduction policies compel the company to accept CO2 tax burdens and penalty costs instead of making green investments.
5. Conclusions
The objective of this study is to develop a mathematical model to determine the optimal green investment cost in a supply chain environment in which a company’s allowable greenhouse gas emissions are expected to decrease because of increasingly stringent restrictions on carbon dioxide emissions. Our mathematical model considers the several alternatives for green investment, and the model is verified by the results of a case study.
The current study has several limitations. First, although the case study involved analysis of real company data, the company’s detailed production plans and logistic network are not considered in the experimental design. Second, the assumptions about production environments also limit the study because inventory holding costs and operational electricity usage in the supply chain are not
considered separately. Third, the lack of greenhouse gas emissions reduction figures for new raw materials or new facilities limits the model to being based on publicly available statistical data.
As nationwide regulations on greenhouse gas emissions are enhanced, greenhouse gas emissions allowances will decrease. Therefore, companies will decide to invest at different points to reduce greenhouse gas emissions by means of environmentally friendly process improvements or will buy carbon emission permits from the carbon trading market. Nevertheless, the gap between actual CO2 emissions and maximum CO2 emissions allowed exists, and this gap cannot help but cause difficulties for companies in investing in eco-friendly infrastructure. In other words, companies must reduce total production quantities to meet the target level of greenhouse gas emissions.
The proposed GICO model can be used as a decision-making tool and as a negotiation tool between government and industries. It can assist companies in assessing the feasibility of green investment and can assist policymakers in assessing the effectiveness of greenhouse gas regulations.