1. Introduction
Driving a vehicle is a common task for humans either to transport them from one place to another for the purpose of work or entertainment or any other purpose to bring them from one point to another. Thus, the amount of usage of the vehicle for human use is large. Therefore, it is important to not only ensure that the driver is operating the vehicle safely, but also to ensure that the driver's posture while sitting is both safe and comfortable. Else, the driver can be in an awkward posture, which will eventually lead to injuries to the body parts or muscles known commonly as musculoskeletal disorders (MSD). Musculoskeletal diseases are often caused by poor workstation design, particularly with display screen equipment (DSE) and manual handling of loads [1] .
There is an important need to study the sitting postures of drivers for car vehicles. The reason simply is that in most developed countries in particular Singapore, most people use car vehicles as a means of transport to get from one point to another. The rise of demand for car vehicle usage is seen more in recent times now, due to the emergence of new technology of using app services for transport services such as Grab, Gojek, Uber etc. With this emergence of new methods of transport service, more drivers are observed, on the road with a high level of car vehicle usage for prolonged hours. Travelling by car usually involves being in a seated position over a substantial amount of time. This static sitting is known to cause physical fatigue and restricted postures lead to a higher risk of musculoskeletal complaints [2] .
Hence, the need to conduct a study and analysis for the drivers to ensure safe and good working and sitting posture during their driving experience signifies such a demand in research works. This research paper entails such study and analysis on the sitting posture of drivers and whether there is any existence of any ergonomic risks prevailing. Thus, the hypothesis set is to prove there is any existence of ergonomic risks to drivers by studying their sitting posture in car vehicles. Ergonomic is essentially fitting the workplace to the worker and; seeks to prevent work-related musculoskeletal disorders by applying principles to identify, evaluate, and control physical workplace risk factors [3] .
The main aim of this research is to establish the fact that the existence of ergonomic risk for drivers in their static sitting position in the car. The adaptation of awkward and incorrect sitting posture will lead to significant ergonomic risk whilst the opposite of adaptation of proper and correct sitting posture will lead to a reduction of significant ergonomic risk. The findings of this research are important for manufacturers of cars to consider the aspect of designing their vehicle car seats to be ergonomically friendly designed. Hence, the findings and results gained from this research enable a novelty of body of knowledge to be applied by car manufacturers and ergonomists to design the best ergonomic seats to reduce any significant ergonomic risks if the hypothesis holds. This research only covers the static posture of the drivers of the car to limit the scope of the research work.
2. Literature Review
This literature review covers the concept and definition of ‘ergonomic risk’ from the safety viewpoint, as well as covers past-related research articles on driver seat posture. Two main related research articles are critically reviewed and shared here in order to enhance the understanding of this current research paper. Other research studies on the related topics are also being made to cover any research gaps where applicable. Prior to critically reviewing the two related research articles, the term “ergonomic risk” from the safety perspective, is being defined first.
In understanding the concept of safety and ergonomic risks, the most critical aspect is understanding the term itself to comprehend the terminology point of view better. Immensely, this research should comprehend its literal meaning to prove the hypothesis of the research and grasp the total comprehension for its justification of the new theoretical model that this research hopes to build. The meaning of the word “safety” according to Hollnagel is “the absence of unwanted outcomes such as incidents or accidents” [4] . However, Hollnagel (2014) [4] further explains that a more detailed generic definition could be that safety is the system property or quality necessary and sufficient to ensure that the number of events that could be harmful to workers, the public, or the environment is acceptably low. Thus, it can be observed from both definitions that it creates some ambiguity of the meanings of which certain words embedded require further explanation. For instance, unwanted outcomes need further explanation of what type of results and these outcomes. Thus, it is imperative to understand the meaning of “safety” from different perspectives so that the purpose has not been diluted in many ways.
Ergonomic risks entail the embodiment of human factors and their related unsafe aspects when the human interface with machines. Human, as workers, at times work with machines since they utilise these machines to get the product of their work. When this interface between human and machine occurs, it is term as “ergonomic”. Ergonomic thus defines as the relationship and interface between human and machine at work. While “ergonomic risks” are the unsafe factors resulting from these interactions and interfaces between human and machine. Risky factors here can mean that the human’s circumstances or situations is exposed to when using the device, result in injury or harm to the human, physically and mentally.
A more accurate and meaningful definition of “ergonomic” is the process of designing or arranging workplaces, products and systems so that they fit the people who use them. It is applying psychological and physiological principles to the engineering and design of products, processes, and systems. The goal of human factors/ergonomics is to reduce human error, increase productivity, and enhance safety and comfort with a specific focus on the interaction between the human and the thing of interest. Examples of ergonomic risks are, but not limited to, awkward posture position, overstretching of bodily parts, over-straining the eyes, excessive motions, repetitive movements, etc. These ergonomic risks would lead to occupational injuries such as musculoskeletal disorders. Hence, it is imperative to prevent ergonomic risks from occurring when the human starts using the machines. As in the case of the driver driving the vehicle, the ergonomic risks foreseeable are improper sitting position leading to back injuries, prolong use of the eyes leading to poor vision, increase in cognitive usage during driving leading to mental stress, excessive bending of the arms during manoeuvring of the steering wheels, which could lead to musculoskeletal injuries and many more. It is important for research work to be conducted to identify these ergonomic risks and provide recommendations to mitigate them. In this research, the focus area is on the improper awkward sitting position of the driver in static position.
Critical reviews of published articles will be conducted for various articles with regards to the topic of “ergonomic” and “driving posture” in relation to the research topic in the study. The conduct of critical reviews is important to enhance the current research works. The benefits of the critical reviews of other researchers’ works are many. One of them is to provide insights to the existing similar work and gain more knowledge of other findings from the research done. It will offer more comprehension and understanding of the current research topic under investigation. Shortfalls of other research work can be learned and not repeated in the recent research work.
In the article by Kyung G. and Maury A. [5] , entitled “Specifying comfortable driving postures for ergonomic design and evaluation of the driver workspace using digital human models”, the keywords identified in their scientific article are, namely, “digital human model”, “driver workspace”, “comfortable driving posture”, “preferred driving posture,” and “filtering”. Keywords play an essential role in referencing and benchmarking to the existing current research done here. Some keywords might be familiar with the recent research works. In this article, one keyword, namely “comfortable driving posture”, is similar to the current research works under investigation. The synopsis abstract of Kyung G. and Maury A. research article, is about the specifications of comfortable driving postures for the essentiality for ergonomic design and evaluation of a driver workspace. The research article aims at presenting a study to enhance and expand upon several existing recommendations for driver comfortable postures. The research involves a total of 38 sample participants in six driving sessions that differed by vehicle class (sedan and SUV), driving venue (laboratory-based and field) or seat (from vehicles ranked high and low by vehicle comfort). Sixteen joint angles were measured in preferred postures to more completely describe driving postures, as were corresponding perceptual responses. Driving postures were found to be bilateral asymmetric and distinct between vehicle classes, venues, age groups and gender. A subset of preferred postural ranges was identified using a filtering mechanism that ensured desired levels of perceptual responses. Accurate ranges of joint angles for comfortable driving postures, and careful consideration of vehicle and driver factors, will facilitate ergonomic design and evaluation of a driver workplace, particularly when embedded in digital human models [5] .
One of the similarities of the current research work is the evaluation of the comfort and discomfort nature of the research to the drivers. Here ergonomic risks are can be assimilated with the latter. The article also reiterates that postural discomfort (especially in the back, neck, and shoulder) is still a common customer complaint. Hence, the objectives for both research works have some similarities in determining certain risk levels of driving postures which could lead to discomfort and lead to injuries to the body. Their studies too, proved the relevancy of this current research work to be conducted. Both of the writers mentioned that many of the existing studies on driving posture implicitly assume that the car seats and/or package geometries (spatial relationships among interior parts) used in experiments would be sufficiently comfortable for drivers. As a result, all postural data were incorporated when determining recommended joint range.
The fascinating portion of the research article by Kyung G. and Maury A. [5] , is the notion of exploring a comfortable sitting posture. In their experimental study, the studies sought to ensure that “preferred” driving postures were adopted, by allowing participants to freely adjust their postures and/or several parts of a driving rig, sometimes with extended adjustment ranges. Yet, their study is unclear whether participants felt comfortable in their “preferred” driving postures. At this juncture, it is critical to determine whether “preferred” driving posture pose ergonomic risks. From the literature standpoint, they had ascertained that “preferred” driving posture might not be the comfortable posture but in fact can lead to discomfort. As stated and reiterated by Kyung G. and Maury A. (2009) [5] , “Many of the existing studies on driving posture implicitly assume that the car seats and/or package geometrics (spatial relationships among interior parts) used in experiments would be sufficiently comfortable for drivers. As a result, all postural data were incorporated when determining recommended joint ranges. However, recent work by Kyung et al. (2008) [5] showed that some participants experience more than minimal discomfort (i.e. up to −5 on a scale from −10 to 0, corresponding to a perceptual response of ‘strong discomfort’). This occurred even though they were allowed to freely adjust the automotive interior geometry beyond the ranges allowed in actual cars. Hence, joint angles adopted by drivers may not be necessarily associated with comfortable postures, and the potential for further improvement of interior packaging would thus seem to exist.”
The next second published article being critically reviewed is by Park J. et al. [6] , entitled “Sitting Strategy Analysis based on Driving Postures and Seating Pressure Distributions”. The research is a conference paper presented in the Proceedings of the Human Factors and Ergonomics Society Annual Meeting. The gist content of the research conference paper is about the analysis of the different sitting strategy based on driving postures and seating pressure distributions. Sitting strategies that statistically represent preferred and comfortable driving postures can be used as reference data to design/evaluate an automobile interior layout. Although the previous research has identified the sitting strategies for various anthropometric dimensions of drivers, the classification method of sitting strategies was not objective. The effect of driver’s gender/occupant package layout (OPL) to the sitting strategy has not been clearly analyzed yet.
The present study by Park J. et al. [6] is intended to objectively identify the sitting strategies based on various drivers’ preferred driving postures and seating pressure distributions. Forty drivers’ preferred driving postures and their seating pressures in 3 different OPL conditions (coupe, sedan, and SUV) were measured by a motion capture system and pressure mat. Next, the sitting strategies were classified by a cluster analysis, and the effects of driver’s gender and OPL condition to the sitting strategies were statistically analyzed. As a result, the sitting strategies for upper-body were identified as erect (33% of drivers were preferred), slouched (41%), and reclined postures (26%). The number of drivers who preferred an erect posture, specifically female drivers, was more than twice that of male drivers. On the other hand, the number of drivers who preferred a reclined posture, specifically male drivers, was more than twice that of female drivers (p < 0.05). Moreover, 84% of drivers preferred knee bent strategy in SUV because the SUV condition has higher seat height than coupe and sedan conditions (p < 0.05). Both the identified sitting strategies and the factors to affect sitting strategies would be of use as considerable information in an ergonomic design/evaluation of automobile interior layout.
Even though their research perspective differs entirely from this current research, it provides insights into the variety of data findings for the different seating postures between the two genders of male and female. It provides a quantitative study approach as compared to previous works of qualitative approach. The study also provides a deeper understanding of the analysis of drivers’ gender and package condition from the experimental viewpoints rather than from visual observations only in previous research. Park J. et al. [6] study is intended to objectively identify the sitting strategy based on the drivers’ preferred postures and seating pressure distributions and analyze the factors of sitting systems. The exciting aspects of the research findings by Park J. et al., is that driver’s gender had a significant effect on the upper-body posture strategies. The findings indicated that male drivers prefer all of the posture strategies evenly. However, female drivers prefer slouched and erect posture. Another significant result is that OPL condition had a significant effect on lower-body posture strategies. 84% of the participants preferred knee bent posture in the SUV condition; on the other hand, only 4% of the participants preferred knee bent posture in the coupe condition. The results show that driver’s lower body posture is influenced by seat height.
Both the concluding data findings and results in both of the related research article papers above, had highlighted and shown that there are ergonomic risks involved for both male and female drivers. The findings indicated that the drivers need to adjust their sitting positions and postures in order to be a comfortable and safe zone of body postures from any ergonomic risks. Thus, Park J. et al. [6] research works had indeed strengthened the current research works by indicating that no matter what posture they adopt, there exist ergonomic risks to the drivers because of the different design of the seats in terms of height and configuration for the different car models. Both of the past-related researches are based in different method approach adopted in studying the driver postures and driver preferences unlike this current research work where RULA method is adopted with additional support of surveys to the drivers as test samples. Unlike these two past related research, where demographic parameters are not studied and take into considerations to unveil the relationships and correlations between different demographic parameters in determining the existence of the ergonomic risks of awkward sitting position in static postures. Both the related research papers too did not determine the existence of ergonomic risks for the static sitting position of car vehicle interface between driver and machine. Hence, it’s important that this research is conducted to discover other areas of concern.
3. Research Methodology & Experiments
The research method adopted in this research work is by way of conducting field experiments of about 84 test subject samples of drivers in Singapore. The main assessment used for the ergonomic posture risk evaluations is using RULA (Rapid Upper Limb Assessment) method and calculations. The RULA method essentially evaluates the upper limbs (hands, wrists, elbows, shoulders) but also the neck and lower back. It applies to tasks in which operator mainly uses his upper limbs, with little or no movement. The postures are mainly studied; the repeatability is not preponderant.
The RULA method has been developed by Dr Lynn McAtamney and Professor E. Nigel Corlett, ergonomists from the University of Nottingham in England. RULA is a postural targeting method for estimating the risks of work-related upper limb disorders. A RULA assessment gives a quick and systematic assessment of the postural risks to a worker. The RULA was developed to “rapidly” evaluate the exposure of individual workers to ergonomic risk factors associated with upper extremity MSD. The RULA ergonomic assessment tool considers biomechanical and postural load requirements of job tasks/demands on the neck, trunk and upper extremities. In addition, the RULA tool uses a systematic process to evaluate required body posture, force, and repetition for the job task being evaluated.
A single page worksheet as in Figure 1 can be used to evaluate required or selected body posture, muscle use frequent and forceful exertion. The output of the RULA assessment tool is the final RULA Score, which is a single score that represents the level of MSD risk for the job task being evaluated. The minimum RULA Score = 1, and the maximum RULA Score = 7. Outlined in the chart in Figure 2 are the RULA level of MSD risk descriptions and cut points.
Research Objectives, Hypothesis and Literature
Both research objectives and hypothesis are formulated and developed to ensure that the research works progress in alignment of the appropriate line of objectives to ensure targeted consistency and relevancy.
The overall research objectives are:
1) To perform an ergonomic risk assessment for Class 3 license drivers in-vehicle interface system using an ergonomic risk tool (RULA).
2) To observe and identify whether these drivers adopt and comply with a good sitting postures or awkward postures in static position in vehicle seats.
![]()
Figure 1. Score sheet of RULA method ergonomic risks assessment.
![]()
Figure 2. Chart of RULA scores and LEVEL of MSD risks.
3) To test the hypothesis on whether there is existence of significant ergonomic risk or not for these drivers in sitting position in vehicle seats.
4) To conduct surveys for these drivers to understand their sitting postures and whether there is any discomfort or pain in their normal sitting postures.
The research hypotheses are established from the development and generation of the two alternate hypotheses, namely:
H1: Ergonomic risks of improper awkward sitting posture exist for driver in-vehicle interface systems.
H0: Ergonomic risks of improper awkward sitting posture for driver in-vehicle interface systems do not exist.
The rationale of this research will be three-fold namely:
1) This research is conducted to confirm the existence of ergonomic risks to Class 3 license drivers and to reduce injuries for Class 3 licensed drivers during their driving duration in their vehicles with regards to reduction in ergonomic risks from a safety analysis standpoint.
2) This research is able to study driving sitting postures and safety practices of Class 3 licensed drivers, especially during their work interfaces with the systems and its related components. It is important that these interfaces are ergonomically sound since in today’s context that there is a lack of useful and usable ergonomically informed methods for in-car interface design in the concept stages of the current design process [7] .
3) The development of the new theory model will aid in the scientific breakthrough in the field of human ergonomics in the study of automotive ergonomic safety risks. The research findings and results will create a novelty of new knowledge and theory for ergonomists and car manufacturers in particular to develop and design safety ergonomic seats in the vehicles to reduce injuries such as musculoskeletal disorders.
4. Data Collection and Field Experiments
The data collection method for the research entails field experiments where the test samples are observed using the Rapid Upper Limb Assessment (RULA). Test samples are position in the sitting posture at their will in the vehicle car seat. Observations are made for the test sample’s sitting posture and the RULA assessment applied accordingly. The design and assessment of the car driver posture introduce additional complexity with respect to the study of a traditional sitting posture. First of all, the feet of a car driver do not generally assist the support of the body because they are primarily devoted to the use of the pedals [8] . Body balance and its control have thus to be assured by a seat equipped with a long inclined backrest and lateral supports [8] . Thus, these elements constitute a constraint and complexity to the assessment and evaluation method and design. In order to enhance this research process to reduce its complexity and design ambiguities, sample survey questionnaire is developed to enhance the research work data collection and findings. Each test sample is given a survey questionnaire to fill-up during the field experiment. Thus, two data collection approach is adopted for the research works findings.
There are altogether three stages of the data collection for the field experiments. The test samples sizes selected for the three stages based on statistical calculations of the base population is namely 10 (pilot test), 52 (first stage), 84 (second stage) and 151 (third stage). This article only present up to the second stage sampling size data collection and results. The initial sample size of subjects chosen will be about 52 qualified licensed drivers. The 52 sample drivers are chosen from a total population pool of 1,785,547, drivers holding Class 3 license in Singapore, according to the Singapore Government Data (data.gov.sg, 2018). Sampling method is adopted in this research because sampling constitutes a process of selecting a few (a sample) from a bigger group (the sampling population) to become the basis for estimating or predicting the prevalence of an unknown piece of information, situation or outcome regarding the bigger group [9] .
The sample size of 52 is obtained by inserting the total population size of 1,785,547 and having 85% confidence level and 10% margin of error chosen into the statistical formula of sample size. The sample size will increase with the research progress in 3 stages, in which the 2nd stage sample size is 84, with a 90% confidence level and 9% margin of error. The 3rd stage is the final target to achieve a sample size of 151 with a 95% confidence level and 8% margin of error. The drivers are selected randomly from the public domain to avoid any biasness and token of appreciation (key-chains) given to the driver volunteers to entice them to participate. The venue catchment area to get these voluntary drivers will be at various HDB block carparks (open and multi-storey carparks) covering the 4 cluster areas of North, South, East and West.
Data were collected for the first 10 subjects as the pilot test run for 10 sample size. The pilot test run was done to establish any errors and identify any improvements to fine-tune the experiment for the first stage sample size data collection. The 10 subjects are randomly chosen from the four clusters of the zone in the North, South, East and West part of Singapore. All subjects were randomly selected from the public car parks from the four cluster zones and invited to participate in the experimental trial pilot test run.
The next phase of the data collection process is collating all experimental results for the first stage sample size. The first stage sample size is 52, followed by second-stage sample size of 84 and the final stage sample size of 151 progressively. For the 1st stage sample size RULA assessment, a progressive, gradual built-up sample size is chosen. The build-up sample size selected is 30. This sample size of 30 subjects is selected because in academic research, a sample size of 30 or more signifies a statistically sound sampling method and sample size. Hence, another 20 subjects will be tested with the RULA assessment since the first 10 subjects in the Pilot Testing had been done. After completing 30 subjects RULA assessment, the 1st stage sampling will be further completed to the target sample size of 52.
In the next subsequent experimental data collection, a new simplistic approach has been chosen rather than using the method adopted in the Pilot Testing, where each parameter is tabulated for all 10 subjects. In the simple format approach of data collation, all the data collected for each subject and all parameters for each subject are gathered and shown from the RULA results as a single subject sample. This approach is precisely depicted from the RULA assessment form where the data results are inputted for each subject. There will be no tabulation of all parameters for the 20 subjects as what had been done previously in the Pilot Testing. Tabulation for each parameter step of the RULA will be done after all 52 subjects data results are obtained from the RULA assessments. This approach makes the analysis easier since each data is shown for each subject in single format tabulation for each subject for the RULA assessment.
5. Demographics of Participants
The sampling size of subjects will be selected based on the demographics of the sampling subjects. The proposed demographic parameters are, not exhaustively, namely; driving experiences level (novice: between 0 - 5 years, advanced: between 6 to 10 years, competent: between 11 to 15 years, proficient: between 16 years to 20 years, expert: more than 20 years); between gender sex (male or female), age factor (scale range of: 1. 20 years old to 30 years old; 2. 31 years old to 40 years old; 3. between 41 years old to 50 years old; 4. above 50 years old). The demographic parameters were chosen to determine and assess the ergonomic risks prevailing for the different demographic groups’ sample subjects. The relationship of these demographic parameters are important to justify the correlation between each parameters in order to understand any impact to the ergonomic risk levels and establish any relationship to analyze any trend on the ergonomic results obtained.
6. Data Testing Approach & Calculation Methodology
The data collected will be tested using the t-test approach, where the demographic parameters will be used as variables for the t-test and test whether there is significant or no significance. For example, the male and female driver’s results will be also tested for the t-test to see whether the difference is between the two genders are statistically significant. The t-test results will be then interpreted. If the result is less than 0.05, the difference between the two sets of values is important. If the result is more significant than 0.05, the difference between the two sets of values is not important. The data will also be analyzed by plotting the results in bar charts and also scatter plots. A regression test line will be generated from the scatter plots to analyze whether there are any correlations between the demographic variables selected. The r2 value will be determined, and the slope of the regression line analyzed to understand the correlation and relations functions of the variables. There is to ensure that the different demographic parameters collected and tested are correlated in the correlation testing of the r2 value.
A hypothesis testing will also be done for the working hypothesis of the Null Hypothesis through the p-value. If the p-value is less than ∞ (level of significance), we reject the Null Hypothesis (H0). Suppose the p-value is greater than ∞, we fail to reject the Null Hypothesis (H0). If the level of confidence, C, is 95% (0.05), this means the significance level ∞ is 5% (0.05). This is done by using the Right Tail Test, where the Null Hypothesis is H0 < 5 and the Test Alternative Hypothesis, Ha ≥ 5. The value of mean, μ of 5 is chosen, because 5 is the trigger point of the Ergonomic Risk.
Assessment of RULA Score, where if the value is 5 and above, there need to be investigation to the body posture of the driver since there is significantly ergonomic risks involved bases on the RULA assessment. Thus if the mean value μ is less than 5 (RULA Score), then it indicated that the Null Hypothesis holds true and, therefore, there are no ergonomic risks involved for the driver. But if the mean value is more and equal than 5 (RULA Score), then the Alternative Hypothesis, Ha, holds true and that there are significantly ergonomic risks involved.
The value of p is determined and calculated by the formula of the Test Statistics,
,
where Z = test statistics, Ű = data mean, μ = hypothesis mean, S = standard deviation, and n = number of samples. The p-value is defined, as the probability of obtaining a sample “more extreme” than the ones observed in the data collected, assuming the Null Hypothesis is true, H0 is true. The Z value can be calculated after the data mean Ű, the standard deviation S, and the number of samples n that are obtained from the experimental work completed. In the three stage experiment, there are three stages of the sampling size, namely 1st stage of sample size n = 52 (85% confidence level), 2nd stage of sample size n = 84 (90% confidence level) and 3rd stage of sample size n = 151 (95% confidence level). Thus, the sample size, n, is already known for each stage and can be inputted into the Test Statistics Formula. In addition, at each stage the Standard Deviation S and Statistics Experimental Mean Ű, will be calculated for all sample RULA score of the subjects at every stage. Hence, at each stage, the Test Statistics Z can be determined.
Once the Z value is determined from the data calculation, the value of the p can be obtained from the Normal Distribution Table with Z Values. Using the Z table, the p-value can be determined using a one-sided alternative hypothesis. Again, suppose the value of p is obtained, it can test the hypothesis whether to reject or fail to reject the Null Hypothesis, using the level of significance as discussed earlier.
7. Data Collection for 2nd Stage Sample Size (84)
The second stage of the sample size of 84 participant subjects was conducted in year 3 and year 4 of the project research. A mix gender of 84 sample participant subject’s data and results are collected for the ergonomic risk assessments. Out of the total 84 participant subjects, 24 are females and 60 are male’s drivers. If there is a difference in gender, one of the demographic parameters that should be taken into account is the analysis of risk factors for both genders. With regards to the competency of the drivers, 20 subjects are categorized as competent drivers, 5 subjects are experts level, 5 subjects are novices, 20 subjects are advance beginners and the balance of 34 subjects are proficient drivers. In terms of age demographic parameters: 21 subjects are age between 20 and 30 years old, 27 are between 31 and 40 years old, 23 are between 41 and 50 years old, and the balance of 13 subjects are 50 years and above. The RULA data and results of each subject are collected and the overall risk RULA level is calculated and presented. Subsequent graphic charts illustrated the data collect in comparison for the various demographic parameters with their respective risks level of RULA results. All the data results of the RULA score for the 84 test samples are collated and tabulated.
The research findings result indicated that the average RULA score calculated for the 84 samples is approximately equals to 6. The average value of RULA score of 6 indicates that further investigation needed for the sitting posture of the driver and the change must be done soon as depicted in the RULA Assessment scoresheet. In addition, the average value of RULA score of 6 above depicts a Very High level of Risk Level, which is in the dangerous zone.
8. Statistical Calculation for Hypothesis Testing & t-Testing
The statistical calculations for conducted to perform the hypothesis testing based on the results gathered. As tabulated from the average RULA score of 84 test subject samples is the value of 6, this means, the data mean Ű is 6 (i.e. Ű = 6). As discussed earlier that the hypothesis mean, μ is 5, then the value of Test Statistics Z can be calculated and determined from the formula below:
The formula of the Test Statistics,
[10]
where Z = test statistics, Ű = data mean, μ = hypothesis mean, S = standard deviation, and n = number of samples.
The value of S of the standard deviation is then calculated to be S = 1.1.95 and results in giving the final value of Z = 7.69.
If the Z value is higher than 3.4 at the value of level of significance (p-value), that means the Z value lies in the rejection region of the tail area and therefore it shows that the need to reject the Null Hypothesis. Since the Z value obtained from the 84 test subjects’ samples is 7.69, which is more than 3.4 at the level of significance of 90%, thus, it can be concluded, that the Null Hypothesis, Ho, is rejected. The Alternative Hypothesis, Ha, is accepted and the research proves that there is existence of significantly ergonomic risks for the drivers.
The two variables of Male and Female RULA scores are tested using the t-testing methodology. Values of the RULA scores for both Male and Female are tabulated in excel software and the t-testing calculated using formula T. TESTING = (MALE RULA SCORES, FEMALE RULA SCORES, 2, 2).
The value of the t-testing calculated is 0.7874. Since the t-value calculated is more than 0.05, this indicates that the two set of values of RULA scores of Male and Female is not significant. Thus, it shows that there is no difference between Male or Female in signifying the existence of ergonomic risks between the gender difference. This finding is important to signify that existence of ergonomic risks for drivers does not depend on gender of the drivers.
A scatterplot for the Male and Female RULA scores is also plotted as shown in Figure 3. This statistical formulation is important to determine its correlation between the two variable parameters.
The regression line is also formulated and plotted in the scatterplot of the Male and Female RULA scores. The correlation coefficients r2 regression value is 0.0356, as shown for the trend line in Figure 3. This demonstrates that there is no strong, linear and positive correlation between the two variable parameters of Male and Female RULA scores. Indeed, it evident the poor correlation existence between Male and Female RULA scores. Thus, there is no significant correlation between Male and Female in demonstrating the existence of the ergonomic risks for the drivers in terms of gender difference.
The average RULA score values for each range of age of drivers are calculated and tabulated. For age range of between 20 and 30, the RULA score average is 5.9. For age range of between 31 and 40, the average RULA score is 5.6. For age range of between 41 and 50, the average RULA score is 6.2. For age range of above 51 years of age, the average RULA score is 5.3. These average values of RULA score for each age range is plotted graphically as demonstrated in Figure 4.
From the graphical bar chart above in Figure 4, it indicated that the maximum value of RULA score is 6.2 and the minimum value is 5.3. Thus, it can be deduced that the minimum value of 5.3 is more and above the hypothesis mean score of 5. Hence, it can be concluded that there exist significant ergonomic risks for all drivers for all the range of age groups under study.
![]()
Figure 3. Scatterplot between male and female RULA scores with r2 regression line.
![]()
Figure 4. Age range of drivers against average RULA score.
t-testing is formulated and calculated for the age range of 20 - 30 and 31 - 40, to find any significance. The calculated t-test value is 0.241 for the two age groups. Since the value of 0.241 is greater than 0.05, it shows that there is no difference for both age groups in demonstrating the existence of ergonomic risks. Again, this highlights the fact that age groups do not play a critical role in determining the existence of ergonomic risks for drivers. Thus, it can be concluded from these findings that different age group do not influence the existence of ergonomic risks no matter what age they are.
A scatterplot is also plotted to evaluate on the correlation between the different age groups, which is shown below in Figure 5.
From the scatterplot, the regression correlation coefficient r2 is formulated and plotted along the trend line of the scatterplot. The regression correlation coefficient r2 indicates a value of 0.1168. Thus, since the value is small, it can be derived that there is no significant correlation between the different age group ranges. Again, it is evident that the different age groups do not correlate with each other in demonstrating the existence of ergonomic risks of the drivers.
The final demographic parameter need to be statistically calculated and test is the competency levels of the drivers. Both the t-test and Regression Correlation test are done to validate any correlations between the range of competency levels of the drivers, namely, novice, advance, competent, proficient and expert levels. Figure 6 signify the bar chart with respective range of competency levels and corresponding RULA scores. Figure 7 denotes the comparative bar charts of competency level against RULA scores.
![]()
Figure 5. Scatterplot of the different age groups.
![]()
Figure 6. Competency levels with RULA scores bar chart.
![]()
Figure 7. Comparative bar charts of competency levels and RULA scores.
t-testing is formulated and calculated for the competency level range between Novice and Advanced Level, to find any significance. The t-testing is done for a pair tail test. The calculated t-test value is 0.948 for the two groups. Since the value of 0.948 is greater than 0.05, hence it is not significant. It shows that there is no difference for both competency level groups in demonstrating the existence of ergonomic risks. As for pairing between Advanced Level and Competent Level, the t-testing results yields as 0.173. This also shows that it is greater than 0.05 and thus does not yield any significant. As for pairing between Competent Level and Proficient Level, the t-testing results yields as 0.385. This also shows that it is greater than 0.05 and thus does not yield any significant. As for pairing between Proficient Level and Expert Level, the t-testing results yields as 0.296. This also shows that it is greater than 0.05 and thus does not yield any significant. Thus, in conclusion, all the two tailed pairing t-test, revealed figure less than 0.05, which indicate that they are not significant in the t-testing results, and hence signifies that there no differences between the demographic parameters in demonstrating the existence or non-existence of ergonomic risks to the drivers in all range of competency levels.
The next aspect of the experiment is to find the correlation of these competency levels demographic parameters. Thus, the regression correlation coefficient r2 is formulated and plotted along the trend line of the scatterplot. The scatter plot of the competency levels demographic parameters is plotted as shown in Figure 8.
The regression correlation coefficient r2 indicates a value of 0.4438. Thus, since the value is small, it can be derived that there is no significant correlation between the different competency level groups. Again, it is evident that the different competency level groups do not correlate with each other in demonstrating the existence of ergonomic risks of the drivers.
9. Survey Questionnaires Data Collation & Graphical Charts Presentations
The survey questionnaires are collated from the 84 test subject samples. The survey questionnaires sample template is provided in Appendix. Data is collated based on the responses or answers given by each sample test subject for each of the question in the survey questionnaire and compile in graphical format for illustration presentations and analysis purposes. For the first question on the most frequent used body part when driving a vehicle car, the responses are gathered from the 84 test subject samples and graphically illustrated in Figure 9 below.
From the data graphical illustration in Figure 9, it demonstrates that the most frequent used body part of the driver during driving is the elbow and second most used body part is the shoulder. This information indicates that the body part is subjected to the exposure of ergonomic risks for human body while in the position of seating of driving position. Hence, it supported the hypothesis of driver subjected to ergonomic risks and its ergonomic risks existence in drivers.
For the next 2nd question on the subject of intense pain suffered by sample test subject during driving, data are also collated from the 84 test samples and plotted graphically. The data is then graphically presented in pie chart format and also bar chart format to see the responses on various intensity and also the most responses on the highest intensity. Figure 10 and Figure 11 demonstrates the graphical representation both in bar chart and pie chart format respectively.
![]()
Figure 8. Scatterplot of competency levels.
![]()
Figure 9. Survey data Q1—Most frequent use body part in driving.
![]()
Figure 10. Graphical representations on the intensity of pain of test subjects.
![]()
Figure 11. Pie-chart on the various intensity of pain from test subjects.
The above graphical pie-chart and bar-chart for the data collated from responses of test subject samples, illustrate the fact that the highest intensity of pain suffered is at the value of 9 out of 10. A total of 32 test subject samples responded and indicated a value of 9 with regards to the intensity of pain in driving. The graphs also indicated that the intensity of pain begins at value of 2 and it covers up to value of 10. This data evident that the existence of pain thorough all test subject samples in the survey questionnaires. Hence, this proved the fact that ergonomic risks exist and support the hypothesis of this research.
The 3rd question of the survey questionnaire entails on the frequency of use of the body part for driving purpose. The data collated from the 84 test subject samples is illustrated in Figure 12 below.
The graphical representation in Figure 12 demonstrates that 36 respondents give the highest number value of 7 per day as the most frequent used for that body part for purpose of driving, while 23 respondents gave an answer of 8 times per day for the frequency of use of that body part. Subsequently is the value of 9 and 10 for frequency of usage with corresponding respondents total of 12 and 7 respectively. Thus, it shows that the existence of ergonomic risks prevails for drives at much rapid frequency per day.
![]()
Figure 12. Responses from test subjects on frequency of use of body part.
The next question 4 of the survey questionnaire entails, asking the respondents whether the body part is used for repetitive motion or extreme force. The results from the respondents indicated that 80 out of 84 responded with the answer “Yes”. Thus, with either repetitive motion or extreme force use by the drivers, the notion of existence of ergonomic risks exist since these parameters, namely repetitive motions and extreme use of force, are factors that deliberate risks to be resulted for the human body in motion.
And the subsequent question 5 entails, asking the respondents about any rest time for that body used for the duration of the task. Majority of the respondents answered “Yes” and it form the large part of about 75 respondents. The rest of the 9 respondents answered “No” in question 5. Thus, it can be deduced that the motion is quite simultaneous and repetitive in nature. Hence, it can be concluded that the ergonomic risk is prevailing and dominant since there is not much rest time taken in the duration of the task which could lead to fatigue to the human body. Question 6 relates to question 5 in which case, the question asks the respondent about the exact time of the duration. Again majority of respondents did not response since there is no rest time but the rest of the 9 respondent responded on an average of about less than 5 minutes’ rest time. Hence, these results showed that the body remains in working conditions using that particular part of the body for the motion of driving in the sitting posture. Again, these findings supported the very details of the posture and tasks in driving conditions and bring forth to a conclusion that support the hypothesis that the body posture remains exposed to ergonomic risks at all times.
Question 7 entails, asking the respondents whether they are sitting upright leaning against the vehicle seat. The quantity of 50 respondents replied that they did not sit upright and did not lean on the vehicle seat. The reasons they gave was that they are leaning forward to see clearer their view in front and others gave reasons that they did not bother to adjust the vehicle seat postures. With the large amount of respondents not sitting properly and leaning against the vehicle seat, this posture resulted in awkward posture in sitting position and could possibly lead to ergonomic risks. Hence, it is evident again here that ergonomic risk exists which consequently support the hypothesis of this research. Question 9 entails the pictorial illustrations of different sitting postures in which the respondents are required to choose. Picture A in Question 9 in the survey questionnaire, demonstrate a good and safe proper sitting posture, while picture B and C demonstrate improper sitting posture with awkward position of the body postures. Only 12 out 84 respondents choose picture A while the balance chooses either picture B and C. To be more precise, 34 respondents choose picture B and 38 respondents choose picture C. Hence, it is clear from the respondents’ replies from question 9 that majority of them sit in an awkward posture and unsafe improper sitting posture in the vehicle seat. The results collated from question 9 illustrates that ergonomic risks exist for these respondents of the test sample subjects since their awkward and unsafe improper sitting postures are prevalent for them to get injuries in particular back sprain pains and other related musculoskeletal disorders.
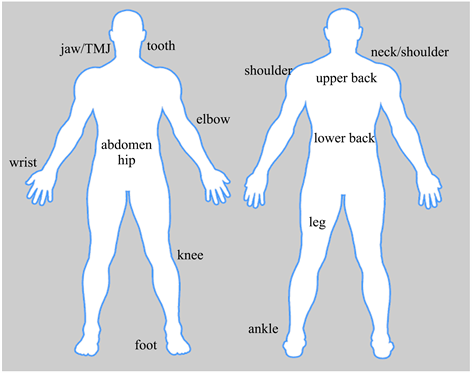
These findings are reconfirmed by the research works done by Lucas E.B. and Onawumi A.S. [11] on taxicab drivers in Nigeria. Their findings revealed that poor design of driver’s workplace and poor sitting posture are part of what is responsible for stresses and strains experienced by drivers [11] . The last question 10 in the survey questionnaires, entails asking the respondents to circle the body parts indicated which they think that cause them to feel pain during driving and sitting in the car. The results are depicted in the graphical representations of pie-chart and bar-chart as shown in Figure 13 and Figure 14 respectively.
![]()
Figure 13. Pie-chart on different body parts pain of respondents.
![]()
Figure 14. Bar-chart showing the body parts pains by respondents.
The above graphical representations demonstrate that the highest body part pain suffered by the highest number of respondents is the back spinal pain. The highest number of respondents is 23 for this type of back spinal pain. The next second and third highest pain is the neck pain and shoulder pain in which correspond to 17 and 15 respondents respectively. The lowest number of respondents is 6 which indicate eye strain as the body part pain. From the collation of the findings for question 10, it shows that all respondents circled the body part pain and without anyone not indicating no pain. In fact, the highest number of respondents is 23 showing back spinal pain issues. Hence, it can be deduced that ergonomic risks exist since the respondents suffer pain from their body parts when performing the driving task and in sitting posture positions.
10. Conclusions
In conclusion, the 1st stage sampling size of 52 subjects had been completed using the RULA assessment on all the 52 subject samples. The results indicated that the average score of the RULA results is of a value of 6. In this first stage of sampling, the value of RULA score of 6 indicated that there exist ergonomic risks among the drivers in the sample size RULA assessment. From the RULA Score Table, a value of 6 indicates that further investigation is needed for the ergonomic postural condition of the drivers due to ergonomic risks available after being assessed and evaluated. Thus, implementation change is needed for the design of the human interface between the driver and the vehicle.
In this research paper, the second phase test sampling stage is conducted and completed with 84 test subject samples. The second phase of experiments is able to conclude and reiterate the hypothesis being proven with supporting that ergonomic risks exist for the test subject samples when in a static sitting position in the vehicle. The conduct of the second test phase is also able to collate the appropriate data and able the t-testing and hypothesis testing to be done. In all the t-testing and hypothesis testing of the demographic parameters of the test subject samples, the results showed that the hypothesis of null is rejected and the full hypothesis of existence of ergonomic risk exist prevails.
Regression line is also being plotted to show any correlations that exist between the test demographic parameters in research. The regression line indicated that there are no significant correlations exist within the demographic parameters namely gender, age and competency level. Data is also collated from the 84 test subject samples on their survey questionnaires. All the questions responses are populated and graphically presented in some aspects to show that there are significant ergonomic risks exist among the respondents of the survey questionnaires in each of the 10 questions responded. In conclusion of the second test phase, it can be safely announced and confirmed that the full hypothesis is fully supported. This is demonstrated by evidence that ergonomic risks exist for drivers who sit in static positions and maintain awkward postures. Furthermore, the null hypothesis is rejected.
It is recommended that further testing of the next stage (3rd stage with 151 test samples) of a larger sampling size be conducted for further verification and justification of the existence of ergonomic risks of awkward sitting posture for the drivers. In addition, more surveys for a larger pool of test samples need also to be conducted to further provide concrete evidence to support and substantiate that the subjects are subjected to ergonomic risks in the static sitting posture driving condition.
The implication of the study is important since it will impact the way the car seat is designed in vehicles. Even though car seats are made adjustable but they are not ergonomically designed. Drivers will still encounter ergonomic risks of sitting in awkward postures in a static position if their seats are not adjusted, in a manner safe and comfortable for them. This research study proves the existence of these ergonomic risks since the drivers sit in positions of incorrect posture leading to injuries such as musculoskeletal disorders and muscle pains in the body. Hence, the practical implications for car manufacturers and car ergonomic designers are then to further study and research the best ergonomic car seats that do not have much adjustment for drivers to do when they are sitting in the car. These car seats are designed to tailor to the ergonomic posture of drivers automatically when they sit in the vehicles. Thus, auto-adjustment car seats are the next leap in car seat designs for the car manufacturing industry.
Appendix. Sample Survey Questionnaire
Name of Subject CODE: (ERGORA 001—example)
Ergonomic Survey—Driving Task
1) Which part of your body that is most frequently used when driving in a vehicle (car)? (Please circle the body part. Circle only one body part)
2) Is there any intense pain of your body part that is frequently used for driving purpose?
YES/NO (Circle only one)
If YES, how much from range 1 to 10 is the intense pain? (Circle one number)
3) How many times per day do you use that body part to work? (Estimate only)
4) Is the body part use for constant repetitive motion or extreme force use?
YES/NO (Circle only one)
5) Is there any rest time for that body part used in the task duration?
YES/NO (Circle only one)
6) How long is the rest time? (Example: 10 minutes or 15 minutes etc.)
7) Do you sit upright leaning to the vehicle seat all time during driving?
YES/NO (Circle only one)
8) If no to question (7), what is the reason?
9) Which posture do you adopt during driving? Refer below diagram and tick the posture you adopt.
![]()
Please tick: A ( ) B ( ) C ( )
10) Refer to the diagram below, which part of the body you feel pain during driving and seating in the car? Circle the word indicated for the body part. You can choose more than one part.