1. Introduction
Reinforced concrete is the most popular, effective and widely used material in the construction industry for over 100 years. However, for several decades, one of the most prejudicial factors for the service life of the reinforced concrete structures, and responsible for degrading its operational life, is the corrosion of steel reinforcement. In addition, the type of corrosion with the most harmed results is chloride-induced steel corrosion, which begins when the chloride ions overcome the depassivation limit of the steel, initiating the corrosion process of the steel rebars [1] [2] [3] [4] [5].
Considering the extremely high cost which is spent annually for the remediation of corrosion damages, extensive research focused on the evaluation and prediction of concrete corrosion, as well as the development of complex materials with high-performance mechanical properties, such as increased strength and durability, with the aim of improving durability and safety of concrete structures operational life.
During recent decades carbon nanotubes (CNTs) and carbon nanofibers (CNFs) characterized as the most promising materials of the century due to their exceptional mechanical, electrical, chemical and thermal properties, therefore, become widely used in an extensive range of engineering and industrial applications.
Carbon nanotubes (CNTs) are allotropes formats of carbon atoms with a cylindrical nanostructure having a diameter of nanometer and their length in micrometers with the same characteristics as tubes of single or multiple layers of graphite sheets with nanosized diameters [6]. They are used as additives in the reinforcing materials, because they eliminate the cracks at the nanoscale, minimize the capillary stresses, and consequently improve the mechanical properties and consequently the service life of the concrete elements [6] [7] [8] [9].
In addition to the carbon nanotubes (CNTs) which are widely used in several nanotechnology applications, carbon nanofibers (CNFs) have also gained popularity in the building industry, mainly to enhance plain concrete’s ductility, flexural toughness and strength, light weight, high corrosion and fatigue resistance, whereas their electro conductive, facilitate the communication through concrete interfaces [10].
The excellent reinforcing and toughening efficiency of CNTs and CNFs is related to the significant improvement of the critical stress intensity factor/fracture toughness, critical strain energy and the critical crack tip opening displacement. In addition, CNFs seem to have similar improvements to CNTs in terms of enhanced tensile strength, flexural strength and crack resistance [11] [12] [13].
With the view to examining for the impact of CNTs and CNFs in anti-corrosive performance and taking into consideration that the corrosion rate is the key parameter for evaluating the rate of deterioration and predicting the remaining service life of reinforcement structures, the research community focused on electrochemical techniques that measure the corrosion rate of steel in reinforced mortar.
Among several destructive and non-destructive test methods for measuring the corrosion rate, the linear polarization technique seems the most promising nondestructive, electrochemical method, which can provide a direct evaluation of the corrosion performance, and the relative instantaneous corrosion rate, which is the actual rate of corrosion mechanism [14] [15] [16] [17].
Moreover, considering also the characterization of the pore structure, the most commonly used technique is the mercury intrusion porosimetry technique (MIP), which provides features data of the pore space related to the different physical properties of the materials. This is a well-known robust method, based on the intrusion of a non-wetting fluid (mercury) into porous structures under increasing pressure, and provides information for the pore size diameter, pore size distribution, pore structure, specific surface area and pore volume. The technique is based on the capillary law governing liquid penetration into small pores and the assumption that a non-wetting liquid can only intrude pores under pressure and that pores have cylindrical geometry. Applying the above considerations, the pore cavity to pore throat ratio and the distribution of pore cavity sizes, associated with pore throat sizes can be calculated [18] [19] [20] [21] [22].
The current study meant to define the dispersion effect of nano additives 0.1% wt CNTs and 0.1% wt CNFs in the corrosion resistance and provide information regarding the corrosion rate of the steel reinforcement.
2. Materials and Methods
The experimental process for the evaluation of the corrosion impact proceeded through electrochemical measurements, more specifically through half-cell potential, linear polarization technique, and consequently via mass loss calculations, while the corrosion environment is 3.5% NaCl solution.
Apart from the electromechanical measurements, the characterization of the pore structure is carried out by mercury porosimetry technique, which is further applied to define the impact of the nano additives of 0.1% wt CNTs and 0.1% wt CNFs in the pore system and internal structure of mortar specimens which have been exposed in corrosion environment of 3.5% NaCl solution for a 20 month’s period.
2.1. Materials and Sample Preparation
For the experimental process of this study eighteen mortar cylinder specimens of 100 mm height with axially embedded steel bars of 10 mm diameter were constructed.
The following Figure 1 presents the mortar cylinder specimen.
The slabs were made from mortar of Portland cement CEM I and for all types of specimens the aggregate used is of maximum size of 5 mm. Tap water is also used. The bars were embedded up-side down in the molds and are set of steel type of B500C.
In particular, the chemical composition of the ordinary Portland concrete is presented in Table 1.
The specimens have been sorted in three sets of six specimens, with a different
![]()
Figure 1. View of cement mortar cylinder specimen.
mortar synthesis as follows:
• Category I: Six specimens with no additives.
• Category II: Six specimens of CNT 0.1 wt%.
• Category III: Six specimens of CNF 0.1 wt%.
The characteristic properties of the nano reinforcement (CNTs and CNFs) presented in Table 2 and Table 3.
Values of an estimated fiber count, the number of fibers, in this case CNTs and CNFs, which are theoretically distributed in a unit volume of the matrix, assuming perfect dispersion according to ACI 544 R-96 [23].
All specimens are stored in the laboratory room (20˚C, 100% humidity) and are partially immersed up to 50% of their height in 3.5% NaCl solution for a period of 20 months.
![]()
Table 1. Chemical composition of OPC.
![]()
Table 2. Properties of carbon nanotubes (CNTs) and carbon nanofibers (CNFs).
![]()
Table 3. Amount and fiber count of CNFs and CNTs of each group of specimens.
2.2. Half-Cell Potential Measurements
In particular, information given by half-cell potential measurements is qualitative, and cannot provide information for the corrosion kinetics.
From the half-cell potential values, it can be resulted whether the corrosion is in an active or in a passive state [24]. More specifically, based on the ASTM C876-87 standard, corrosion status and the relative corrosion potential values are presented in Table 4 as follows [25].
Considering the above, if the corrosion potential changes negatively, then corrosion rate increases.
2.3. Linear Polarization Technique
Linear polarization technique (LPT), applied for a period of 20 months in eighteen cement mortar specimens and provide information for the corrosion current (Icorr) for the tested samples.
The electrochemical measurements conducted regularly on a monthly basis, at standard conditions, with the aid of embedded steel as the working electrode, while an Ag/AgCl stick used as the reference electrode of the experiment, enabling the corrosion potential between the steel reinforcing bar and the auxiliary electrode to be measured.
In particular, the experimental devices used for the electrochemical measurements are the following:
• A potension meter connected to a PC.
• The reference electrode is Ag/AgCl.
• The liquid solution is distilled water with 3.5% in NaCl.
• The working electrode is Carbon (C).
• The software used is Power Suit.
Linear Polarization technique commonly used to provide information for the corrosion potential measurements, and corrosion current assessment.
Moreover, following the state of corrosion in corroding metal, linear polarization measurements, provide also information for the corrosion current at the actual time of measurement.
2.4. Mass Loss
One of the most popular test methods for defining the actual corrosion impact in the steel rebar is the weight loss measurements.
![]()
Table 4. Corrosion potential values/corrosion status [25].
The mass loss for each rebar can theoretically calculated by using the results of the linear polarization measurements, and the following equation which is based on Faraday’s Law.
β: the mass consumed due to corrosion(mg).
I: Current corresponding to the exposure time (mA).
t: Time of exposure (sec).
M: the atomic weight of Fe = 0.056 mg.
ne: 2, the ionic change (2 for Fe → Fe2+ + 2e−).
F: 96.500, the Faraday value.
2.5. Mercury Porosimetry Technique
In particular, the instrument used for the porosimetry technique is named as porosimeter which employs a pressurized chamber to force mercury to intrude into the voids in a porous substrate.
The device is equipped with two low-pressure ports for measuring pores in the range of macropores down to 3.5 μm and a high-pressure port for measuring pores from 6 μm down to 5 nm, reaching a maximum pressure of 33,000 psia (~2275 bar), while the three mortar samples are of 1 cm3 volume per each tested category.
Mercury porosimetry is carried out by implementing a Micromeretics® AutoPore IV 9500 porosimeter. The measurement procedure consists of two main stages. In the beginning, samples and sample holders (penetrometers) are conditioned in order to desorb any traces of humidity and/or gases.
For this reason, porosimetry samples and penetrometers are normally placed for an hour inside a furnace stabilized 110˚C. Samples are previously cut into appropriate fragments in order to be adequately accommodated within the penetrometer and weighted until the desired quantity is reached.
For the initial (low pressure) measurement stage, the penetrometer is loaded in a low-pressure port where the sample is evacuated until a vacuum level below 50 μmHg (i.e. 6.67 × 10⁻⁵ bar) is reached and maintained for 10 minutes. This step is essential to remove gases from the porous network that may interfere with the measurement by imposing back pressure to the advancing mercury front, registering thus falsely the pores in smaller sizes. When the first stage terminates (after the vacuum stage, about 10min are required for the measurement), the penetrometer is removed from the measuring port and then weighted in order to record the amount of total mercury that filled the penetrometer at the given pressure of 0.54 psia (i.e. ~37 mbar).
Subsequently, the penetrometer is loaded in the high-pressure chamber to characterize the fraction of smaller pores. After the measurement termination, a report with the results is automatically produced [25] [26].
3. Measurement and Results
The measurements and results of the above applied methods are presented as follows.
3.1. Half-Cell Potential Assessment
The corrosion behavior of the three different sets of mortar samples are estimated by monitoring the Half-cell potential against the exposure time.
The relative diagram for the three different mortar sets is presented as follows.
From Diagram 1, it is found that from the 1st month of exposure all specimens were in an active corrosion status. Moreover, during the first four months of exposure, specimens in Category II and III delayed the onset of corrosion while specimens in Category I found in an active corrosion rate.
Moreover, after the 5th month of exposure, all specimens reach to a more stable Ecorr value ranging between −650 mV and −500 mV, therefore, corrosion rate was in an active state in all tested samples until the end of the tested period. The probes with additive CNTs have the greatest half-potential.
3.2. Corrosion Current Assessment
The corrosion current, versus the exposure time of the three different categories of specimens are presented as follows.
Based on Diagram 2, all specimens are in an active corrosion status, while the corrosion rate in all specimen categories was low. More specific, the corrosion resistance of specimens with CNF’s nano composites is found higher compared to the corrosion resistance of specimens with CNT’s.
3.3. Calculated Mass Loss or Rebars
By applying on Faraday’s Law, it is found that the total mass loss in each category of specimens due to corrosion impact is presented in Table 5.
Moreover, the mass loss per each category of the three mortar specimens, against
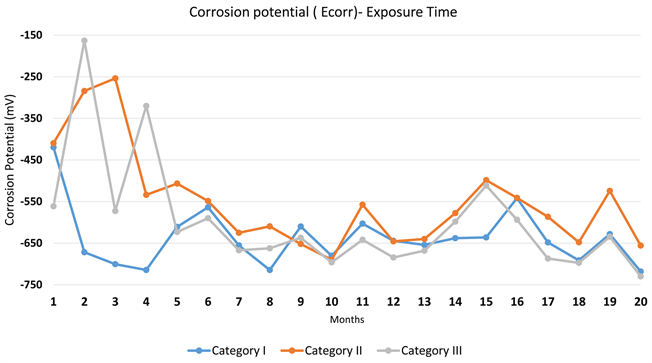
Diagram 1. Mean value of half cell potential (Ecorr)—Exposure time.
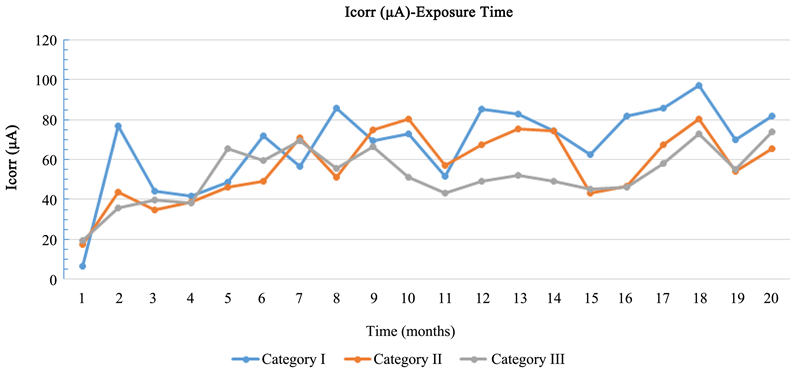
Diagram 2. Mean value of current corrosion (Icorr)—Exposure time.
exposure time is presented in Diagram 3.
From the above results, it is concluded that Category III (with CNFs) lost less mass that the other two categories, due to corrosion impact. Whereas the specimens of Category II (with CNTs) lost less mass than these of Category I with no nano additives.
3.4. Mercury Porosimetry Results
The diagrams of the mercury porosimetry measurements presented as follows.
3.4.1. Category I
The mercury porosimetry of Category I specimens without nano composites results (Diagrams 4-6).
3.4.2. Category II
Diagrams 7-9 present the mercury porosimetry results of the specimens Category II with CNT’s nano composites.
3.4.3. Category III
The mercury porosimetry results of specimens of Category III with CNF’s nano composites presented in Diagrams 10-12.
Moreover, the diagrams for Cumulative Pore Area vs pore size and Cumulative Pore Area vs Pressure for all categories are presented as follows.
With consideration to diagrams (Diagram 4, Diagram 6, Diagram 7, Diagram 9, Diagram 10 and Diagram 12) it is noted that the Cumulative intrusion (ml/gr) of Category III, considering the pore size and the applied pressure, is less than the other two categories.
From Diagram 13 and Diagram 14, it is also found that the cumulative pore area (m2/gr) considering the pore size and the applied pressure of Category III, is
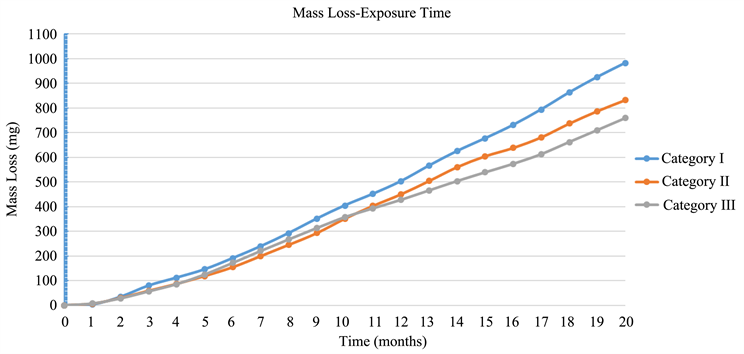
Diagram 3. Mass loss—Exposure time.
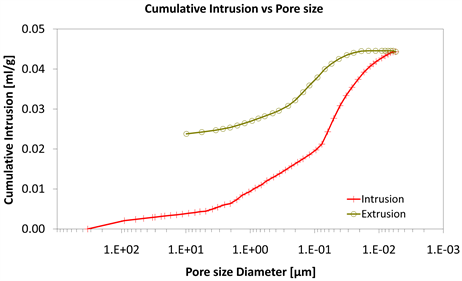
Diagram 4. Cumulative intrusion vs pore size.
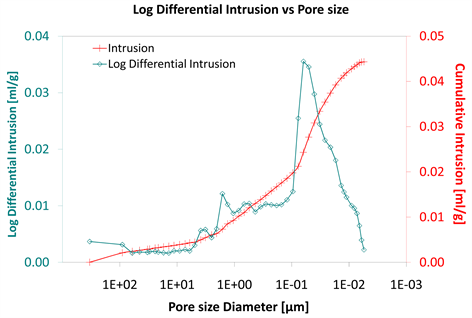
Diagram 5. Log differential intrusion vs pore size.
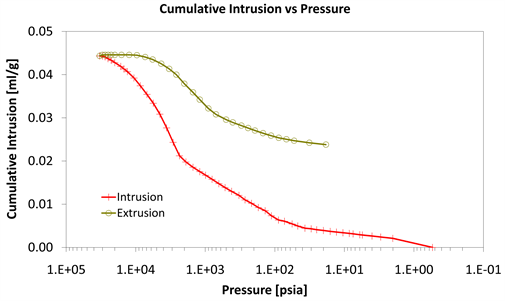
Diagram 6. Cumulative intrusion vs pressure.
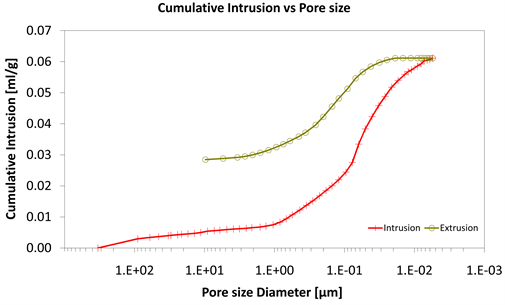
Diagram 7. Cumulative intrusion vs pore size.
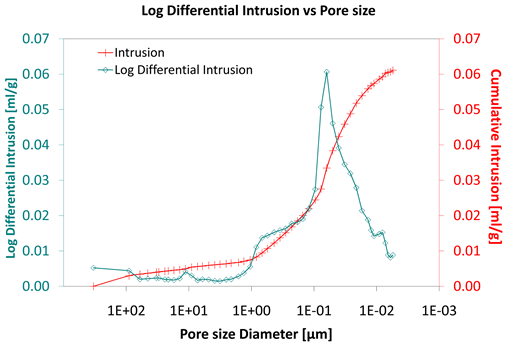
Diagram 8. Log differential intrusion vs pore size.
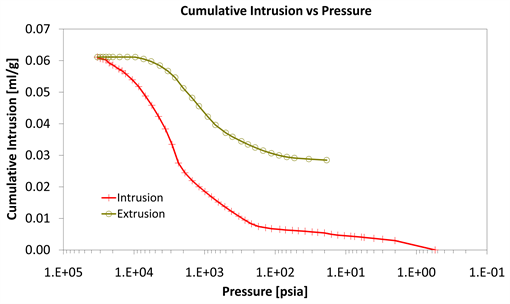
Diagram 9. Cumulative intrusion vs pressure.
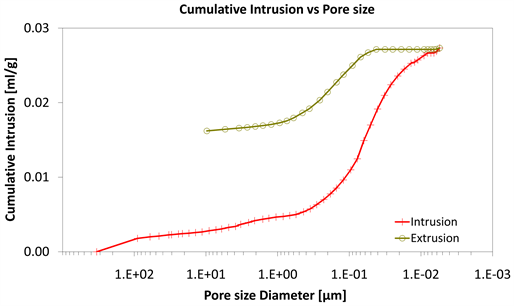
Diagram 10. Cumulative intrusion vs pore size.
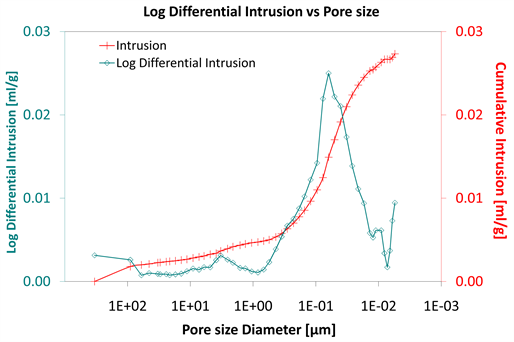
Diagram 11. Log differential intrusion vs pore size.
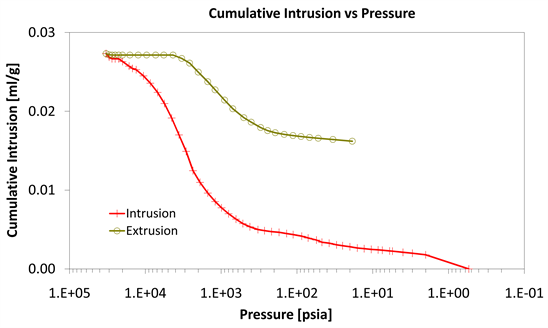
Diagram 12. Cumulative intrusion vs pressure.
![]()
Table 5. Calculated mass loss per each category.
less than the other two categories.
Considering the log differential intrusion of Category III, in relation to the pore size diameter, it is also found less than the other two categories (Diagram 5, Diagram 8 and Diagram 11).
Regarding the other two categories, it is noted that Cumulative intrusion (ml/gr) of Category II, considering the pore size and the applied pressure (Diagram 4, Diagram 6, Diagram 7 and Diagram 9) is more than Category I. Furthermore, based on the Diagram 13 and Diagram 14, the cumulative pore area (m2/gr) considering the pore size and the applied pressure of Category I, is less than in the Category II.
Also, the log differential intrusion of Category II, considering the pore size diameter, is more than Category I (Diagram 5 and Diagram 8).
Moreover, Table 6 summarizes the values of the most characteristic sizes.
Based on the above results, it is concluded that specimens in Category III meets the lower value in every tested characteristic. In particular, total intrusion volume, total pore area, porosity and stem volume are significant low comparing to other specimen categories. It is also noted that porosity (%) value of Category III is the half comparing to the Category I.
It is well known that the electrical conductivity of cement based material is a crucial factor in the corrosion of steel in mortar and concrete. In particular, upon increase of electrical conductivity, the corrosion rate also increases. Considering
![]()
Diagram 13. Cumulative pore area vs pore size.
![]()
Diagram 14. Cumulative pore area vs pressure.
![]()
Table 6. Values of the most characteristic sizes from MIT measurements.
the additives of CNTs/CNFs, these are found to increase the electrical conductivity, whereas, on the other hand, decrease the porosity and consequently degrease the corrosion rate.
In the present study, three different types of mortar specimens with 0.1% wt additives of CNTs and CNFs were studied regarding their protection level against corrosion by chloride ions, which is the most critical type of corrosion in steel bars of mortar structures. For the assessment of the corrosion performance electrochemical parameter such as the corrosion potential, the corrosion current density and the electrochemical mass loss were investigated, therefore the test results show that corrosion rates are affected by the addition of CNTs and CNFs to Portland cement mortars and protected the embedded steel. The result of mercury porosimetry agreed with this point of view.
The above conclusions seem to result in the common agreement with the findings of Konsta-Gdoutos et al. [11] who reported that the addition of 0.1% wt CNTs and CNFs increases the corrosion resistance of steel in mortars. Furthermore, the findings of Shi et al. [27] who reported that the incorporation of CNTs/CNFs affects the electrical conductivity of cement-based materials are also confirmed with the results of the current study.
The above results, meet also with the findings of Hassan et al. [28] where it is assumed that CNTs have higher corrosion tendency compared to plain concrete. It is mentioned that the results of this paper come from a very accelerated test of anodic charge, where one portion of steel was exposed to corrosion environment.
Considering the porosimetry results, based on the current study, it is assumed that the specimens of CNFs additives, result in a lower value in the total intrusion volume, total pore area, porosity and stem volume compared to other specimen categories. These results meet agreement with the findings of Shi et al. 3 who reported that the incorporation of CNTs/CNFs affects the microscopic characteristics and deformation of cement-based materials, and in particular, CNTs/CNFs can fill the cracks and pores in the cement matrix resulting in lower porosity and denser materials.
In regard to the permeability effect, the results of this study meet with the findings of Wang et al. [29], who reported that CNF can be incorporated to reduce the permeability of concrete.
Considering the findings of Del Carmen Camacho et al. [30], the current study concludes with the opposite result that the addition of CNT could imply the development of higher levels of corrosion in aggressive conditions. It should be highlighted that the specimens of the Del Carmen Camacho’s study are made of cement paste, while the specimens of the present study are made of mortar. Also the specimens of the Del Carmen Camacho’s study were covered with a paste cement cover of 6 mm, whereas the present specimens are covered with a cover layer of 25 mm mortar.
4. Conclusions
The above experiments, aim to present an assessment of the corrosion rate determination, therefore, the statistical analysis of the test results it is found a significant impact of the nano additives against corrosion while exposure to extremely corrosive conditions.
In particular, based on the above analysis, the main conclusions can be drawn:
1) The presence of CNFs and CNTs decreased the rate of corrosion compared with the samples with mortar without nano components.
2) CNFs and CNTs decreased the porosity of cement mortars. This reduction remains despite the 20 months’ stay in a chloride environment.
3) CNFs have a better performance than CNTs.