Survival Rate Analysis on Breast Cancer Cases at Univesity College Hospital, Ibadan, Nigeria ()
1. Introduction
Everyone, whether male or female, is born with some breast cells and tissues. Although males do not develop milk-producing breasts, as it remains rudimentary a man’s breast cells and tissues can still develop cancer. Even so, male breast cancer is very rare unlike breast cancer occurrence in the female gender. Less than one percent of all breast cancer cases develop in men, and only one in a thousand men will ever be diagnosed with breast cancer. The American Cancer Society estimates for breast cancer in men in the United States in 2017 are: about 2470 new cases of invasive breast cancer will be diagnosed and about 460 men will die from breast cancer.
Breast cancer is the most common type of cancer in women both in the developed and the developing world and it is the second leading cause of cancer death among women. Each year it is estimated that over 252,710 women in the United States will be diagnosed with breast cancer and 40,500 will die. On average, every 2 minutes a woman is diagnosed with breast cancer and 1 woman will die of breast cancer every 13 minutes [1] and [2].
The incidence of breast cancer is increasing in the developing world due to increase life expectancy, increase urbanization and adoption of western lifestyles. It is estimated that worldwide over 508,000 women died in 2011 due to breast cancer (Global Health Estimates, WHO 2013). Although breast cancer is thought to be a disease of the developed world, almost 50% of breast cancer cases and 58% of deaths occur in less developed countries [3].
Breast cancer begins when healthy cells in the breast change and grow uncontrollably, forming a mass or sheet of cells called a tumor. A tumor can be cancerous or benign. A cancerous tumor is malignant (meaning it can grow and spread to other parts of the body). A benign tumor means the tumor can grow but will not spread. Breast cancer spreads when cancer grows into other parts of the body or when breast cancer cells move to other parts of the body through the blood vessels and/or lymph vessels, this is called metastasis. Breast cancer most commonly spreads to the regional lymph nodes. The regional lymph nodes are located under the arm, in the neck, under the chest bone, or just above the collarbone. When cancer spreads further through the body, it most commonly spreads to the bones, lungs, and liver. Less often, breast cancer may spread to the brain. If cancer cells reappear after initial treatment, they can recur locally, meaning in the breast and or regional lymph nodes. It can also recur elsewhere in the body, called distant metastases [4] [5] and [6].
In Nigeria, some 100,000 new cases of cancer occur every year, with high case fatality ratio. With approximately 20% of the population of Africa and slightly more than half the population of West Africa, Nigeria contributed 15% to the estimated 681,000 new cases of cancer that occurred in Africa in 2008. Similar to the situation in the rest of the developing world, a significant proportion of the increase in the incidence of cancer in Nigeria is due to increasing life expectancy, reduced risk of death from infectious diseases, increasing prevalence of smoking, physical inactivity, obesity as well as changing dietary and lifestyle patterns. In Nigeria, there is no data on breast cancer in young females. Most lumps in young women are benign and physiological leading to low level of suspicion. It is, therefore, possible for physicians to pay less attention to breast lumps in young women. There is a need for a change of attitude because any woman can be diagnosed with breast cancer. Breast lumps in young women should be taken seriously because the diagnosis of breast cancer in this age group is more challenging due to the dense breast tissue making the clinical evaluation of such lumps difficult. The diagnosis of breast cancer in young women has more implications than in the elderly counterparts. The disease in this age group is noted to be diagnosed at more advanced stage, more aggressive, associated with higher mortality, shorter disease-free survival and is more likely to recur after treatment both loco-regionally and at distant sites than in older women. Young women are also faced with more complex issues relating to fertility, raising a family, premature menopause, and continuation of work during and after treatment. The diagnosis and treatment of breast cancer are always long and expensive and the same treatment is given to both young and older patients namely local (surgery and radiotherapy) and systemic (chemotherapy and hormonal therapy). These have economic implications in form of absence from work/business, lack of employment, high cost of treatment and high cost of palliative care. There is also associated psychological impact related to change in body images like loss of breast or scar on breast and negative feelings like sadness, anger, guilt and frustration [7].
Developing countries are experiencing demographic and epidemiologic transitions, and the prevalence of non-communicable diseases such as cancers is on the increase. One of the commonest female malignancy diseases across the world which Nigeria is not exempted from it is Breast cancer. It is more common in the middle and older age groups than in young women. Women of 40 years and below are referred to as young women. In the United State of America, 5% of breast cancer cases occur in this age group of forty years and below. Globally, Cancer has become a major source of morbidity and mortality. In 2008, there were 12.7 million new cases and 7.6 million cancer-related deaths. Fifty-six percent (56%) of the newly reported cancer cases occurred in developing countries and it is projected that by 2030, seventy percent (70%) of cancer cases will be found in developing countries. Most of this increase in incidence is a result of population growth and increased life expectancy. Ntekim et al., 2009 [8], reported the trend of breast cancer in young females in Ibadan, Nigeria. They further reported in their article that the occurrence of breast cancer among young females in Australia forms 6% while 9.6% of breast cancer is recorded among young females in South Korea. The prevailing opinion, therefore, is that young women do not develop breast cancer due to the low incidence rate compared with occurrences of the incidence in older women. There are many different types of breast cancer, with different stages or spread, aggressiveness, and genetic makeup. Survival rates for breast cancer may be increased when the disease is detected in its earlier stage through mammograms. The implementation of mass screening would result in increased caseloads for radiologists which will increase chances of improper diagnosis. Breast cancer survival rates vary greatly all over the world, ranging from 80% or over in North America, Sweden and Japan to around 60% in middle-income countries and below 40% in low-income countries [9]. The low survival rates in less developed countries can be explained mainly by the lack of early detection programs, resulting in a high proportion of women presenting with late-stage disease, as well as the lack of adequate diagnosis and treatment facilities. Although some risk reduction might be achieved with prevention, these strategies cannot eliminate the majority of breast cancers that develop in low and middle-income countries where breast cancer is diagnosed in very late stages.
Therefore, early detection in order to improve breast cancer outcome and survival remains the cornerstones of breast cancer control [9] [10] reported that out of one thousand one hundred and forty-eight (1148) patients in Iran that were included in the analysis of breast cancer patients using Kaplan-Meier estimator, 859 were alive at the end of follow up, 269 had died, and 20 were lost to follow up. Median follow-up time from the first pathological diagnosis until the time of death or the end of study was 34 months. Mean age at diagnosis was 47 years (Ranged from 19 to 86 years). Three and five-year overall survival rates in southern Iran were found to be 76% and 58% respectively. Two studies in have previously reported 5-year overall breast cancer survival in Iran and these were 60% and 62%. The 5-year survival rates in Iran compared with 46% in India, 64% in Oman, 65% in Greece, 71% in Germany, 78% in Belgium, 89% in the USA and 84% in the United Kingdom which shows that Iran has considerably poorer survival than European countries and the United States. Several possible reasons for this are that the awareness of breast cancer is limited among Iranian women and also there are strong cultural barriers that hinder Iranian women from consulting with a physician for sensitive female-specific female health problems.
Esmail-Akbari, et al. [11] provided a report on the analysis carried out on 6147 breast cancer patients diagnosed between 2001 and 2006. Using the Life table method, it was gathered that about 80.4% (4940 patients) were alive during the follow-up time. The mean age was 49.84 ± 12.36 years where half of the patients were 49 years old and younger. The most common pathological type of tumor was IDC (Invasive Ductal carcinoma). He reported that breast cancer survival has slowly increased in developed countries, where it now reaches 85%. As Akbari et al. mentioned, the five-year survival rate was 81%, and ten-year was 77%. A study on private breast cancer institute data showed that five-year survival rate is 89% which is comparable with developed countries.
According to the research carried out on breast cancer in young females with ages less than or equal to forty (40) years treated at the Radiotherapy Department of the University College Hospital, Ibadan, Nigeria. A total of 763 cases were evaluated out of which 221 (28.96%) were 40 years and below. Stage I disease was diagnosed in 5 (2%) of the patients while 29 (13%) had stage II disease. Stages III and IV were diagnosed in 102 (46%) and 85 (39%) of the patients respectively [8].
Esmail-Akbari, et al. [11], reported that a total of 2927 incident cases of breast cancer (2909 in women and 18 in men) were diagnosed in British Columbia. The majority of cases 2412 (82%) represented invasive disease (stages I to IV), whereas 424 (14%) were in situ (Stage 0) and 91 (3%) had unknown stage. Using the Kaplan-Meier estimator, the estimator shows that about 70% were either stage I or stage II at diagnosis. Most cases of breast cancer 2500 (85%) were diagnosed in patients between 40 and 79 years. Overall, the median age at diagnosis for all stages was 61, with only 127(4%) patients younger than 40 and only 300 (10%) 80 or older. The percentage of those presenting with more advanced disease (i.e. stage III and IV) was greater among elderly patients than among younger patients (20% (59/300)) of those 80 years or older and 11% (297/2627) of those younger than 80 years. The five-year relative survival rate for the entire cohort of patients with a diagnosis of breast cancer in British Columbia was 90% (95 CI 88% - 91%). [9], reported that out of 833,530 women with breast cancer, the mean age at diagnosis was 62.5 years ( these ranges between 60.6 - 63.9). The Kaplan-Meier estimator revealed that relative survival was more than 90% at 1 year and was between 82% - 88% at 5 years. 5-year and conditional 5-year estimates for 2005-2007 in the United Kingdom and Denmark were still lower than it was in Australia, Canada and Sweden with Norway in an intermediate position. Survival in the United Kingdom was lower in all age groups between the years 1995-1999, and 20% lower than that of Australian and Canadian jurisdiction for women aged 65 years or older at diagnosis. The rationale behind this study is that Statistics about breast cancer provided above have been centered on overall survival rate, five-year survival rate, and mean age at diagnosis which cannot satisfy human need. Those numbers cannot help answer essential questions such as; how is survival time of breast cancer patients distributed among stages of the disease? How do factors such as age, gender, ethnic group, stage of tumor, and type of cancer affect survival time? The main purpose of this study is to answer the questions above using information provided by the Medical Record Unit of the University College Hospital, Ibadan. The significance of this retrospective study aimed at estimating the survival rate of breast cancer patients attending the University College Hospital, Ibadan. Findings from this study will provide useful information on how survival times of breast cancer patients are distributed among the stages of the disease.
2. Literature Review
Survival analysis is generally defined as a set of methods for analyzing data where the outcome variable is the time until the occurrence of an event of interest. A survival rate summarizes the probable frequency of specific outcomes for a group of patients at a particular point in time. The event could be death, occurrence of a disease, marriage, divorce, etc. [12]. The time to event or survival time can be measured in days, weeks, years, etc. In survival analysis, subjects are usually followed over a specified time period and the focus is on the time at which the event of interest occurs. For a certain category of patient, one might be interested in the proportion of patients that is likely to be alive at the end of a specified interval, such as 5 years. The starting time for determining survival of patients depends on the purpose of the study. For example, the starting time for studying the natural history of particular cancer might be defined in reference to the appearance of the first symptom. Various reference dates are commonly used as starting times for evaluating the effects of therapy. These include date of diagnosis, date of the first visit to physician or clinic, date of hospital admission, date of treatment initiation, date of randomization in a clinical trial evaluating treatment efficacy, and others. At any given time, the vital status of each patient is defined as alive, dead, or unknown (i.e., lost to follow-up). The endpoint of each patient’s participation in the study is a specified terminal event such as death, survival to the completion of the study, or loss to follow-up. In each case, the observed follow-up time is the time from the starting point to the terminal event, to the end of the study, or to the date of last observation. This observed follow-up may be further described in terms of patient status at the endpoint, such as the following:
· Patient that was alive and are tumor free with no recurrent of tumor.
· Patient that was alive after experienced recurrent of tumor.
· Patient that was alive with persistent tumor or patient with metastatic disease.
· Patient alive with primary tumor.
· Patient that died can also be categorize as.
· Patient that died as a result of post operative complication.
· Patient that died as a result of unknown causes and the patient that died as a result of lost to follow up.
Completeness of the follow-up is crucial in any study of survival, because even a small number of patients lost to follow-up may lead to inaccurate or biased results. The maximum possible effect of bias from patients lost to follow-up may be ascertained by calculating a maximum survival rate, assuming that all lost patients lived to the end of the study. A minimum survival rate may be calculated by assuming that all patients lost to follow-up died at the time they were lost.
2.1. Causes of Breast Cancer
Experts are not definitively sure what causes breast cancer. It is hard to say why one person develops the disease while another does not. We know that some risk factors can impact a woman’s likelihood of developing breast cancer. These are: Getting older, Genetics, history of breast cancer, Having had certain types of breast lumps, Dense breast tissue, Estrogen exposure, Obesity, Height (taller-than-average height women), Alcohol consumption, Radiation exposure (undergoing X-rays and CT scans), Hormone replacement therapy (HRT) and working at night prior to a first pregnancy.
2.2. Breast Cancer Treatments
The treatment of breast cancer involves a multidisciplinary team which may consist of an oncologist, radiologist, specialist cancer surgeon, specialist nurse, pathologist, radiographer, and reconstructive surgeon [13]. Sometimes the team may also include an occupational therapist, psychologist, dietitian, and physical therapist. The team will take into account several factors when deciding on the best treatment for the patient, these include: The type of breast cancer, the stage and grade of the breast cancer (this depends on how large the tumor is and whether the tumor has spread or not), whether or not the cancer cells are sensitive to hormones, the patient’s overall health, the age of the patient (the patient menopause also has to be considered) and the patient’s own preferences.
The main breast cancer treatment options may include: Surgery, Chemotherapy, Radiation therapy, Hormone therapy and Biological therapy (targeted drug therapy).
3. Materials and Methods
Observations are called censored when the information about their survival time is incomplete. The most commonly encountered form is right censoring. Suppose patients are followed in a study for 20 weeks. A patient who does not experience the event of interest for the duration of the study is said to be right censored. The survival time for this person is considered to be at least as long as the duration of the study. Another example of right censoring is when a person drops out of the study before the end of the study observation time and did not experience the event. This person’s survival time is said to be censored, since we know that the event of interest did not happen while the person was under observation. Censoring is an important issue in survival analysis, representing a particular type of missing data. Censoring that is random and non-informative is usually required in order to avoid bias in survival analysis [14].
Unlike ordinary regression models, survival methods correctly incorporate information from both censored and uncensored observations in estimating important model parameters. The dependent variable in survival analysis is composed of two parts: one is the time to event and the other is the event status, which takes the records whether event of interest occurred or not. One can then estimate two functions that are dependent on time, the survival and hazard functions. The survival and hazard functions are key concepts in survival analysis for describing the distribution of event times. The survival function gives, for every time, the probability of surviving (or not experiencing the event) up to that time. The hazard function gives the potential that the event will occur, per time unit, given that an individual has survived up to a specific time. While these are often of direct interest, many other quantities of interest (e.g., median survival) may subsequently be estimated in order to know the hazard or survival function. It is generally of interest in survival studies to describe the relationship of a factor of interest (e.g., treatment) with the time of event, in the presence of several covariates, such as age, gender and ethnicity.
The analysis of survival data of breast cancer patients and related outcomes is necessary to assess breast cancer treatment programs and to monitor the progress of regional and national cancer control programs. The appropriate use of data from cancer registries for outcomes analyses requires an understanding of the correct application of appropriate quantitative tools and the limitations of the analyses imposed by the source of data, the degree to which the available data represent the population, and the quality and completeness of registry data.
Survival analysis, however, is somewhat more complicated than it might appear. If one were to measure the length of time between diagnosis and death or record the vital status when last observed for every patient in a selected patient group, one might be tempted to describe the survival of the group as the proportion alive at the end of the period under investigation. This simple measure is informative only if all of the patients were observed for the same length of time. Patients diagnosed near the end of the study period are more likely to be alive at last contact and will have been followed for less time than those diagnosed earlier. Even though it is not possible to follow these persons as long as the others, their survival might eventually prove to be just as long or longer. Although we might not know the complete survival time for these individuals, it is important we know the minimum survival time (time from diagnosis to last known contact date), which is valuable in estimating survival rates. Similarly, it is usually not possible to know the outcome status of all the patients who were in the group at the beginning. People may be lost to follow-up due to many reasons such as change of names, change of physicians, relocation, etc. Some of these individuals may have died and others could be still living.
Thus, if a survival rate is to describe the outcomes for an entire group accurately, there must be other means to deal with the fact that different people in the group are observed for different lengths of time and that for some patients, their vital status is not known at the time of analysis. In the language of survival analysis, subjects who are observed until they reach the endpoint of interest (e.g., recurrence or death) are called uncensored cases, and those who survive beyond the end of the follow-up or who are lost to follow-up at some point are termed censored cases. Although overall group survival is informative. Comparisons of the overall survival between two groups often are confounded by differences in the patients, their tumors, or the treatments they received. For example, it would be misleading to compare the overall survival for the sample of all breast cancer cases with the overall survival for a sample of breast cancer patients who were diagnosed with more advanced diseases whose survival would be presumed to be poorer. The simplest approach to account for possible differences between groups is to provide survival results that are specific to the categories of patient, disease, or treatment that may affect results. In most cancer applications, the most important variable by which survival results should be subdivided is the stage of disease at the time of diagnosis. Although the factors that affect survival may be unique to each type of cancer, it has become conventional that a basic description of survival for specific cancer should include stage and age. Treatment is a factor by which survival is commonly subdivided, but it must be kept in mind that selection of treatment is usually related to other factors that exert influence on survival. For example, in cancer care the choice of treatment is often dependent on the stage of disease at diagnosis. It is possible that the differences between two groups at each comparable time of follow-up do not differ significantly but when the survival curves are considered in their entirety, the individual insignificant differences combine to yield a significantly different pattern of survival. The most common statistical test that examines the whole pattern of differences between survival curves is the log-rank test. This test equally weights the effects of differences occurring throughout the follow-up and is the appropriate choice for most situations [13].
This study is aimed at estimating the survival rate of breast cancer patients attending the Radiation Oncology Department, University College Hospital, Ibadan, Nigeria. The University College Hospital (UCH), Ibadan is an 850-bed Teaching hospital founded in the year 1948 and located in Ibadan, Oyo State, Nigeria. It is a centre of excellence for health manpower training, research and clinical services.
3.1. Method of Data Collection
Study Site
The study was carried out in the Radiation Oncology Department, University College Hospital, Ibadan. The study population is the case files of patients with breast cancer. The inclusion criteria were the case file of breast cancer patients within age 18 years to 80 years and above will be included in the study while the exclusion criteria were the Case file of patients with no histological diagnosis that was excluded from the study. The available daily data on cancer cases in the Radiation Oncology Department, University College Hospital, Ibadan between 8th of January 2015 and 22nd of December 2015 was used. The categories of the qualitative variables are gender, occupation, type of cancer and ethnic group.
3.2. Ethical Consideration
3.2.1. Confidentiality of Data
All information collected in the study was coded using serial numbers ranging from 1, 2…N where the number symbolizes the name of the patients. This would ensure that the name of the patient will not be linked to the information provided for the study.
3.2.2. Data Collection Procedure
Data were extracted from the case files of patients using a pro forma. The variables of interest are age of patients, ethnic group, stage of tumor, type of cancer, occupation, marital status, mortality pattern of patients and follow-up period.
3.3. Data Analysis Method
Data Obtained will be analyzed using IBM-Statistical Package for Social Science (IBM-SPSS). Kaplan-Meier (K-M) Method will be used to estimate the survival rate of breast cancer patients. Log-rank will be used to compare survival curves for the stages of tumor. Multivariate Cox regression will be used to investigate the effects of several variables on the survival of patients.
3.3.1. Kaplan-Meier Method
Kaplan-Meier (K-M) method or product limit method is a statistical technique used to analyze
survival data. The estimate is named after Edward L. Kaplan and Paul Meier. It is applied in analyzing the distribution of the patient’s survival times following their recruitment into the study. The analysis expresses this in terms of proportion of patients still alive up to a given time following the recruitment or entry into the study. The Kaplan-Meier estimator is also called nonparametric maximum likelihood estimator. The method computes the probability of dying at a certain point in time conditional to survival, up to that point. It utilizes the information of uncensored individuals till the point when the patient is censored [15]. Thus, it maximizes utilization of available information on time to event of the study sample. This is a modified form of the “Life Table” technique, with the condition that each time interval contains exactly one event, and event occurs at the beginning of the time interval. In clinical studies, individual data are usually available on time to death or time to last seen alive.
The life table technique is one of the oldest methods for analyzing survival statistical method to study human mortality rigorously, but its importance has been reduced by modern methods, like Kaplan-Meier method. This estimator incorporates information from all observations available, both censored and uncensored, by considering any point in time as a series of steps defined by the observed survival and censored times. Kaplan and Meier were the first to carry out the solution of a problem to estimate the survival curve in a simple way while considering the right censoring. A plot of the Kaplan-Meier estimate of the survival function is a series of horizontal steps of declining magnitude that when large enough samples are taken, approaches the true survival function for that population. The value of the survival function between successive distinct sampled observations is assumed to be constant. The Kaplan-Meier estimator for the survival curves is usually used to analyze individual data, whereas life table method applies to group data. Kaplan-Meier is an extension of the concept of life table for analysis of censored data. Since the life table method is a group data statistic, it is not as precise as the Kaplan-Meier estimate, which uses individual values [16].
The Kaplan-Meier survival curves can give an insight into the difference in survival functions of two or more groups, but whether this observed difference is statistically significant requires a statistical test. The survival curves can be compared statistically by testing the null hypothesis that there is no significant difference in survival among the two or more groups. For example, does the new treatment for a particular disease such as AIDS have any therapeutic benefit in extending life? A study could be conducted using two groups of AIDS patients, one receiving traditional therapy and the other receiving experimental treatment. Constructing a Kaplan-Meier model from the data would allow one to compare overall survival rates between the two groups to determine whether the experimental treatment is an improvement over the traditional therapy. A survival or hazard function can also be plotted in order to compare them visually for more detailed information.
The distribution of survival times is divided into a certain number of intervals. For each interval, the number and proportion of cases or objects that entered the respective interval alive are computed; the number and proportion of cases that failed in the respective interval (number of terminal events, or number of cases that died) and the number of cases that were lost or censored in the respective interval will also be computed. Based on these numbers and proportions, several additional statistics can be computed; such as number of cases at risk, proportion failing, proportions surviving, the survival function, the hazard rate and median survival time. This procedure is used for large samples where the time intervals are large enough to be broken down into smaller units [14].
Kaplan-Meier curves have attractive properties, which perhaps explains their popularity in medical research for over half a century, they provide a visual depiction of all the raw data, the failure times (the “steps” down) and the censoring times (the vertical bars), yet they also provide a mathematical estimate of the underlying probabilistic model. An important advantage of the K-M curve is that the method can take into account some types of censored data, particularly right-censoring, which occurs if a patient withdraws from a study. On the plot, small vertical tick-marks indicate losses, where a patient’s survival time has been right-censored. When no truncation or censoring occurs, the K-M curve is the complement of the empirical distribution function [17].
Three assumptions are made when carrying out a K-M analysis:
1) First, those who are censored had the same probability of death as those who remained in the study.
2) Second, it is assumed that the probability of surviving is the same for all individuals recruited to the study, regardless of whether this was at an early or late point in the recruitment period.
3) Thirdly, it is assumed that the exact date at which death occurred was known.
Kaplan-Meier Method is based on the basic idea that the probability of surviving P or more periods from entering the study is the product of the P observed survival rates for each product i.e. the cumulative survival, which is given by:
where
K1 = Proportion of surviving the first period.
K2 = Proportion of surviving the second period on the condition of having survived up to the second period and so on.
The proportion surviving period i having survived up to period i is given by:
where
ri = the number alive at the beginning of the period.
di = the number of deaths within the period.
3.3.2. Log-Rank Test
Comparison of two or more survival curves is common practice in medical research. There are a number of methods that can be used to test the equality of survival functions in different groups. The one commonly used, is the nonparametric test for comparison of two or more survival distributions called “log-rank test.” It is appropriate to use when the data are right skewed and censored (technically, the censoring must be non-informative). It is widely used in clinical trials to establish the efficacy of a new treatment in comparison with a control treatment when the measurement is the time to event (such as the time from initial treatment to a heart attack). The test is sometimes called the Mantel-Cox. Another method, generalized Wilcoxon-sum test is used in this case.
Log-rank method works on the same principle as K-M and thus, requires that survival duration is exactly available for both groups. Total expected death for group I and group II are compared with the total observed deaths in group I and group II respectively and the chi-square value with one degree of freedom is obtained. This is used to reject or fail to reject the null hypothesis of the equality of the survival curves. Some properties of log-rank test were studied. The test is more powerful, reliable and appropriate when compared to other tests in a situation where two or more survival curves do not cross i.e. whose hazard functions are proportional.
The test statistics are calculated by
(1)
where Oi is the total number of observed events in group I, Ei is the total number of expected events in group I.
3.3.3. Cox Regression
The Cox regression (proportional hazard regression) is a method for investigating the effects of several variables on the time a specified event takes to happen. In the context of an outcome such as death, this is known as Cox regression for survival analysis. This model is a semi-parametric model which imposes no assumptions about the distribution of survival times (i.e. it does not assume any particular “survival model”). It does not assume that the effects of predictor variables upon survival are constant over time and are additive in one scale. Cox regression extends the group comparison which is performed by the log-rank test to estimate a group difference. The group difference is quantified by an estimate of relative risk. Suppose we are interested in a single covariate then the hazard is:
(2)
The multivariable regression coefficients have the same interpretation as in univariable Cox regression. But multivariable Cox regression gives way to adjusting effects for others.
The equation for Cox regression can easily be extended to multiple covariates:
(3)
4. Data Analysis Results
4.1. Estimate of the Overall Survival Analysis
From Table 1, it was observed that the shortest survival time was 1 week. 104 patients lived up to 1 week, 6 patients died in the 1st week. 98 patients survived at least a little bit longer than 1 week (assuming that censoring at 1 week means surviving a little bit longer than 1 week). Thus, the survival probability at observation 98 is 98/104 = 0.942 = 94.2%. Within the 1st week, 28 patients were lost due to censoring and 4 patients were also lost due to censoring in the 2nd week. Now 66 patients are under observation. After 3 weeks, another patient died, 66 patients were under observation up to the 2nd week before the event occurred after the 3rd week. Hence 65 patients survived that time point. The survival probability at the 3rd week is 65/66 = 0.984 = 98.4%, but this probability is conditional that a patient lived up to 3 weeks. To obtain a cumulative survival probability, survival at all time points before the 3rd week is considered. Thus, we have a cumulative survival probability of 94.2% × 98.4% = 92.7%.
The computation is carried on until the last patient died or was censored. The overall cumulative survival probability obtained from the table is 0.175 = 17.5%.
From Table 2, it was observed that the overall estimated mean time until death is 28.751 weeks and median time between admission into the Radiation Oncology Department and death is 23 weeks.
![]()
Table 1. Table showing the overall survival probability.
![]()
Table 2. Table showing the overall mean and median survival time.
It was observed from Figure 1, that the curve crossed 50% survival at the time of 23 weeks. This is a Kaplan-Meier curve in which the curve stays at a certain level until the next event occurs. At each event time, the curve drops. The step height provides an estimate of the risk of death at certain time points.
From Figure 2, we observed that the step of heights of the Kaplan-Meier curve was related to the total height of the curve at the times the step occurs and cumulating them generates a cumulative hazard plot. From the relative height step of Kaplan-Meier curve, it can be observed that the risk to die increases with time.
4.2. Estimate of the Survival Times Based on the Stages of Tumor
From Table 3, it can be observed that a total number of 37 patients had stage I tumor with 3 events (death) and 34 censored observations, 9 patients had stage II tumor with 1 event and 8 censored observations, 22 patients had stage III tumor with 12 events and 10 censored observations, 36 patients had stage IV tumor with 14 events and 22 censored observations. The total number of patients recorded is 104 patients with 30 events and 74 censored observations.
H0 = Survival times do not differ with the stages of tumor.
H1 = Survival time differs with the stages of tumor.
The p-value (Sig) is the probability of getting a test statistic of at least 23.453 if there is no difference in survival times for all stages of tumor.
Rejection criteria: Reject H0 if p-value (Sig) < 0.05.
![]()
Figure 1. Figure showing the Kaplan-Meier curve of the cumulative survival probability against the number of weeks of observations of the patients.
![]()
Figure 2. Figure showing the hazard curve.
![]()
Table 3. Table showing the descriptive statistics of the stages of tumor.
![]()
Table 4. Table showing the comparison of survival times among the stages of tumor.
Since the p-value is less than 0.05, there is significant evidence of a difference in survival times for the stages of tumor (Table 4).
From Figure 3, we noticed that the survival probability is lower for patients with stage III tumor than any other stage of tumor as its curve dips lower than other stages of tumor. Hence, patients with stage III tumor are less likely to survive.
4.3. Estimate of the Mean Survival Times for the Stages of Tumor
From Table 5, it was observed that the estimated mean time until death for stage I, stage II, stage III and stage IV tumor are 40.101, 40.000, 12.275 and 21.754 weeks respectively. Hence, it can be deduced that stage I tumor patients have an increased chance of survival.
4.4. Cox Regression for Survival Analysis
From Table 6, a bar chart showing the distribution of the relative risk against the stages of cancer is shown in Figure 4
From Table 6 and Figure 1 the following were observed:
A relative risk of 0.647 indicates that patients with stage I tumor die at a rate of 0.647 times that of stage IV which serves as a reference category, its p-value > 0.05 indicates that stage I tumor is not an important predictor of chances of survival. Patients with Stage II tumor die at a rate of 8.887 times that of stage IV tumor and its p-value < 0.05 indicates that Stage II tumor is an important predictor of chances of survival. Patients with Stage III tumor die at a rate of 4.950 times that of stage IV and its p-value < 0.05 also indicates that Stage III tumor is an important predictor of chances of survival.
Also, with relative risk value, we noticed from Table 6 and Figure 1 that; patients with stage I of cancer tumor were 35.3 percent less likely to die than patients in stage II cancer tumor and that of stage III cancer tumor. Patients in stage II of cancer tumor were less likely to die than patients in stage III cancer tumor and patients in stage III of cancer tumor were less likely to die than patients in group I and that of group II cancer tumor.
From Table 6:
Relative risk of 0.043 indicates that the female gender dies at the rate of 0.043 times that of the male gender which serves as a reference category, its p-value < 0.05 indicates that gender is an important predictor of chances of survival. This might be attributed to the higher number of breast cancer occurrence in the female gender.
From Table 6, a bar chart showing the distribution of the relative risk against the type of cancer on the respondents is shown in Figure 5.
![]()
Figure 3. Figure showing the survival plot comparing survival curves among the stage of tumor.
![]()
Figure 4. Bar chart showing the distribution of the relative risk against the stages of cancer tumor.
![]()
Figure 5. Bar chart showing the distribution of the relative risk against the types of cancer.
![]()
Table 5. Table showing the mean survival time for the stages of tumor.
![]()
Table 6. Table showing cox regression analysis result based on stages of tumor, gender, type of cancer, marital group, ethnic group, occupation and patients age at entry into the study.
From Table 6 and Figure 2, the following was observed:
Relative risk of 0.357 indicates that patients with Invasive Ductal Carcinoma die at a rate of 0.357 times that of the other types of breast cancer while patients with Invasive Lobular Carcinoma die at a rate of 0.365 times that of other types of cancer, both p-values > 0.05 indicates that these two types of cancer are not an important predictor of chances of survival.
Relative risk of 40.931 indicates that Patients that are either married, widowed or divorced die at a rate of 40.931 times those that never married (single), p-value > 0.05 indicates that marital status is not an important predictor of chances of survival.
![]()
Figure 6. Bar chart showing the distribution of the relative risk against the respondents ethnic group.
From Table 6, pie chart showing the distribution of the relative risk against the occupational type of the respondent is shown in Figure 3.
From Table 6 and Figure 6, the following was observed:
Relative risk of 0.135 indicates that Yoruba die at a rate 0.135 times that of Hausa while Igbo die at a rate 0.282 times that of Hausa. Both their p-values are >0.05, this indicates that ethnic group is not an important predictor of chances of survival.
In Table 6, a bar chart shows the distribution of the relative risk against the occupational type of the respondent.
Relative risk of 1.747 indicates that patients who are traders die at a rate of 1.747 times other types of occupation, Civil servants die at a rate of 0.702 times that of other occupations and Housewives die at a rate of 1.309 times that of other occupations. Their p-values > 0.05, indicates that occupation is not an important predictor of chances of survival.
p-value of 0.64 indicates that patient’s age at entry into the study is not an important predictor of chances of survival.
5. Findings
In view of the analysis done above, the following findings were arrived at; the overall cumulative survival probability obtained is 0.175 (17.5%). The overall estimated mean time until death is 28.751 weeks. The median time between admission and death is 23 weeks. p-value (0.00032) obtained from comparing stages of tumor is less than 0.05, hence, it is concluded that there is significant evidence of a difference in survival times for the stages of tumor. The survival function plot for the stages of tumor shows that patients with stage III tumor are less likely to survive. From the estimated mean time until death for stages of tumor, it was deduced that patients with stage I tumor have an increased chance of survival.
6. Conclusions
Investigating the effects of the stages of tumor, gender, types of breast cancer, marital group, ethnic group, occupation and patients’ age as entry into the study, the following conclusions were drawn:
1) Stage I tumor is not an important predictor of chances of survival.
2) Stage II and III tumor are important predictors of chances of survival.
3) Survival times differ with stages of tumor.
4) Types of cancer, gender, marital status (single, married, divorced, widowed), ethnic group, occupation and patients age at entry into the study are not important predictor of chances of survival.
5) Survival times of patients differ with stages of tumor.
a) Patients with stage I tumor has an increased chance of survival than all other stages of tumor.
b) Patients with stage III tumor are less likely to survive.
6) Types of cancer, gender, marital status, ethnic group, occupation and age are not important predictor of chances of survival.
Appendix
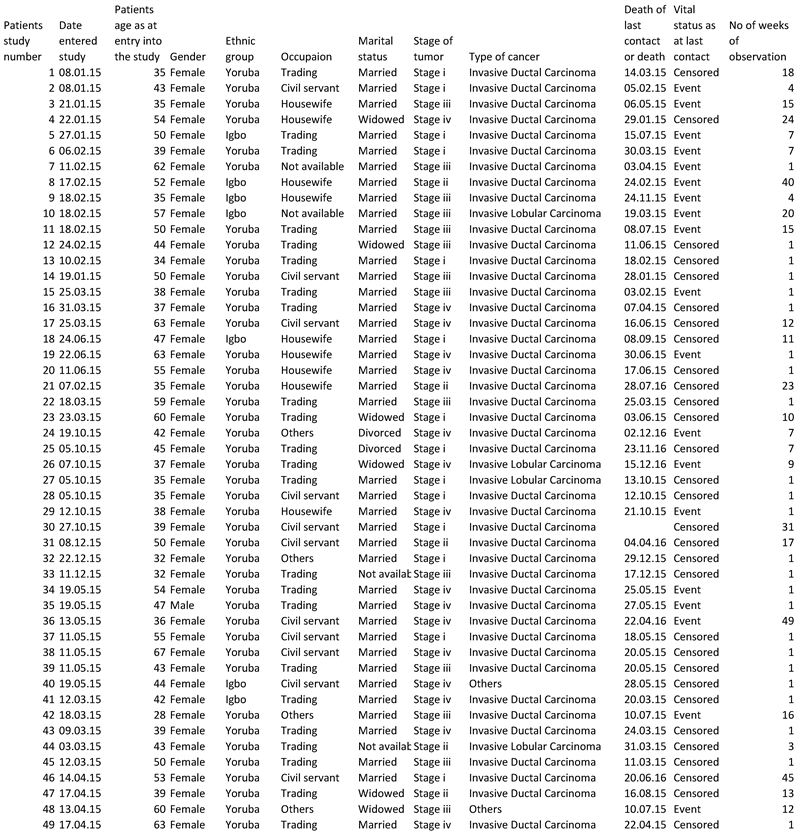
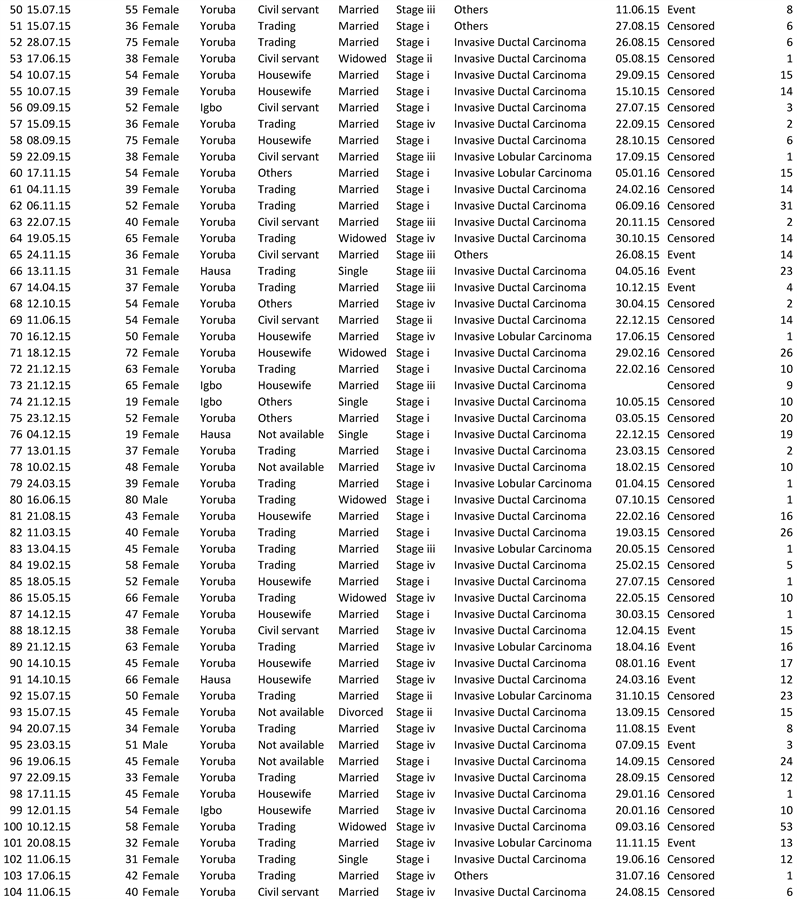
Appendix I
Data on Breast Cancer