The Contribution of Executive Functions, Visual Processing and Reading Skills to the Performance in the Colored Raven Progressive Matrices Test: A Predictive Study among First-to-Fourth Grade Arabic-Speaking Children ()
1. Introduction and Rationale
The Raven Progressive Matrices’ test (RPM) is considered as one of the most widely used instruments that psychologists administer to assess general cognitive ability (Raven, 2000b; Vincent & Cox, 1974). This test is thought to measure the g factor as defined by Spearman’s theory of cognitive ability (Raven, Raven, & Court, 1998). Since its first conception in 1938, the RPM has gained widespread acceptance and use in many countries all over the world (Irvine & Berry, 1988) Mackintosh (1996) described it as “the paradigm test of non-verbal, abstract reasoning ability”. Lynn, Allik, Pullman and Laidra (2004) wrote that the RPM test “is widely regarded as the best test of abstract or nonverbal reasoning ability”.
Previous studies have suggested that RPM norms have proven unexpectedly similar across cultures with a tradition of literacy, at any given point in time (Raven, 2000a). Despite this, comparative studies in Arabic-speaking countries (Abdel-Khalek & Raven 2006), as well as in some African countries (Adot, 2014), suggested that norms might differ between cultures. These findings suggest that cognitive skills that are at the basis of the performance in Raven’s test might, at least partially, be culturally determined. To give one concrete example, a previous study comparing Arabic-speaking and Hebrew-speaking university students (Islam Mahajna, 2012, MA Thesis, University of Haifa) to whom the RPM test was administered showed that Hebrew speakers performed significantly better than Arabic speakers. In the present study, the aim was to assess the performance in the Colored Progressive Matrices test (CPM) of Arabic-speaking children from first to fourth grade and examine to what extent their performance in the CPM could be predicted by cognitive variables. On the basis of previous literature in the field, the study aimed at collecting measures of executive functions (EFs), visual processing (VP) and reading and assessing their contribution to the performance in the CPM.
1.1. What Do the Raven Progressive Matrices Tests Measure?
The RPM tests are thought to measure what many researchers have called “general cognitive ability”, or to measure a specific kind of “meaning making” ability (Raven, 2008). For this later ability, Spearman coined the term “eductive” ability (Raven, 2009). The word “eductive”, deriving from the Latin root educere which means “to draw out from rudimentary experience, means in this context “to construct meaning out of confusion”. Spearman noticed the tendency of tests of what had been assumed to be separate abilities to correlate relatively highly and to suggest that the resulting pattern of inter-correlations could be largely explained by positing a single underlying factor that many people have termed “general cognitive ability”, or the “g” factor, according to Spearman. Spearman deliberately avoided the use of the term “intelligence” to describe this factor since this word was used by people to refer to a huge range of very different things.
1.2. A Short Description of the RPM
Three versions of the RPM test have been published to date: 1) The Standard Progressive Matrices test (SPM): This test was the first to be published and appeared already in 1938. It was designed to test analytical reasoning through visual analogies. This original version of the test is untimed and has been widely used in most countries of the world for almost 80 years now (e.g., Germany, France, Spain, Slovakia, Russia, New Zealand and Australia; norms were obtained later for the UK, USA, China, India, Qatar, Poland, Taiwan, Tunisia and Belgium). The test consists of 60 problems presented in five sets of 12. Within each set, the items are presented in order of increasing difficulty, and at the beginning of a new set they become easy again. The slight increase in terms of difficulty at the beginning of each new set is meant to provide training in the method of thought required for solving the problems. Later on, two other parallel versions of the matrices were developed: The Colored Progressive Matrices (CPM) and the Advanced Progressive Matrices (APM). These tests were conceived in order to assess the upper and lower levels of ability, since the SPM were shown to have limited discrimination at these levels (Raven, 2000b).
2) The Colored Progressive Matrices test (CPM): This test was created as an alternative form of the SPM (Adot, 2014) for children aged 5 - 11, and it first appeared in 1947 in the United Kingdom (UK) and Australia. The CPM was also utilized for the elderly and mentally and physically impaired individuals. In the CPM, the matrices are presented in color to make the test visually motivating and attract children’s attention. The test was revised in 1956 and this version continues to be used today (Raven, Raven, & Court, 1998; Raven, Court, & Raven, 1990). The CPM comprises 36 items divided into three sets of 12 (A, AB and B). Within each set, the items are ordered with increasing difficulty. The sets themselves also vary in difficulty, with set B containing the most challenging items.
3) The Advanced Progressive Matrices test (APM): This test was designed to better assess the above-average participants in the SPM test, which was shown to have a limited discrimination (Raven, 2000b). The APM consists of two sets: a practice set of 12 items, and the main test containing 36 items which are presented in black ink on a white background and become increasingly difficult as progress is made through the test set.
1.3. What Predicts Performance in the Raven Progressive Matrices Test?
In order to be solved, Raven’s problems require varying numbers of rules that are thought to depend on the prefrontal cortex. This region is considered as a key structure underlying complex cognitive processes generally defined under the term executive functions (EFs) that include, among other things, reasoning and problem solving skills (e.g. Luria, 1966; Milner, 1963). Neuroimaging studies have shown that the prefrontal cortex (PFC) is essential for complex cognitive processes, and several have documented an increase in the PFC activation as a consequence of increasing problem difficulty (Baker et al., 1996; Owen et al., 1996; Prabhakaran et al., 1997; Dagher et al., 1999). At the behavioral level, in addition to the contribution of EFs to the performance in RPM, other studies have shown a definite link between visual perception/processing tasks and the performance in the Raven matrices (Rouinfar et al., 2014). The following sections will describe some of the previous research suggesting a relation between executive functions, visual perception/processing and reading abilities and the CPM general non-verbal ability.
Executive functions: The term “executive functions” (EFs) was first introduced by Luria (1966; 1969; 1980) to isolate a particular set of brain functions, such as maintenance of an established behavioral set, cognitive flexibility, concept formation, abstract reasoning, planning, intentional filtering and preserving attention, all of which are often claimed to be the functions used for solving novel problems (Alvarez & Emory, 2006). EFs have also been defined as a construct that embraces general cognitive control and self-regulatory functions (Isquith, Crawford, Espy, & Gioia, 2005). Some authors have attributed particular importance to three of the executive functions—inhibition, shifting and updating—to explain differences in intelligence (Kafadar & Orhan, 2016). These functions are thought to be all working-memory related, hence the tendency to explain EFs in terms of working memory processes (Friedman et al., 2006; Miyake et al., 2000). Working memory (WM) was defined by Baddeley (Baddeley, 2007; Baddeley & Hitch, 1974) as a limited capacity system that temporarily stores and processes information, making it a necessary element of the individual’s ability to perform complex activities such as reasoning, learning and comprehension.
Different studies have shown a link between performance in the RPM and EFs, particularly WM and updating. Verguts and De Boeck (2002) suggested that the positive correlation between WM and RPM is due to the fact people who have a large WM can store more partial elements and therefore will have a higher probability of solving an item. Carpenter, Just and Shell (1990) suggested that WM positively correlates with Raven’s performance because WM is needed to prevent previously learned rule combinations from interfering in problem solving when Raven’s problems require a new rule combination. Belacchi, Carretti and Cornoldi (2010) assessed WM updating and performance in CPM and proposed that that updating information in WM plays an important part in fluid intelligence (as measured by the Raven matrices) in the context of development. In this respect, Miyake, Friedman, Emerson, Witzki, Howertwe and Wagner (2000) suggested that, when studying inhibition, updating and task switching, updating measures were the only predictor of WM performance. In view of these previous findings, one of the objectives of this study was to investigate how executive functions predict performance in the CPM test.
Visual processing/perception and attention: Visual processing is defined as the ability to perceive, analyze, generate, store, retrieve and transform visual images and sensations, and is associated with the ability to recall the location of stimuli and identify, or reproduce, a design (Carroll, 1993; McGrew, 2009). Visual processing abilities are measured, among other things, by tasks requiring the location and the precise identification of visual shapes, as well as tasks that require sustainment of spatial orientation of objects that may change or move through space (Carroll, 1993; McGrew, 2009). Besides that, visual processing is measured by tests that involve visual closure and stability and fluency in “imaging”, the way objects appear in space as they are alternated and turned in various ways (Vanderwood et al., 2002). Previous studies have outlined a connection between different visual processing abilities, such as visual attention (VA), visual-spatial memory (VSM), and visual perception (VP), (Deliyianni, Monoyiou, Elia, Georgiou, & Zannettou, 2009; Fuchs et al., 2005; Leikin, Paz-Baruch, & Leikin, 2013; Taub, Floyd, Keith, & McGrew, 2008). Visual processing skills have been linked to the performance on the RAVEN tests (Rouinfar et al., 2014).
The relationship between measures of visual attention and intelligence has been documented (e.g., Crawford, 1991; Rockstroh & Schweizer, 2001; Schweizer & Moosbrugger, 2004; Schweizer, Zimmermann, & Koch, 2000). For instance, a relation between visual-spatial abilities and general intelligence and academic achievement had also been suggested (Leikin et al., 2013; Johnson & Bouchard, 2005; Rohde & Thompson, 2007). Finally, it had been argued that whenever complex mental activities like problem solving and reasoning (as in the RPM) are to be performed, it is essential to maintain a high level of attention for long periods (Schweizer & Moosbrugger, 2004). Hence, the second objective of this study was to assess the contribution of visual processing/attention abilities to the performance in the Raven test.
Reading: Research suggests that reading ability starts when the child first perceives the visual graphic symbol (Adams, 1990; Ehri & Snowling, 2004; Frith, 1985) and that reading facility depends on visual processing and the ability to deal with written material (Stein & Walsh, 1997). These studies indicate that visual processing skills are highly significant for young children but that they become less relevant with age (Plaza & Cohen, 2007; Tahan, Cline, & Messaoud Galusi, 2011).
Indeed, to be a successful reader, one must rapidly integrate a vast circuit of brain areas with both great accuracy and remarkable speed. This “reading circuit” is composed of neural systems that support every level of language—phonology, morphology, syntax, and semantics—as well as visual and orthographic processes, working memory, attention, motor movements, and higher-level comprehension and cognition (Norton & Wolf, 2012). Indeed, Orton, in his research of children with reading disabilities, suggested that perhaps as many as 10% of children might suffer from reading difficulties as the very complexity of reading requires the integration of several brain areas (Orton, 1925). As our reading abilities develop, the reader develops what is called automaticity. Successful word reading development involves the interrelation and integration of phonology, orthography, and semantics. This is referred to as the “triangle” or connectionist model of reading; with practice, direct connections develop between the three segments (Harm & Seidenberg, 2004; Plaut, McClelland, Seidenberg, & Patterson, 1996; Seidenberg & McClelland, 1989). As this network becomes more automated, word knowledge and meaning increase (Kirby & Bowers, 2017; Perfetti, 2007). This abstract connectionist model of reading can also be mapped onto the neural system where the degree of automaticity is reflected in the neurocircuitry of reading: As children become skilled readers, there is an increase in activity in the left-hemisphere network and a gradual decrease in right-hemisphere areas that are involved in visual memory (Turkeltaub et al., 2003). In other words, visual perception is the initial, underlying ingredient of successful reading, though it quickly becomes “automated” after the first year of learning to read. The development of automaticity at all the lower levels of reading represents the great apex of development that provides us with the bridge to true reading with its capacity to direct cognitive resources to the deepest levels of thought and comprehension. Due to the fact that reading is a complex cognitive skill that relies on various other sub—skills and systems, and to the connection between reading and visual abilities, the aim of this study is also to examine to what extent, the same EFs and visual abilities contribute to the CPM beyond reading.
1.4. The Present Study
Previous studies assessing the relationship between EFs, visual perception and other cognitive variables indicate that different factors might contribute to the performance in the CPM. The objective of the present study was to assess the extent to which EFs and visual processing, especially visual attention, contribute to children’s performance in the CPM test. For this purpose, we tested children from first grade to fourth grade in a battery that included the different sub-domains of EFs and visual processing tests. We hypothesized that links will be found between the performance in CPM, executive functions performance and visual/attentional processes. In addition, we hypothesized that EFs, in particular, WM and shifting/updating, will explain variance in the performance in the CPM. At the same time, on the basis of findings showing a link between reading skills and performance in the RAVEN, we collected reading accuracy and fluency measures to assess the extent to which EFs and visual processing explains variance in the performance of RAVEN beyond reading accuracy.
2. Material and Methods
2.1. Participants
The study included 120 native Arabic-speaking children, aged 6 - 10 years old (M = 8.5, SD = .78) from the first to the fourth grades (30 from each grade). All children were recruited from the same primary school in the north of Israel. All children were administered the Raven’s CPM which include part A, part AB and part B. In addition, all children underwent a battery of EF tests, visual processing tests and a word reading task. Children with a history of neurological disease or known learning disabilities were not included in the study.
2.2. Assessment of Executive Functions
The sub-domains of EFs that were studied in this investigation included: 1) Inhibitory control (e.g., Blair, 2003; Diamond, Kirham, & Amso, 2002; Espy & Bull, 2005); 2) Working memory (e.g. Blair, 2003; Hughes, 2005; Senn, Espy, & Kaufman, 2004; Zelazo, Muller, Frye, & Marcovitch, 2003); and 3) Cognitive flexibility and shifting (e.g. Diamond, Carlson, & Beck, 2005; Senn et al., 2004; Smidts, Jacobs, & Anderson, 2004; Zelazo et al., 2003). Inhibition was assessed using the Stroop Color Word Interference test; Cognitive flexibility and Shifting were assessed using the Color Trail Test, Part B; Working memory was assessed using the Digit Span Forward and Backward tests.
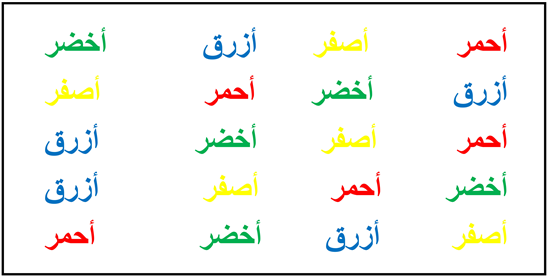
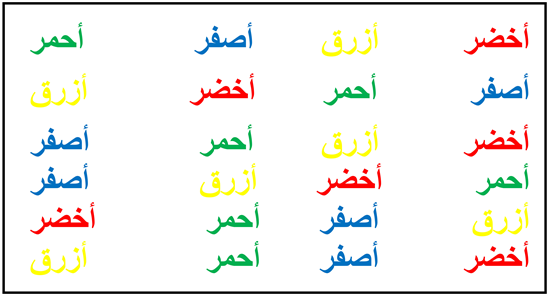
Stroop Color Word Test: This test measures selective attention, cognitive flexibility, cognitive inhibition, and information processing speed (Bryan & Luszcz, 2000; Strauss, Sherman, & Spreen, 2006; Van der Elst, Van Boxtel, Van Breukelen, & Jolles, 2006). The test contains three sub-conditions. The difference in time in the performance between the incongruent word-color condition and the neutral condition (rapid automatic naming of colors) allows for assessment of the interference effect (see Appendix 1).
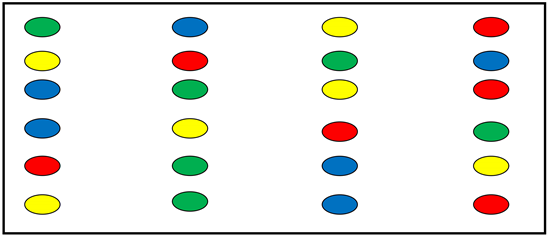
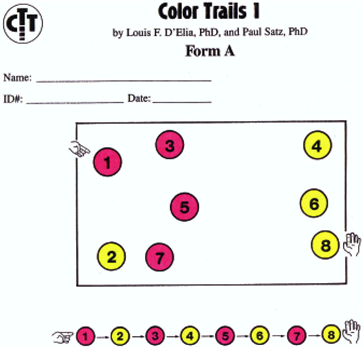
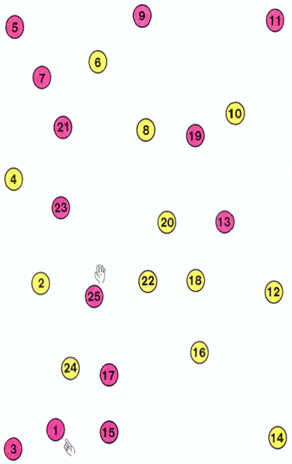
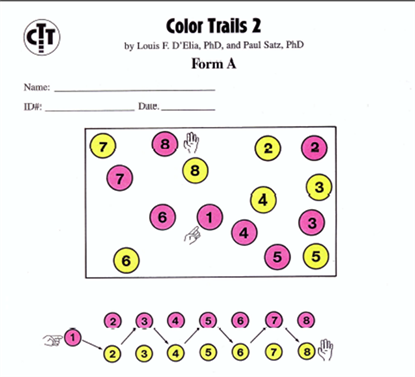
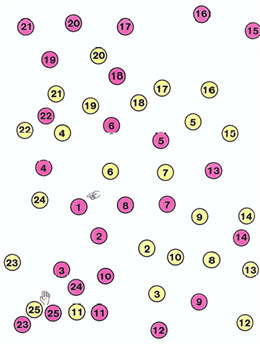
Color Trail Test (CTT, Maj et al., 1993): The Color Trail for children consists of two parts (A and B) which aim at examining visual attention in part A (see below for visual processing), and cognitive flexibility (shifting) in part B. Color Trails A requires the child to connect the numbers from 1 to 25 in correct order, where each number is presented in one color (yellow or red). In Trail B, each number is presented in the two colors (yellow and red), and the participant is required to connect number from 1 to 25 and to alternate between colors at each step. Scoring consists of time in seconds from initiation to completion of the task and the number of errors is recorded (see Appendix 2).
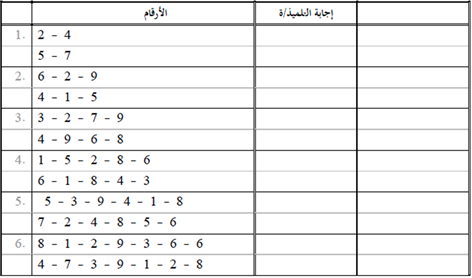
Digit Span Recall Forward and Backward: Digit Recall from Working Memory Battery Test for children (WMBT-C) contains two sub-tests: 1) Forward Digit Recall measures the phonological memory loop and 2) Backward Digit Recall measures the phonological central executive loop, according to Baddeley’s (2000) model of working memory (see Appendix 3).
2.3. Assessment of Visual Processing
In addition to the Color Trail, part A, visual processing was assessed using the Hale-Denckla Cancellation test (HDCT) for visual selective attention and the symbol search test.
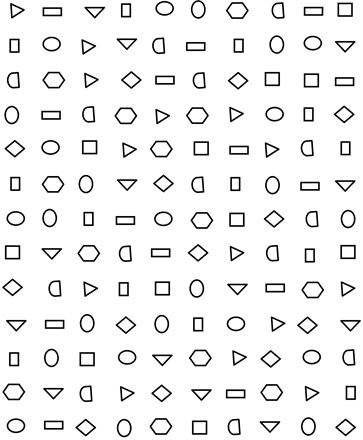
Hale-Denckla Cancellation Test (HDCT): This test uses paper and pencil and measures visual attention discrimination, scanning, tracking, memory and graph motor speed. The HDCT presents a table of random figures to assigned targets and consists of 14 target stimuli (Diamond) from a group of 140, split up into 8 types (see Appendix 4). The time in seconds and the number of errors are measured (Hale et al., 2009).
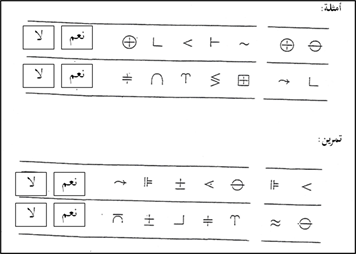
Symbol search (SS): In their research describing this task, Sweet et al. (2004: p. 472) mentioned this test as a measure of visuospatial processing. This task examines the speed and accuracy of visual search of non-linguistic symbols, while ignoring distracters (Wechsler, 1998). This is a self-paced task during which examinees are allotted two minutes to complete as many symbol discrimination items as possible. In each item they are asked to determine if a set of five geometric symbols includes one of two exemplary geometric symbols. The task consists of 45 line-items where, in each one, two symbols appear at the right (target) of the line and the participants have to identify them among other symbols appearing in the line (see Appendix 5).
2.4. Assessment of Word Reading
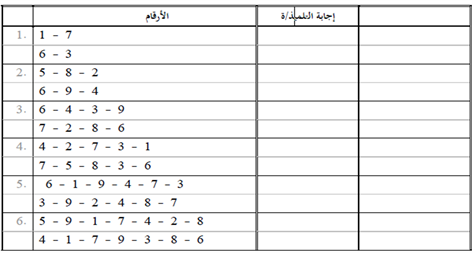
The test used here included a list of 25 vowelized Arabic words that was initially created for third and fourth grades. The list (8 verbs and 17 nouns) included 3 di-syllabic words, 12 tri-syllabic words and 10 quadri-syllabic words. In Asadi et al. (2017: p. 10) the authors explained that this test examined decoding abilities and the fluency of reading. Reading fluency is described as the outcome of two variables: accuracy and the rate of reading; hence fluency in reading was computed here as the number of correctly read words per minute (see Appendix 6).
2.5. Procedure
The tests were conducted in two sessions (25 minutes to each session). The CPM and the other tests were administered individually, in a quiet room in the school. For all children, the instructions were given in spoken Arabic such that they could be understood even by the youngest children. Following the Raven CPM (see Appendix 7), participants were then tested on the EF tasks, the visual processing tests and reading tests.
2.6. Statistical Analysis
The individual data for all participants was subjected to a one-way ANOVA, using grade as an independent between-subjects variable in order to test for grade effects. The children’s scores on the different subtests of the CPM were summed to provide one single score per participant. The scores of the children (time, accuracy, raw performance) on the different tests were further used as dependent variables. Correlations were computed between the subjects’ scores on the different tests and between their scores on the Raven’s CPM and the different tests of executive functions, visual processing and reading. Regression analyses were finally conducted using separate models to assess the prediction of the performance in Raven CPM, by the different sub-domains.
3. Results
Descriptive statistics and correlation analyses: Table 1 presents the means and standard deviations of participants’ scores on the different measures and grades. A one-way ANOVA was conducted on the individual scores for each measure using grade as between-subject factor. The F and P values are presented in the two right columns.
The analysis presented in Table 1 showed that a significant grade effect was observed in almost all measures, except in the HDCT (Diamond test). Also, this effect was only marginally significant for the Stroop Effect (Interference minus neutral) and the Digit Forward test. In particular, for the CPM, significant differences were mainly found between the first grade and the three other grades, the latter not differing in terms of global performance. The same pattern of difference was also observed for reading accuracy, where the first graders differed from the three other grades, with the latter not differing. This lack of difference in reading between the three upper grades is probably due to a ceiling effect that occurs in these grades (with a mean accuracy around 22/25 ± 4, see Table 1). However, in terms of reading fluency, which is computed as the number of correctly read words per minute (i.e. taking into account the total time for reading the word list), differences were found between the first and all other grades, and between the second and the third/fourth grades, with the latter two grades not differing.
Table 2 presents the inter-correlations between the different measures. Of interest for our purpose is the fact that the Stroop Effect showed almost no correlation with other EF measures (Trail B for shifting and Digit Span S for working memory). Also, the visual HDCT (Diamond test) showed no correlation with the other visual processing measures (Trail A and symbol search). In contrast, correlations were found between reading accuracy and fluency and several other measures.
Table 3 shows the correlations between the Raven CPM and all measures. Interestingly, regarding EFs, we observe again that no correlation was found with the Stroop Effect, while Trail B for shifting and Digit Span S for working memory correlated with the CPM. As for visual processing measures, all showed significant but weak correlation with CPM. Finally, the highest correlation (r = .38) was found with reading accuracy.
![]()
Table 1. Summary of the Means (and SD) of all measures by Grade.
Abbreviations: CPM: Colored Progressive Matrices. For the Stroop test N: Neutral, C: Congruent, In: Incongruent and E: Effect Stroop (i.e., = In-N). For the Digit Span F: Forward, B: Backward and S = Sum (=F + B). HDCT: Hale-Denckla Cancellation test (Diamond test). For Read A: Reading Accuracy and F: Fluency (Correct words per minute).
![]()
Table 2. Correlations between the different measures.
Note: P < .05, P < .01, P < .001. Abbreviations: For the Stroop test N: Neutral, C: Congruent; In: Incongruent and E: Effect Stroop (i.e., = In-N). For the Digit span F: Forward, B: Backward and S = Sum (=F + B). HDCT: Hale-Denckla Cancellation test (diamond test). For Read A: Reading Accuracy and F: Fluency (Correct Words per minutes).
![]()
Table 3. Correlations between Raven CPM and the other measures across Grades.
Abbreviations: For the Stroop test N: Neutral, C: Congruent; In: Incongruent and E: Effect Stroop (i.e., =In-N). For the Digit Span F: Forward, B: Backward and S = Sum (=F + B). HDCT: Hale-Denckla Cancellation test (Diamond test). For Read A: Reading Accuracy and F: Fluency (Correct Words per minute).
3.1. Regression Analyses
In order to assess the contribution of the different cognitive domains to the performance in the Raven’s CPM, different regression models were computed separately independent of grade. The first model assessed the contribution of EFs to CPMs. The second model assessed the contribution of visual processing to CPMs. The third model examined the extent to which extent EFs and visual processing (already predicting CPM in the first and second models) could predict performance in CPMs beyond reading accuracy.
3.2. First Model: To What Extent Do EFs Predict the CPM?
The first multiple linear regression analysis was conducted to test how well the executive function measures predicted performance in the Raven’s CPM. The results of this analysis, presented in Table 4, show that EFs explained 18% of the variance of CPM. The regression coefficients showed that Trail B was the highest significant predictor (β = .31). Also Digit S was found to be a significant predictor (β = .20). Stroop E, which we have already shown as having no correlation with CPM, was not found as a significant predictor.
3.3. Second Model: To What Extent Does Visual Processing Predict CPM Results?
Our second hypothesis predicted that visual processes will best predict the CPM test performance. A second multiple linear regression analysis was conducted to evaluate how well the three visual measures collected here predicted CPM. The results presented in Table 5 showed that the model explained 16% of the variance of the performance in CPM. The regression coefficients showed that only Trail A was a significant predictor (β = .32) of the CPMs. The two other measures, symbol search and HDCT, were found to be non-significant predictors.
3.4. Third Model: What Does the CPM Predict beyond Reading?
This third regression model was computed to determine to what extent the predictors from EFs and visual processing that were found significant in the first two models could predict CPM beyond reading accuracy. For this purpose, a step-wise model was computed. The analysis first showed that the model including reading alone explained 15% of the variance of the performance in CPM (β = .40, p < .0001). The model, including Trail A, Trail B and Digit S (see Table 4, Table 5), entered with reading accuracy, added an additional 6% of explained variance to reach a final 21%. This model reported in Table 6, after having excluded Trail A, and Digit S, showed that reading was the highest significant predictor (β = .33), followed by Trail B (β = .26).
![]()
Table 4. Regression results for Executive Functions.
![]()
Table 5. Regression results for Visual Processing.
![]()
Table 6. Step-wise regression testing the contribution of EFs, visual processing and reading accuracy.
4. Discussion
The current study collected EFs, visual perception and reading measures to assess their contribution to the general non-verbal ability as measured by the Raven CPM among first to fourth-grade Arabic-speaking children. Based on previous literature emphasizing a relationship between EFs, visual perception/processing (hereafter VP) and general ability and their relation to academic achievements, particularly in the early stages of literacy development, this study appeared of major importance in view of the fact that this question had not yet been investigated among children of this age. The current study predicted the existence of connections between EFs, VP and CPM performance in Arabic-speaking children from first grade to fourth grade. The research included children who were healthy and without any learning disability or any other difficulty, who underwent a neuropsychological examination that included several cognitive domains. The battery included: a measure of the general nonverbal ability (CPM), inhibition (Stroop color test), shifting (Trail Color test) and visual perception (Symbol search and HDCT tests), working memory (Digit Span Forward and Backward), and reading (real words). The analysis of the scores of the four grades for each of the tests using one-way ANOVA showed a significant grade effect in all measures, but not in the HDCT (Diamond test) and the Digit Forward test, which revealed only a marginally significant difference. These effects attested of the presence of developmental effects. As for the CPM and reading accuracy, significant differences were observed between the first grade and the three other grades. The lack of difference in reading accuracy between the three upper grades was probably explainable in terms of ceiling effect in these grades, where differences appeared more in terms of reading fluency.
Beyond these per grade analyses, more global analyses, which are of more interest for the research questions, assessed the correlations between the different variables and between these variables and performance in the Raven CPM. Generally speaking, positive significant correlations were found between the different sub-tests of the Stroop test, between parts A and B of the Color Trail test, between the Forward and Backward of the Digit Span test but not between the Symbol search and the HDCT (diamond test) measuring VP. Also, no correlation was observed between these latter two tests and the Color Trail test, part A, which is thought to assess visual screening and attention. On the basis of this observation, it seems reasonable to say that these tests don’t tape the same visual processing/attention constructs. Of much more interest was the fact that reading accuracy and even more interestingly, reading fluency, was the measure that showed most significant correlations with almost all the other measures. The fact that reading accuracy and reading fluency could correlate with the Color Trail, part A, and symbol search is in line with previous findings indicating that visual processing skills are highly important for reading in young children (Plaza & Cohen, 2007; Tahan, Cline, & Messaoud-Galusi, 2011). As for the correlations with the CPM, these were significant in almost all measures except in Digit Span Forward and Stroop interference condition, but still were not high. The highest and most significant correlations were found between the CPM and Color Trail, part B, which measures mental flexibility and shifting (r = .35) and with reading accuracy (r = .38). Taken together, these observations lend some support to various models suggesting that reading capacity relies among other things on the child’s ability to deal with visual graphic symbols (Adams, 1990; Ehri & Snowling, 2004; Frith, 1985), and that reading facility rests on visual processing abilities (Stein & Walash, 1997).
4.1. What Predicted Performance in the Raven CPM?
With regard to visual processing abilities, we found that 16% of the variance in the CPM was explained by these abilities as measured by three different tests, but that only the Color Trail, Part A, which showed also the highest correlation with the CPM, could predict significantly the Raven’s scores. As already mentioned, the fact that scores in these tests did not correlate suggest that they don’t tape the same visual construct. In spite of this, this finding indicates that our hypothesis—that visual perception predicts general non-verbal ability—was at least partially confirmed. This result proves also that general abilities that are measured through visual attention problem-solving exercises rely more on high order thinking skills and strategies. The fact that the two other tests could indeed correlate significantly but weakly with the Raven CPM might suggest that this global analysis on four grades together is not the optimal way to approach this question. Further research with a larger sample in each grade would be necessary to further verify these results in the different and separate phases of development.
As for EF abilities, which are often conceptualized as high-level cognitive processes that regulate low level cognitive processes in the performance of complex tasks (Friedman et al., 2008; Miyake et al., 2000), our regression analysis showed that they explained some 18% of the performance in the CPM. In particular, we found that Color Trail B, which is hypothesized to measure shifting, was the strongest, most significant predictor, followed weakly by the sum of the Digit Span (combined measure of the Forward and Backward). Inhibition as measured by the Stroop effect (i.e., Interference minus neutral condition), on the contrary, failed to show any significant contribution. These findings indicate that our prediction that EFs contribute to the Raven CPM was also, at least partially, confirmed. The results found here are in line with the view that EFs can be best understood as a set of multifaceted, separate but related cognitive abilities that are controlled by numerous neurological systems throughout the brain (Collette et al., 2006; Collette & Van der Linden, 2002). Of these, the frontal cortex and more particularly the prefrontal cortex (PFC), play a central role in mediating EF processes. Efforts to localize EF sub-processes to discrete frontal areas have produced equivocal results (Ardila, 2008; Collette et al., 2005; Duncan & Owen, 2000; Stuss & Knight, 2002; Tanji & Hoshi, 2008) and it seems that optimal performance on EFs depends more on the integrity of the whole brain (Collette et al., 2005; Funahashi, 2001; Prabhakaran et al., 2000; Stuss and Alexander, 2000). The positive link between working memory (WM) and the Raven’s test was suggested by Carpenter, Just and Shell (1990) as due to the need not only to retain rules in mind in order to successfully answer Raven’s problems, but also to prevent previously learned rule combinations from interfering when solving problems requiring new rule combinations. The present finding is also in line with Verguts and De Boeck (2002) who suggested that “people with a large working memory capacity can store more partial results, and thus will have a higher probability of solving an item” (p. 38).
In this respect, it is worth noting that while some authors see working memory and general intelligence (g factor) as related constructs (Barbey, Colom, & Grafman, 2013, Friedman et al., 2006, Roca et al., 2009), others either argue that WM and g factor are essentially the same construct (e.g., Martinez et al., 2011) or claim they are separate constructs (e.g., Ackerman, Beier, & Boyle, 2005; Phillipson et al., 2006; Kane, Hambrick, & Conway, 2005). Carpenter et al. (1990) proposed that the link between individual differences in WM and intelligence is due to a difference in the ability to hold a certain number of items in memory, but other authors propose that the reason WM is a good predictor of fluid ability is due to updating. Thus, Carretti and Cornoldi (2010) proposed in their study on CPM that updating seems to be closely related to working memory because it crucially represents the temporary memory component which maintains the information necessary for mind functioning at any given moment. Miyake, Friedman, Emerson, Witzki, Howertwe and Wagner (2000) showed that updating measures were the only predictor of WM performance when considered against measures of inhibition or task switching. In view of this discussion, the correlations between the Digit Span scores and the Color trail, part B, score appear easier to integrate here and to explain why these two measures could significantly contribute to explain performance in the CPM. This interpretation is consistent with Friedman et al. (2006), who maintained the importance of updating to understanding individual differences in fluid intelligence and claimed updating a better predictor of fluid intelligence than inhibition. These findings are also consistent with the claim that WM and updating better explain variations in intelligence (Belacchi, Carretti, & Cornoldi, 2010).
4.2. To What Extent Is Reading Related to General Ability?
From the current study’s results, we found that the pupils in second and third grade had almost the same results in reading fluency when compared to the shifts that occur in first grade; which leads us to infer that reading development starts at first grade and ends in the second grade. As there is little or no change in the upper grades in reading accuracy, one can speculate that teachers do not make efforts in continuing to teach reading skills after the second grade. Instead, they focus only on other reading fluency and comprehension strategies. They take for granted that pupils in second grade are supposed to be independent readers in terms of decoding accuracy but still continue to improve in terms of fluency in reading. We found, however, that pupils with high reading ability skills (accuracy and fluency) have high nonverbal ability, which highlights the connection between reading with high order thinking skills. In the step-wise regression analysis that tested the contribution of EFs, visual processing and reading accuracy to the CPM, this connection was confirmed by the fact that reading accuracy was the strongest significant predictor, followed by the Trail Color, part B, measure. Altogether, the two variables explained 21% of the variance in CPM. These results fit with the claim that reading is a complex cognitive ability that involves many cognitive and linguistic sub-skills, some of which are certainly connected to general ability. These cognitive processes play an important role in everyday functions such as developing strategies for handling different situations, cognitive flexibility, perseverance and the ability to shift from one activity to another (Hirsh-Pasek et al., 2009). Given this relation between reading and general non-verbal abilities, which are clearly subtended at some levels by similar cognitive skills, it appears always very reasonable to control for general non-verbal abilities in each investigation assessing the contribution of the different cognitive variables to reading (Asadi et al., 2017). Also, this finding strengthens the view that assessing reading difficulties in children should continue to be made after having controlled for normal general non-verbal abilities (i.e., the famous IQ criterion).
4.3. Insight from the Comparison between the CPM Performance in the Current Study with Other Populations
In our present study, we found that the results of the CPM percentile performance of the Arabic-speaking children were different from the CPM percentile norms of the Australian children at the same age. For instance, an Arabic-speaking child at the age of 7.8 - 8 years who responded correctly to 15 out of 36 items gets the percentile score of this age of 5%, and this represents the percentile scores of seven-year old Australian children. Surprisingly, our results showed that the highest score from all the 120 Arabic-speaking children came from one participant—a nine-year-old boy who answered 32/36 items correctly. This child’s 75% percentile score is like the 85% percentile score of eight-year old Australians, which means that (if this sampe is representative) there would be a gap between the norms of Arabic-speaking children and the equivalent Australian population. These statistics reflect the difference of culture, traditions, daily habits, activities and the education curriculum (especially the linguistic) vis-a-vis reading and cognitive domains. These findings contradict the suggested claim that RPM norms are similar across cultures with a tradition of literacy, at any given point in time (Raven, 2000b). Actually, comparative studies in Arabic-speaking countries (Abdel-Khalek & Raven, 2006), and in some African countries (Adot, 2014) suggest that norms might differ between cultures. These observations emphasize the need to investigate these tests in different cultures, to assess their universal and culture-sensitive predictors, and ideally, to construct culture-sensitive testing norms.
5. Conclusion and Limitation of the Current Study
The current study provided new insights relating to the influence of EFs and visual attention/processing skills on the Raven CPM test. These findings are of particular importance for the use of these tests in different places and cultures. We noticed that not only non-verbal general ability can explain reading but also reading can explain performance in non-verbal abilities. In this regard, one can really ask the question of whether or not the school system should include tasks that require high-order thinking skills and strategies and making connections between variables (as in the CPM problems) as part of the pre-reading process at early ages. Should schools use specific mapping tests in order to classify students according to their reading skills or their nonverbal ability?
The study presented here has several limitations, one of which is the size of the sample—(N = 120) 30 children from each grade is still a small number; a larger sample would definitely serve the reliability of the results. A by-grade analysis on the contribution of the different factors explaining the CPM would have been a better choice to gain a good picture on how these factors affect general non-verbal abilities during the early phases of school. Finally, the neuropsychological examination would have been more complete if another test that assesses attention was included and if socio-demographic and executive questionnaires were included in the study. Further research with more participants and with more comprehensive linguistic domains will be necessary to better assess variables that predict cognitive non-verbal functioning of young school-aged children.
Appendices
Appendix 1A
Stroop task مهمة ستروب-
اسم الطالب : ___________ جيل الطالب : ___________
المرحلة الأولى :Neutral condition الزمن بالثواني : _________ الاخطاء :________
تعليمات للطالب : اذكر لون الدوائر فيما يلي بأقصى سرعة ممكنة.
تعليمات للفاحص : سجل الوقت وسجل أخطاء الطالب.
Appendix 1B
المرحلة الثانية : Congruent condition الزمن بالثواني : _________
تعليمات للطالب : اذكر لون الكلمات فيما يلي بأقصى سرعة ممكنة.
تعليمات للفاحص : سجل الوقت وسجل أخطاء الطالب
Appendix 1C
المرحلة الرابعة : Incongruent condition الزمن بالثواني : _________ الأخطاء : _______
تعليمات للطالب: اذكر لون الكلمات دون أن تقرأ الكلمة بأقصى سرعة ممكنة.
تعليمات للفاحص: سجل الوقت وسجل أخطاء الطالب
Appendix 2A
مهمة : Color Trial 1
اسم الطالب : ________ جيل الطالب : ______ الزمن بالثواني : ______
تعليمات للطالب : عليك أن توصل بالاصبع بين الدوائر من من 1-25 بحيث يكون لون الدائرة مختلفا في كل مرة أي مرة 1 زهري 2 أصفر.
يقوم الطالب بالتدرب أولا : من 1-8 ( بحيث المثال يحوي على 8 دوائر فقط ، 4 دوائر من كل لون )
تعليمات للفاحص : تشرح للطالب كما في المثال ، وخلال الفحص تراقب أداء الطالب ، تسجل الأخطاء بالتحديد وتسجل الزمن بالثواني.
مهمة : Color Trial 1
اسم الطالب : _____ جيل الطالب : ______ الزمن بالثواني : ______ الأخطاء : ______
تعليمات للطالب : عليك أن توصل بالاصبع بين الدوائر من من 1-25 بحيث تكون لون الدائرة مختلفا في كل مرة أي مرة 1 زهري 2 أصفر.
يقوم الطالب بالتدرب أولا : من 1-8 ( بحيث المثال يحوي على 8 دوائر فقط ، 4 دوائر من كل لون )
تعليمات للفاحص : تشرح للطالب كما في المثال ، وخلال الفحص تراقب أداء الطالب ، تسجل الأخطاء بالتحديد وتسجل الزمن بالثواني.
Appendix 2B
مهمة : 2 Color Trial
اسم الطالب : ________ الجيل : ______ الزمن بالثواني : ______
تعليمات للطالب : عليك أن توصل بين الدوائر من من 1-25 بحيث يكون لون الدائرة مختلفا في كل مرة أي مرة 1 زهري 2 أصفر.
يقوم الطالب بالتدرب أولا : من 1-8 ( بحيث المثال يحوي على 8 دوائر فقط ، 4 دوائر من كل لون )
تعليمات للفاحص : تشرح للطالب كما في المثال ، وخلال الفحص تراقب أداء الطالب ، تسجل الأخطاء بالتحديد وتسجل الزمن بالثواني.
مهمة : Color Trial 2
اسم الطالب : ________ الجيل : ______ الزمن بالثواني : ______ الأخطاء : ____
تعليمات للطالب : عليك أن توصل بين الدوائر من من 1-25 بحيث تكون لون الدائرة مختلفا في كل مرة أي مرة 1 زهري 2 أصفر.
يقوم الطالب بالتدرب أولا : من 1-8 ( بحيث المثال يحوي على 8 دوائر فقط ، 4 دوائر من كل لون )
تعليمات للفاحص : تشرح للطالب كما في المثال ، وخلال الفحص تراقب أداء الطالب ، تسجل الأخطاء بالتحديد وتسجل الزمن بالثواني.
Appendix 3A
مهمة Digit span forward -
اسم الطالب : ___________ جيل الطالب : ___________
ذاكرة فعّالة ( تصاعدية )
تعليمات الفحص : للتلميذ : سأذكر لك أرقاما ، وعليك أن تعيد الأرقام بنفس الترتيب.
للفاحص : اسمع التلميذ الأرقام ، بفارق زمني بسيط بين الواحد والآخر ( ثانية ) ، واطلب منه أن يعيد الأرقام بنفس الترتيب.
إذا لم ينجح التلميذ في تذكر الأرقام ، في المثالين التابعين لمرحلة ما ، عليك إيقاف المهمة.
مثالان للتدرب : 2-5 9 -1
مهمة Digit span forward -
Appendix 3B
مهمة Digit span backward -
ذاكرة فعّالة (إلى الخلف ) :
تعليمات الفحص : للتلميذ : سأذكر لك أرقاما ، وعليك أن تعيد الأرقام بترتيب معكوس ( من الآخر إلى الأول ).
للفاحص : اسمع التلميذ الأرقام ، بفارق زمني بسيط بين الواحد والآخر ( ثانية ) ، واطلب منه أن يعيد الأرقام بترتيب معكوس.
إذا لم ينجح التلميذ في تذكر الأرقام ، في المثالين التابعين لمرحلة ما ، عليك إيقاف المهمة.
مثالان للتدرب : 2-5 9 -1
Appendix 4
تعليمات للطالب : عليك أن تحيط الأشكال المطابقة للشكل داخل دائرة بأسرع ما يمكن.الأخطاء:
Appendix 5
مهمة البحث عن رموز-symbol search
اسم الطالب : _______ جيل الطالب:________ الأخطاء:_______
تعليمات الفحص: مدة الفحص دقيقتين.
للتلميذ/ة: أنظر/ي جيدًا إلى الرمزين اللذين بالجهة اليمنى. إذا وُجد على الأقل رمزًا واحدًا منهما بالسطر أشطب/ي كلمة “نعم”، وإذا لم تَجد/ي أي رمز منهما أشطب/ي كلمة “لا”. إذا أخطأت لا تمحو/تمحي بل ضع/ي إشارة (×) على الكلمة.
للفاحص : عليك أن تشرح للطالب كما في المثال وتحديد المهمة لمدة دقيقتين فقط.
Appendix 6
Reading 25 words مهمة قراءة كلمات -
تعليمات الفحص :
للتلميذ/ة : إقرأ/ي الكلمات التالية بشكل صحيح ( مع الحركات ) بالسرعة المناسبة لك.
للمتحن /ة :أثناء قراءة التلميذ/ة.إذا كانت القراءة دقيقة فاكتب /ي صح في خانة الإجابة وإذا كانت القراءة غير صحيحة فاكتب /ي الكلمة كما قرأها /قرأتها التلميذ/ ة مع التشكيل
اذكر للتلميذ/ة وشغل الساعة.
الزمن بالثواني : عدد الكلمات الصحيحة
Appendix 7
مصفوفات ريفين الملونة CPM
تفحص هذه المهمة قدرة التلميذ/ة على تكملة شكل مركب بدون استعمال اللغة.
تعليمات الفحص : أمامك بساط من أشكال. بكل بساط ناقص قطعة. عليك أن تجد /ي القطعة الناقصة من بين القطع الموجودة في الأسفل. أشر /أشيري إليها بإصبعك.
Set A:
![]()
Set AB:
![]()
Set B:
![]()
ورقة إجابات للفاحص: مصفوفات ريفين الملونة CPM
اسم الطالب :__________ جيل الطالب : ________ الزمن بالثواني : _____
تعليمات للتلميذ : أمامك بساط من أشكال. بكل بساط ناقص قطعة. عليك أن تجد / ي القطعة الناقصة من بين القطع الموجودة في الأسفل. أشر / أشيري إليها بإصبعك.
تعليمات للفاحص : عليك أن تسجل رقم الإجابة على ورقة خارجية مع قياس الزمن بالثواني ، في كل قسم 12 سؤال بحيث أن الفحص مكوّن من 36 سؤال.
A الزمن: ___ B الزمن: ___ C الزمن : ______
مجموع الإجابات الصحيحة: مجموع الإجابات الصحيحة: مجموع الإجابات الصحيحة:
مجموع الإجابات الخاطئة: مجموع الإجابات الخاطئة: مجموع الإجابات الخاطئة: