De-Speckling of SAR Images with Fuzzy Filters along with Altered Preserved Edge Values ()
1. Introduction
Microwave remote sensing techniques for capturing synthetic aperture radar images can be spoiled by speckle noise and cause great information loss. Synthetic Aperture Radar (SAR), a sensor-controlled by microwave which is used for capturing Earth’s surface [1]. The remote sensor sends out electromagnetic waves to the surface of the target and receives back the reflected pulses from the targeted surface; these pulses construct the image of that target surface after determination of the type of reflector and the distance from the transmitting sensor [2] [3]. SAR has two main advantages as its strongest imaging capability in an all-weather condition such as rainy, cloudy, hazy, etc., and both day and night. SAR images are constructed from moving platforms like aircraft or space-crafts like a satellite which can capture high-resolution images of the broad areas of Earth’s surface.
The surfaces of the earth are enormously rough on the scale of the wavelength. As a result, images obtained from these surfaces by coherent imaging systems like SAR, suffer from a standard interference development named speckle [4] [5] [6].
Edge detection algorithms include diverse mathematical ways which aim at distinctive points in a digital image where the image brightness alters acutely or, extra formally, has discontinuities. The points at that image brightness changes sharply are usually formed into a group of arched line sections termed edges [7]. Edge detection could be a fashionable downside within the field of the image process and has broad applications in the field like Computing, Computer Vision, Robotics and so on. Not having deterministic algorithms is one of the tasks which can be applied to all forms of images. It involves selective adoption of certain methods that prove to be especially effective. With the rise of appliance diversity edge detection earns a lot of momentum. Land crop originating pictures, satellite pictures and medical pictures are samples of such applications wherever edge detection provides a good thanks to communicate the knowledge required in these pictures [8].
The speckle noise of the SAR image complicates the image analysis and interpretation. It also degrades the high radiant resolution and Pixel-to-Noise Ratio (PSNR) of the image. Various methods of fuzzy de-speckling algorithms are proposed from the past decades [9] [10]. Speckle is declared as a granular interference that inherently exists in and degrades the standard of the active radio detection and ranging, artificial aperture radio detection, and ranging of SAR image [11]. Then a complete approach on fuzzy method consisting of 6 different algorithms is proposed [2] and then 9 different algorithms by the same publisher [12] and 4 of them can successfully suppress a minimum amount of speckle noise. But the approach of de-speckling is still going on focused on mean-median filtering and SRAD method [13] [14], Local adaptive median filter [15], median filter, and Savitsky-Golay filter [16], etc. The researchers also proposed a lot of algorithms focused on fuzzy operators in SAR like the Neuro-fuzzy approach [17], two-staged fuzzy filter [18], and so on [10] [19] [20] [21].
Determination of the success of a noise filter preserving edges and suppressing noise from a speckled noisy image are the most significant consideration. The contribution of this work is to bring down speckle noises and at the same time preserve the edges. By three steps the proposed technique has been developed. Firstly, the edge pixels are preserved and detected using fuzzy edge detection algorithms from the noisy image and in the second, that noisy image is filtered using fuzzy filtering algorithms, where the noisy pixel is replaced with the fuzzy weighted mean of the neighboring pixels. The neighborhood is determined by using a 3 × 3 moving window. And finally, in the third step, the preserved edge pixels are restored and filtered pixels remain unchanged. Original RGB based Synthetic Aperture Radar image for different areas has been shown in the research [21] [22] [23] [24].
In this paper, the proposed filter is a combination of fuzzy filtration and fuzzy edge detection algorithms. The proposed filters will be equated and computed the amelioration between fuzzy filters and proposed fuzzy filters. Speckle noise decrease and texture conservation are various standards for the rating of filtering functioning. The combination of two dissimilar fuzzy approaches for filtration of SAR data is the main target of the work which has been presented. The details of the edge detection phases are given in Section II, the proposed methodology is discussed in Section III. The performance metric is shown in subsection Section 3.2. Finally, result in analysis and discussion has been presented in Sections IV, and conclusions are presented in Sections V.
2. Methods and Techniques
In this paper, the suggested filter is a combination of fuzzy filtration and fuzzy edge detection algorithms. The proposed filters will be equated and computed the advance between fuzzy filters and proposed fuzzy filters. Several criteria such as Speckle noise diminution and texture conservation are evaluation of filtering performance. And the main objective of the work presented is to combine two different fuzzy approaches for the filtration of SAR data.
2.1. Fuzzy Filtration & Approach
It is detected that the speckle noise-affected pixels are significantly dissimilar from the neighboring pixels. To detect noises this observation is used. The neighborhood of a pixel is defined by using a 3 × 3 window as visualized in Figure 1 [13]. Sliding of the window occurs over all pixels in the image.
![]()
Figure 1. Region of the central pixel x(i, j) of 3 × 3 windows.
The deviation between central pixel
and its eight neighbors is denoted by me, where
and the average of the difference is defined as in Equation (1) [13]
There are three rules to detect the presence of speckle noise in the image.
1) If the Δavg is larger then, speckle noise is present in
.
2) If Δa is larger then, speckle noise is present in
.
Where the average of two pixels that are most similar to the central pixel is used. Let
, where Δs1 and Δs2 denotes the two smallest value in i.
3) If Δa is large and Δavg is larger then, speckle noise is present in
.
Rule a and Rule b are aggregated and conveyed as a two-dimensional function of avg and a in Rule c.
2.2. Fuzzy Edge Detection
A mutual attribute has been shared by all the pixels of an image. An abrupt change in the color intensity throughout them has been shown by them. This property is exploited to indicate potential edges in an image. This technique collectively examines all the pixels within the image, however takes into consideration the effect of all the bordering pixels. A parameter named the degree of edginess has been defined in this method, for each pixel. We define the membership grade for each pixel and contemplate the whole image matrix as a fuzzy set in the image. The membership function is denoted by Equation (1):
(1)
where,
: the pixel under consideration;
: the bordering pixels;
Δ : normalizing value.
After calculating the membership grade for all the pixels, we tend to once more outline the brink price. In this case, however, the threshold value lies in the range [7] [8].
2.3. Fuzzy Filtering Methods
A 2D (two dimensional) fuzzy filter let assume
be the input , the output of the fuzzy filter is defined as:
(2)
is that the general window performs and A is that the space of the window. For a square window of dimensions N*N, the range of r and s are
and
, where,
.
In this study four fuzzy filters were applied, namely; Asymmetric Triangular Median Center (ATMED), Triangular Median Center (TMED), Asymmetric Triangular Moving Average (ATMAV), and Triangular Moving Average (TMAV) [1] [2] [6] [13].
1) ATMED (Asymmetric Triangular Median Center): In ATMED the triangular window function is asymmetrical and the degree of asymmetry depends on
and
. The central value within the 3 × 3 window is defined as
(3)
2) ATMAV (Asymmetric Triangular Moving Average): In ATMAV the degree of asymmetry depends on
and
[12]. The central value within the window is defined as:
(4)
3) TMED (Triangular Median Center): The symmetrical triangular fuzzy filter with the median value within a window chosen as the center value is defined as:
(5)
where
,
and
are, consecutively, the maximum value, the minimum value, and the median value of all the input values
for
within 3 × 3 window A at discrete indexes
[12].
4) TMAV (Triangular Moving Average): The triangular fuzzy filter with the moving average value within a window chosen as its center value is determined as:
(6)
where
.
The primary SAR images for measuring the performances of fuzzy algorithms which are used for military surveillance, marine monitoring, research on forest mapping, fire prevention, coastal area monitoring, flood monitoring, oil spilling observation, etc. All of these images were collected from an intelligence-airbus website [20] [21] [22] [23] [24].
3. Proposed Methodology
In our research, the Fuzzy filter [1] [10] [13], was modified by the combination with the fuzzy approach. According to [25], to alleviate speckle noise in a SAR image fuzzy has a good performance. Research on hybrid fuzzy filters [26], aggregated consecutively wiener filter with a fuzzy filter, has been implemented to speckle reduction. Also, an approach by combining the fuzzy filters with the frost filter [1] has been proposed in this research. To reduce the speckle noise using a fuzzy approach by altering the fuzzy filtered image pixels with Preserved Edge pixels is the purpose of the proposed method. Proposed Filter’s approach is to replace the edge pixel of fuzzy filtered images with the value of edge pixels which is calculated by the fuzzy edge detection method [4] from the speckled image. This method assumes the fuzzy filter’s edge value may be affected by the mean value of the local neighbor, whereas fuzzy computes a mean value based on the fuzzy degree of membership local neighborhood as depicted clearly in the former study [10]. So, the idea is created for preserving edge values from affecting the mean value of local neighbor. The proposed method could store the edge values from the noisy image. Then the noisy image would be filtered by fuzzy filtration. And finally, the filtered image values would be replaced with the preserved edge values.
The algorithm of the proposed method is shown below.
3.1. Algorithm of the Proposed Method
1) Assertion:

2) Algorithm:
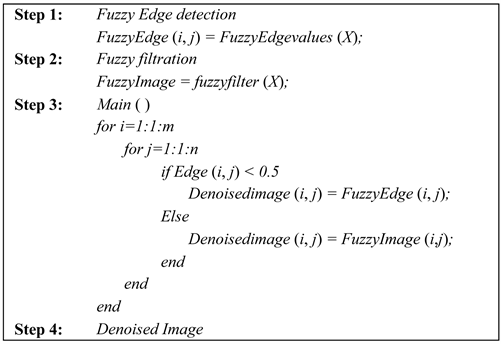
3) Flowchart:
To substitute the edge pixel of fuzzy filtered images with the value of edge pixels which is suggested filter’s approach calculated by the fuzzy edge detection method by [27] from the speckled image. This method assumes the fuzzy filter’s edge value may be affected by the mean value of the local neighbor, whereas A mean value based on the fuzzy degree of membership local neighborhood calculated by fuzzy as describe clearly in the previous study [28]. Figure 1 represents the overall method of the proposed system.
Figure 2 shows the flowchart of the proposed method which has been done in this research.
3.2. Performance Evaluation
The parameters for performance characteristics which is to evaluate the numerical performance of speckle reduction algorithm for SAR images, some of those commonly preferred parameters are given below [1] [10] [13].
1) Mean Square Error (MSE): To compare the original and de-speckled images MSE is applied. It is determined by the deviation between the mean square values of the original image to filtered image.
(7)
Here M, N is several rows and columns, reference image MSE value will be zero. MSE value will smaller and larger depends on the difference between the original image and filtered image [10] [19]
2) Mean Absolute Error (MAE): This criterion evaluates the mean absolute error between the original image Y and the de-noised image Y'. Denoted by MAE, it is expressed in Equation (8) [14]:
![]()
Figure 2. The flow chart of the proposed method.
(8)
MAE has a clear interpretation as the average absolute difference between
and
. The lower value of MAE indicates the best value for a denoised image.
3) Peak Signal to Noise Ratio (PSNR): To evaluate the performance of the speckle PSNR is used. This is the ratio between the logarithmic maximum variations in the input signal to mean square error. PSNR is usually expressed in terms of the logarithmic decibel scale [10] [13].
(9)
The higher value of PSNR indicates the best value for a de-noised image.
4) Structural Similarity Index Metric (SSIM): The SSIM index is calculated on various windows of an image. The measure between two windows x and y of common size N × N is:
(10)
where,
= the average of x;
= the average of y;
= the variance of x;
= the variance of y;
= the covariance of x and y;
two variables to stabilize the division with weak denominator; L the dynamic range of the pixel-values (typically this is
);
and
by default [29].
Formula components:
The SSIM formula is based on three comparison measurements between the samples of x and y: luminance (l), contrast (c), and structure (s). The individual comparison functions are:
In addition to the above definitions:
SSIM is then a weighted combination of those comparative measures:
(11)
Setting the weights α, β, γ to 1, the formula can be reduced to the form shown at the top of this section. The higher value of SSIM is the best value for the output image [29].
4. Result Analysis and Discussion
In this section, a comparative study is entered using fuzzy filters and fuzzy edge detection. To find out the performance and how much was the performance improvement of the proposed filters against fuzzy filters was the Primary goal of the comparison.
SAR image is a 2-D projection of a 3-D natural surface [16]. However, some of the information is lost throughout the mapping which made a noise like a speckle noise. For measuring the performance of filtration methods, we have used five clean reference 2-D SAR images [20] [21] [22] [23] [24]. These 512 × 512 SAR images, with the different selected area, that comprises of coastal, hilly, farm, urban and Agriculture. Most of the area on the Earth’s surface has been represented by these five different areas.
4.1. Original Image
The original figures have been shown Figure 3.
4.2. Comparison between Fuzzy Filtered and Proposed Filtered Image
We had selected five different images from five different Earth’s surface [18] for the comparison analysis. We use four fuzzy filters (ATMED, ATMAV, TMED, TMAV) to compare with four combined fuzzy algorithms with altered preserved edge pixels (ATMEDwAPE, ATMAVwAPE, TMEDwAPE, TMAVwAPE). The filtered images are shown for visual comparison into four different sections below. Figure 3 shows the original RGB image of idfferent area. 2% spackled image for original GRAY image has been shown in Figure 4. Figure 5 depicts the Fuzzy edge detection value for spackled image. Figure 6 illustrates respectively ATMED, ATMAV, TMED, TMAV, ATMEDwAPE, ATMAVwAPE, TMEDwAPE and TMAVwAPE filtered images.
Speckled Images
![]() (a)
(a) ![]() (b)
(b) ![]() (c)
(c) ![]() (d)
(d) ![]() (e)
(e) ![]() (f)
(f) ![]() (g)
(g) ![]() (h)
(h)
Figure 6. (a), (b), (c), (d), (e), (f), (g) and (h) are respectively ATMED, ATMAV, TMED, TMAV, ATMEDwAPE, ATMAVwAPE, TMEDwAPE and TMAVwAPE filtered images.
4.3. Fuzzy Edge Detected Image
A performance evaluation is performed by taking two prospects of the ability of the filter to reduce speckle noise as well as to maintain the texture image. Comparison of the functioning of filter to reduce speckle noise has been constituted by PSNR and MSE parameters. As for the comparison of the performance of the filter to preserve the texture, SSIM and MAE parameters are used.
Performance for each image and each method have been measured separately. After calculating the performances, we made an average for four different performance measurement characteristics and made a comparison table below.
From the experiment data, it was shown in Table 1 that the proposed fuzzy filters with altered preserved Edge can improve the performance of the fuzzy filter. TMAV with altered preserved edge method has a good ability to reduce speckle noise.
![]()
Table 1. Average performances fuzzy filtering methods and fuzzy filters with altered preserved edges methods.
*Bold indicates the best value/performance.
While MSE is the lowest it was suggested by the highest value of PSNR. For texture parameter, a combination of ATMED + altered preserved edge method showed 81% SSIM value which is much better than other filters shown in Table 1. But, after analyzing the performances on different pictures, we can consider that the proposed filtering methods are much effective where the number of detected edge pixels is high. However, after comparing the average performances TMAV with altered preserved edge values combination has the best performance i.e. lowest MAE (1.47) and highest PSNR (41.61) values. All the comparisons as been shown by graphical representation in Figures 7-10. After achieving the improving result of the proposed method by using 2% of speckle noise, we’ve compared the result with various percentages of speckle noise. Eight different percentages of speckle-noise have been used for the performance comparison. The comparison goes through with 2%, 10%, 20%, 30%, 40%, 50%, 60% and 70% of speckled image for every filtration method. These different levels of impulse (salt and pepper) noise are introduced to the subject images using Matlab.
From the analysis, it is observed that fuzzy filtering methods with altering preserved edges have shown better performance from the fuzzy filtering methods. By increasing the percentage of noises in different images the fuzzy filtering methods with altering preserved edges have shown straight performances, where the fuzzy filtering methods have shown lots of fluctuation for the performances on increasing speckle noise on images. TMAVwAPE filtering method for suppressing Mean Square Error (MSE) is 4.54 which is a higher performance indicator from the speckled image on each range of speckle noise. ATMEDwAPE filtering method declares the best average performance for reducing Mean Absolute Error (MAE), though the other fuzzy filtering methods with altering preserved edge have also shown better performance.
According to the experimental results, it is clear that the fuzzy approach with altered preserved edge values has a splendid resistance while applied to SAR
![]()
Figure 7. Plot of a simulation result of MSE performances.
![]()
Figure 8. Plot of a simulation result of MAE performances.
![]()
Figure 9. Plot of a simulation result of PSNR performances.
images. Speckle Suppression Index (SSI): one of the most ordinarily used parameters for measuring speckle suppression is the coefficient of variance or the ratio of standard deviation to the mean [30]. Which is defined as:
where X is the original image and Xf is the filtered image. The smaller the SSI value the greater the speckle suppression. SSI value must be less than 1. Our proposed filter shows an SSI value less than 1 for up to the 6th iteration where the window size was fixed 3 × 3 . Lower the values the better the performance [31].
Table 2 shows the comparison of the proposed methods with the conventional methods. All the comparison takes place for window size 3 × 3. Value of the SSI (Spackle suppression index) for proposed methods is better than the conventional models. Figure 11 also illustrates the plot of SSI index with respect to iterations. The SSI index curve is flat with the iterations and for iteration 5 and 6 SSI index increases slightly.
![]()
Figure 10. Plot of a simulation result of SSIM performances.
![]()
Figure 11. Plot of simulation result of SSI performances.
![]()
Table 2. Comparison of the proposed methods with the conventional method.
Our proposed filter can be used for medical imaging speckle noise reduction. Different algorithms and techniques have been used in recent years in the field of medical imaging to reduce speckle noise from the image [32] [33]. The organ’s image of body part contains edges where our proposed filter can be potentially effective to remove the noise by edge preservation techniques.
5. Conclusion
A novel fuzzy-based speckle-noise filter has been depicted in this paper. It is carried out in three stages. In the initial stage, the edge pixels from the noisy image are detected and stored by using a fuzzy edge detecting algorithm, in the second stage the noisy images are filtered by using fuzzy algorithms, in the third phase the preserved edge pixels are altered with the filtered image. The performance parameters associated with the density of noise mean speckle noised image, original or ideal image, and filtered image. Some of the existing filters based on MSE, MAE, PSNR, and SSIM have been equated with the suggested filter. It can be discovered from the outcome that the proposed fuzzy filter is adequate to suppressing speckle noise and at the same time preserving edges. For extremely corrupted images the proposed filter can be used recursively to ameliorate the tone of the filtered image. Speckle Suppression Index (SSI) has been calculated which shows better performance of preservation properties with an average value 0.689. Proposed method will be used for de-noising of Synthetic Aperture Radar image from spackle noise. Better SAR image can be used for topography, oceanography, glaciology, terrain discrimination and subsurface imaging.