Effects of Trade Openness on Economic Growth in the Republic of Congo ()
1. Introduction
The issue of economic growth has been a concern in developing and developed countries for several centuries. Several works ( Solow, 1956 ; Swan, 1956 ; Romer, 1990 ), based on growth models, have used the production factors of capital, labor and technology to improve economic growth. Since the economic advances made by the emerging countries and the East Asian countries in the 1985s, following the adoption and implementation of trade openness policies as a factor favorable to economic growth ( Cohen, 1997 ), these formerly poor countries have attracted the attention of all and have distinguished themselves from the mass of underdeveloped nations by their economic and social performance. At the economic level, the development of the BRICS (Brazil-Russia-India-China-South Africa) is irrevocable and the speed, at which they are progressing, is spectacular ( Ekodo & Ngomsi, 2017 ).
These countries, between the years 2000 and 2010, have experienced growth rates, significantly higher than those of developed countries. Brazil (3.7%), India (8%), China (10.8%) and South Africa (3.9%) against 1.6% for developed countries ( UNCTAD, 2012 ). The BRICS now occupy a very important place in the world economy. They represent 26% of the world GDP in $ Purchasing Power Parity (PPP) in 2012 against 10% in 1990 ( IMF, 2013 ).
Africa has not remained on the sidelines of the trade liberalization movement. And most African countries, at the end of the 1980s, adopted Structural Adjustment Programs (SAPs), consisting of rapid liberalization and privatization of economic activity in search of solutions to boost their economic performance and achieve the dream growth. In the face of this adoption, Africa’s trade, as a percentage of GDP, rose from 38% to 43% between 1988 and 2000 ( UNCTAD, 2001 ). As a result, for the past 15 years, Africa has shown impressive economic performance, with an average increase in real gross domestic product (GDP) of more than 5% between 2001 and 2013, compared to a performance of barely more than 2% in the 1980s and 1990s ( African Economic Outlook, 2016 ).
Similarly, the member countries of the Central Africa Economic and Monetary Community (CAEMC) had opted for a trade liberalization strategy. Most of the countries in the subregion acceded to the Structural Adjustment Program (SAP) in the late 1980s, reinforced by their membership into the World Trade Organization (WTO), and developed multilateral, regional, and bilateral free trade partnerships ( Madariaga, 2010 ). Statistics from the Bank of Central African States show that the degree of trade openness in CAEMC has increased significantly as a result of partnership agreements between countries. In this respect, it rose from 86.10% in 2005 to 94.91% in 2015 ( World Bank, 2015 ). This upward trend could continue in the coming years, with the signing and entry into force of Economic Partnership Agreements (EPAs) for most countries in the subregion.
The contribution of foreign trade to economic growth has been the subject of several works divided into two axes. The first axis focuses on the modern theory of trade policy and economic growth, and the second axis focuses on original theoretical models.
In Axis 1, the modern theory of trade policy and economic growth can be summarized in three propositions ( Rodriguez & Rodrik, 2000 ).
First, in the static model with market perfections, the effect of trade barriers is to reduce the level of real GDP at world prices. In the presence of externalities, trade restrictions can therefore increase real GDP.
Second, in standard neoclassical models of growth with exogenous technological change and diminishing returns to factors of production, trade restrictions affect the short-term growth rate but not the long-term growth rate of output. Moreover, trade restrictions may affect growth during the transition to the steady state (i.e. transitional effects).
Finally, in endogenous growth models with non-decreasing returns to factors of production or endogenous technological change (e.g., learning or practice), weaker trade restrictions will stimulate output growth in the world economy. These models imply that there should be no theoretical reason why openness to trade should harm economic growth.
In Axis 2, dealing with the original theoretical models, international trade indirectly influences growth. In neoclassical studies, the growth models of Solow (1956) , Cass (1965) and Koopmans (1965) are used as the main framework to examine the determinants of the growth process over the last half century. The framework of these studies describes a closed economy with exogenous technological progress. Some works ( Ben-David & Loewy, 2000 ; Ben-David & Loewy, 2003 ) have developed the traditional neoclassical exogenous growth model while considering trade openness.
These models state that trade openness can affect the endogenously determined stable growth rate through knowledge transfer from abroad. The modern literature on endogenous growth suggests several channels through which trade openness can be associated with long-term growth. 1) Trade liberalization improves technical progress. According to Grossman and Helpman (1990) , all trade interactions are equally valuable in generating additions to the stock of knowledge capital and, hence, promoting economic growth ( Baldwin, 1989 ). 2) Trade liberalization has a positive impact on savings and capital accumulation, thus promoting growth ( François & McDonald, 1996 ). 3) Trade creates positive externalities, thus suspending the hypothesis of diminishing returns to capital and thus increasing economic growth. We refer to the positive externalities of physical investment and knowledge ( Romer, 1990 ).
Other studies suggest that openness affects long-term growth by influencing the extent of knowledge diffusion from abroad ( Ben-David & Loewy, 1996; 1998; 2000; 2003 ). The main difference between neoclassical and endogenous growth studies in the relationship between trade and growth is that they respectively validate a causal relationship between trade and growth only in the short term, and a long-term causal relationship between trade and economic growth. Even in these theoretical models, international trade affects growth indirectly.
Several empirical studies have also shown a positive and statistically significant relationship of openness on growth using measures of trade restrictions ( Edwards, 1992 ; Harrison, 1996 ; Lee et al., 2004 ; Manole & Spatareanu, 2010 ), and trade volume ( Frankel & Romer, 1999 ; Alcala & Ciccone, 2004 ; Dollar & Kraay, 2003 ; Dowick & Golley, 2004 ).
The situation of CAEMC countries, and particularly the Congo, in terms of growth suggests that we can question the relevance of the relationship between foreign trade and economic growth. The opening up of the Congo economy has led to significant progress in strengthening trade, which represents 137% of its GDP ( WTO, 2016 ). With growth rates of 7.57%; 7.75%; 8.75 and 6.77%, respectively, in 2000, 2005, 2010 and 2014 ( WDI, 2018 ). During the same years, the degree of trade openness is, respectively, 130.73%; 149.78%; 145.12% and 165.64% ( WDI, 2018 ).
The level of growth in this relationship raises a key question: what are the effects of trade openness on economic growth in the Congo? The answer to this question highlights the effects of the trade openness indicator on economic growth in Congo. Due to the low percentage of trade indicators, it is argued in this work that the degree of trade openness is a factor of economic growth.
The remainder of this paper, in addition to the conclusion, is structured around three (3) points which are: 1) the situation of foreign trade and economic growth in Congo; 2) trade and economic growth in the literature; and 3) the methodological approach and interpretation of results.
2. Situation of Foreign Trade and Economic Growth in Congo
This section presents the situation of foreign trade, economic growth, and the cross-evolution of growth rates and oil profits in the Republic of Congo.
2.1. Foreign Trade
According to the World Trade Organization ( WTO, 2016 ), the openness of the Congolese economy has led to significant progress in strengthening trade, which represents 137% of its GDP. Measured by the degree of trade openness, foreign trade, in 2012, 2013 and 2014 was, respectively, of 142.60%, 143.24% and 165.64% ( World Bank, 2015 ). The evolution of foreign trade in Congo during the period from 1986 to 2016 is presented in the following Graph 1.
Graph 1 presents the evolution of trade openness (OUV) in Congo. Overall, the evolution of trade openness (OUV) admits a fluctuating pattern over time, with recurrent and alternating oscillations, showing an upward trend. Compared to the year 1986. The highest degree of trade openness was recorded in 2014 (165.64), while the lowest (57.14) was recorded in 1991. The accession of most of the countries in the subregion to the Structural Adjustment Program (SAP) at the end of the 1980s, their membership in the World Trade Organization (WTO), and their various multilateral, regional and bilateral free trade partnerships (CAPC colloquium, 2008) explain this upward trend in trade openness.
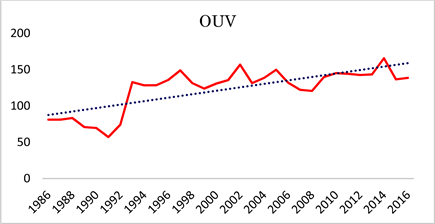
Source: authors, using data from the World Bank ( WDI, 2018 ).
Graph 1. Evolution of trade openness in Congo.
2.2. Economic Growth
The Congo’s economic growth situation shows growth rates of 7.57%; 7.75%; 8.75% and 6.77%, respectively, in 2000, 2005, 2010 and 2014 ( WDI, 2018 ). The evolution of economic growth in Congo during the period from 1986 to 2016 is presented in the following Graph 2.
Overall, the evolution of the economic growth rate (TX_GDP) admits a fluctuating pattern over time, with recurrent and alternating oscillations, showing an upward trend. Compared to the year 1986. The highest growth rate (8.75) was recorded in 2010, while the lowest (−6.86) was recorded in 1986. The recurrent and alternating oscillations in the economic growth rate can be explained by variations in oil prices, disruptions in oil production, in relation to the profits from oil, and the various socio-political crises that the Congo has experienced.
2.3. Cross-Evolution of Economic Growth Rate (TX_GDP) and Oil Profits (B_Oil)
The following Graph 3 shows the cross evolution of the economic growth rate and oil profits during the period from 1986 to 2016. Oil profits (B_Oil) are the difference between the value of crude oil at international market prices and the total cost of production.
Graph 3 thus highlights the relationship between the economic growth rate and oil profits. It can be observed from this graph that, except for periods of socio-political crisis, the years in which the growth rate was on the rise correspond to the increase in profits from oil. There is a positive correlation between these two variables. Overall, the cross-evolution of the two variables (TX_GDP and B_Oil) shows an upward trend and a fluctuating pattern over time, with recurrent and alternating oscillations.
3. Trade and Economic Growth in the Literature
Analyzing the effects of trade openness on the growth of an economy inevitably
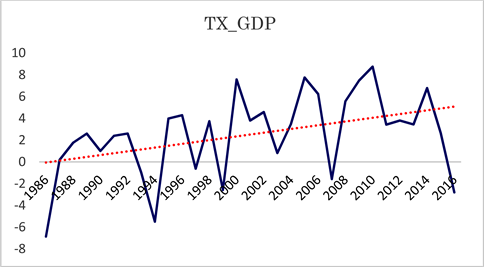
Source: authors, using data from the World Bank ( WDI, 2018 ).
Graph 2. Evolution of the economic growth rate (TX_GDP).
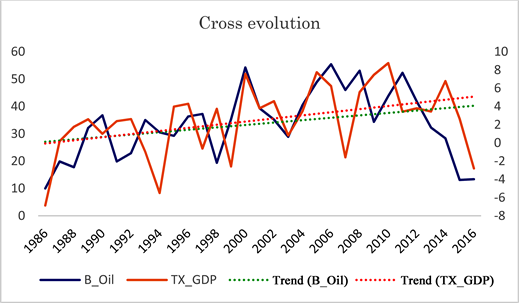
Source: authors, using data from the World Bank ( WDI, 2018 ). Note: Trend (B_Oil) and Trend (TX_GDP) are, respectively, the trend lines of oil profits and Economic growth rate.
Graph 3. Cross-evolution of the economic growth rate (TX_GDP) and oil profits (B_Oil).
comes down to examining the relationship between trade indicators and economic growth. This section presents the theoretical and empirical literatures.
3.1. Theoretical Literature
In the theoretical literature, the models of Rivera-Batiz and Romer (1991) and Grossman and Helpman (1991) provide a theoretical framework linking trade policy to long-term economic growth. According to these models, there are several mechanisms that lead to long-term economic growth due to trade openness:
· Market expansion
Trade openness increases the size of the market available to firms. Assuming that intermediate goods and finished products are traded between countries, a larger market size for research and development thus increases research and development activity and, consequently, economic growth is subject to increasing returns to scale. However, market enlargement is beneficial to consumers and producers. Indeed, trade openness allows consumers not only access to new markets, but also to a greater variety of quality products at lower cost. Their level of satisfaction increases and leads to an increase in the elasticity of demand for consumer goods. This competitive shock, born of the opening up of trade, requires companies to reduce their commercial margins, notably by lowering prices. Producers, for their part, achieve economies of scale, since their individual production increases. Trade openness thus has a positive influence on economic growth, since it encourages the accumulation and optimal allocation of productive resources.
· Technology transfer
The trade openness policy provides opportunities for communication with foreign counterparts, which facilitates technology transfer that increases imports of goods and services that include new technologies. Openness encourages companies to invent new ideas and technologies and, therefore, avoid duplication of Research and development (R&D) efforts. Through trade openness, the country experiences technological progress and its production becomes efficient. In addition, trade openness drives economic growth through investment ( Grossman & Helpman, 1991 ; Levine & Renelt, 1992 ).
· Increasing the supply of inputs and externalities
Trade openness gives producers greater leeway in the supply of intermediate consumption and other inputs or factors of production needed for their activities. This greater variety of inputs guarantees a better efficiency of the productive mix ( Ethier, 1982 ). Differentiated production can be used as a final consumption good or an intermediate consumption good. It also provides producers with quality inputs on advantageous terms. Grossman and Helpman (1991) and Aghion and Howitt (1992) explain the relationship using quality scale models. These models argue that new, higher quality goods are expected to provide more services than old goods. The new intermediate goods promote productivity gains plus an efficiency gain associated with specialization in segments of the production process. Consequently, independently of the well-known relative price effect, openness has a mechanical growth effect even if countries do not have comparative advantages in the production of the final good.
Similarly, the work of Baldwin and Seghezza (1996) formulates the argument that the New Growth Theory (NGT) provides theoretical support for the role of international trade in economic growth. The new growth theory literature suggests two links between trade openness and growth, namely: investment and technology. In terms of the investment link, trade openness promotes investment because the trade sector is more capital intensive than the non-trade sector and competition in the international market for machinery and capital goods lowers the price of capital.
In contrast, mercantilism argues for government involvement in promoting exports and limiting imports, and suggests that the country has a strong interest in maintaining a trade surplus ( José & Lopez 2020 ). As a result, international trade is a zero-sum game: one’s gain equals another’s loss. Similarly, many Third World politicians, such as Gunder (1970) , may have thought that trade was unproductive.
For Krugman (1987) , Lucas (1990) and Young (1991) , the initial situation of a country determines the nature of its specialization in the long term and consequently its growth rate after opening up. The latter then leads to poor specialization of a small economy and can push it into underdevelopment. In this context, the authors advocate protectionist trade policies, at least temporarily, to protect industries in their start-up phase.
3.2. Empirical Literature
In the empirical literature, the work of Obadan and Okojie (2010) uses annual time series data covering the period 1980 to 2007 to analyze the effects of trade on economic growth and development in Nigeria. The variables used are GDP growth rate, trade openness, exchange rate, foreign direct investment, domestic investment and political stability. The results show that trade openness has had a positive impact on economic growth in Nigeria and a significant negative impact on growth due to political instability. It was concluded that Nigeria’s export base, which is solely dependent on oil, should be diversified to include the export of agricultural products and solid minerals. Similarly, Marelli and Signorelli, (2011) use a panel data model from 1980 to 2007 with an instrumental variable approach for two countries, namely: China and India. The results show that in the short term, both countries are very open, despite major economic shocks such as the global crisis of 2008 to 2009, but they conclude that openness and integration in the world have positive effects.
On the other hand, other authors argue that trade openness creates an unfavorable (negative) framework for the economic growth of countries. Work carried out in Cameroon on the relationship between trade openness and economic growth over the period 1977 to 2003 using the ordinary least squares method (OLS). It shows that foreign trade is one of the essential levers of the Cameroonian economy. It is deduced that exports and imports have a positive and significant impact on economic growth in Cameroon, while trade openness has a significant and negative impact on growth in Cameroon ( Gachili & Dazoue, 2018 ).
In addition, work conducted in Algeria over the period from 1990 to 2014, by Amar and Hajar (2017) , analyzes the effects of trade openness on economic growth. After analyzing the impulse response and variance decomposition functions estimated by the VAR (Vector Autoregressive model), the results reveal that trade openness has a non-significant effect on economic growth. This means that the openness of the economy to the outside world does not constitute a determining factor of growth in Algeria.
4. Methodological Approach and Interpretation of Results
This section presents, first, the methodological approach of the study and, second, the presentation and interpretation of the results.
4.1. Methodological Approach of the Study
To analyze the effects of openness on the growth of economies, the methodology borrowed from Solow (1956) and Mankiw et al. (1992) makes it possible to formulate the theoretical model. This model, which is based on an exogenous view of growth, takes into account other factors such as human capital in the so-called augmented production function.
(1)
(2)
where
is the technical progress that increases labor,
is the human capital stock and
is the gross labor stock. According to this model, investment in human capital increases worker productivity and the growth of a nation, all other things being equal. By dividing the expression
by
, we find a more simplified expression as follows:
(3)
After linearization by the logarithm, our model becomes
(4)
Physical capital per capita (k) is represented by the share of investment in GDP. It is considered to be the share of GFCF in GDP, while primary or secondary school enrollment is used as a proxy for human capital (H).
According to ( Eaton & Kortum, 2002 ; Melitz, 2003 ), international trade theories predict an increase in individual welfare for an economy that moves from autarky to openness. This increase in welfare is due to the fact that individuals have a greater variety of goods at their disposal, which enables them to make better consumption choices. To better understand the different channels through which trade produces positive effects on growth, the production function is presented as follows:
(5)
The specified model, in analyzing the relationship between trade openness and economic growth, is inspired by the work of Obadan and Okojie (2010) who used annual time series data covering the period from 1980 to 2007 to analyze the effects of trade on economic growth and development in Nigeria. This specified model is as follows:
(6)
With
: the constant;
: the elasticities associated with the respective parameters;
: the error term.
Our specified model has one endogenous variable and five (05) exogenous variables defined as percentages, except for the labor force variable, in order to proceed with the econometric analysis. These variables are presented in the following subsection.
4.2. Presentation and Interpretation of Results
This subsection presents the variables and descriptive statistics, analyzes and interprets the results obtained.
4.2.1. Presentation of Variables and Descriptive Statistics
This point discusses the presentation and the descriptive analysis of the variables.
1) Presentation of variables
The different variables used in this paper are presented in the following Table 1.
![]()
Table 1. Presentation of variables.
Source: authors.
Source: authors, from Eviews 7.
The data are drawn from the World Bank’s World Development Indicators ( WDI, 2018 ). The study is conducted over a period from 1986 to 2016.
2) Descriptive analysis of variables
It is necessary to perform a descriptive analysis of variables in this study, observed over a period of 31 years (from 1986 to 2016). This analysis is done through the characteristics of the central tendencies and dispersion such as the mean value of the variables, their standard deviations, etc. When there is variation around the mean, there is a deviation between each observation and the mean.
For the analysis of the variables, we use the Coefficient of Variation (CV), which is simply the ratio of standard deviation to the mean value. When the CV is less than 17%, there is a low dispersion of the data around the mean. When the CV is higher than 17%, there is a strong dispersion around the mean.
The descriptive analysis of the variables shows that all the series present a strong dispersion (coefficient of variation higher than 17%) around the mean value.
4.2.2. Presentation and Analysis of Results.
The results of the different tests performed and the model estimation are presented below.
· Stationarity of the variables
The estimation of an econometric model is conditioned by the existence of stationarity of the variables. That is, the variables must be integrated in the same order. In this study, the variables are examined using three stationarity tests: the Augmented Dickey and Fuller (ADF) test, the Philips and Perron (PP) test and the Kwiatkowski, Phillips, Schmidt and Shin (KPSS) test. The use of the latter is conditioned by the fact that the variables under study must be normally distributed, following a normal distribution. The result is that the variables in the study are stationary in first difference (see results in the appendices).
· Cointegration analysis
The results of the Johansen cointegration test, which verifies a long-term cointegrating relationship between the variables, are presented in Table A. The result is that the variables are cointegrated (the test results are reported in the appendices).
· Analysis of the model estimation results
The results from the model estimation are divided into three main parts: results for the adjustment speeds of the VECM equations (Table 3), results for the long-term model estimation (Table 4), and results for the short-term model estimation (Table 5). We recall that the exogenous variables retained in this study explain the endogenous variable. The estimation results show a negative and significant coefficient of recall at the 1% level (−2.432; [−3.172]), which confirms the existence of an adjustment relationship towards the long term equilibrium. The model to be retained is D (TX_GDP). Table 3, below, presents the adjustment speeds of the VECM equations.
In addition to the coefficient of the recall force, which is negative and significant, the results of the test of autocorrelation of the residuals by the correlogram of the residuals and the Ljung-Box statistics confirm the absence of autocorrelation of the residuals. Indeed, according to the results of the test, all the terms of the
![]()
Table 3. Adjustment speeds of the VECM equations.
Source: authors, from Eviews 7. Note: in square brackets are the t-student. ***; **and * represent the significance at the 1%, 5% and 10% level. D (TX_GDP), D (GFCF), D (TX_FDI), D (TX_SS), D (OUV) and D(PA) represent the speed of adjustment, respectively, of the variables Gross domestic product (%), Gross fixed capital formation, foreign direct investment, secondary school enrollment, commercial opening (in %) and labor force.
auto-correlation functions (simple and partial) are all located inside the confidence interval materialized by the lines significantly different from zero (associated probabilities are higher than 5%) which leads to retain the hypothesis H0 of no auto-correlation. The residual is white noise, so the results can be used for analysis.
This Table 4 shows that in the long term, TX_GDP and secondary school enrollment (TX_SS) have a significant and positive effect on the economic growth rate (TX_GDP) in Congo. In contrast, trade openness and labor force (PA) have a negative effect on the economic growth rate in Congo, but this effect is not significant for trade openness.
Indeed, a 1% increase in trade openness, all else equal, leads to a decrease in growth rate (TX_GDP) of 0.0254. The increase of one unit of the labor force (PA), all else equal, leads to a decrease, almost zero, of the TX_GDP of 0.0003. A
![]()
Table 4. Estimation of the long-term relationship.
Source: authors, from Eviews 7. Note: in square brackets are the t-students. ***; **; * represent significance at the 1%; 5% and 10% level.
![]()
Table 5. Estimation of the short-term relationship.
Source: authors, from Eviews 7. Note: in square brackets are the t-students. ***; **; * represent significance at the 1%; 5% and 10% level.
1% increase in the FDI and TX_SS, all else equal, leads to an increase in the TX_GDP of 1.03 and 0.282, respectively. Increasing the GFCF by one unit, all else equal, has a zero effect on TX_GDP.
Table 5 shows that in the short term: trade openness has a negative and non-significant effect on the economic growth rate (TX_GDP). A 1% increase in trade openness, all other things being equal, leads to a decrease in TX_GDP of 0.0237. Secondary school enrollment (TX_SS), GFCF and TX_FDI have a positive and significant effect at the 1%, 1% and 10% thresholds, respectively. Increasing GFCF by one unit and TX_SS and TX_FDI by 1%, all else being equal, leads to an increase in TX_GDP of 0.371, 0.292 and 0.439, respectively. The labor force (PA) has a negative and significant influence on the growth rate. The increase of one unit of PA leads to a decrease of 0.0015.
4.2.3. Interpretation of the Results
The results obtained in this study show that in the short and long term, trade openness (OUV) has a non-significant negative effect on the growth rate (TX_GDP). The main lesson to be drawn from this result is:
· Trade openness: a hindrance to the improvement of the economic growth rate in Congo
Indeed, trade openness evolves in the opposite direction to the economic growth rate, i.e. an increase in trade openness (of 1%) leads to a non-significant decrease in the economic growth rate, all else being equal, of 0.0237. This result does not confirm our initial hypothesis. However, it does validate the work of Lambrechts, McGrath, and Rule (2012) who state that other factors may also play a role in GDP growth and that when social unrest is evident, levels of trade freedom may not align with GDP growth. Economic growth and free trade cannot be measured in isolation to prove whether growth is improving or slowing. The issue is complex and requires a more thorough analysis of economic freedom factors encompassing business freedom, monetary freedom, and property rights. This result, in the case of the Congo, is explained by the high dependence of the Congolese economy on exports of raw materials (natural resources), including oil. This high dependence on commodity exports has a negative impact on economic growth ( Sala-i-martin & Subramanian, 2003 ; Aoun, 2006 ). Thus, this result is similar to the resource curse theory that establishes a negative correlation between natural resource abundance and economic growth ( Sachs & Warner, 1995 ).
5. Conclusion and Policy Implications
The objective of this study was to analyze the effects of trade openness on economic growth in the Republic of Congo. In addition to trade openness (OUV), the variables GFCF, TX_FDI, TX_SS and PA were taken into account as additional exogenous variables.
To achieve our objective, data of an annual frequency, spread over 31 years (from 1986 to 2016), were used and associated with a multi-step procedure: from stationarity analysis (ADF, PP and KPSS tests) to estimation by the Vector Error Correction Method (VECM), via the Johansen cointegration test (in the Appendices).
The estimation of the VECM showed the existence of negative effects, in the short and long term, between trade openness (OUV) and the economic growth rate (TX_GDP) in the Republic of Congo. The hypothesis defended in this study is therefore not verified.
This result allows us to formulate some policy implications:
1) Diversification of the economy by boosting other sectors of activity other than those of oil and woods.
The Congo, whose exports are concentrated on a single product (oil), remains dependent on foreign demand where prices are exogenous to its policy. With increasingly limited trade prospects, the Congo would not be able to withstand external shocks.
Diversification of exports does not necessarily mean simply processing primary products. It is true that it is a matter of developing activities whose trade flows are expanding rapidly. But it is about making the value of exports less vulnerable to fluctuations in commodity prices and reducing their volatility by moving into multiple markets.
Another effective way to increase the value of production would be to transform the raw materials (wood and others) available to the country and to develop, on the basis of these resources, and industrial sector with higher added value, focusing on products for which demand is increasing. To this end, the manufacturing sector and the agricultural sector should be given special attention. To do this, the State should undertake a number of measures such as: paying more attention to other non-oil productive sectors that have a greater impact on the Congolese economy; re-injecting export revenues into the economic circuit; promoting the development of the manufacturing sector, particularly the agricultural sector, which is a significant factor in economic growth, capable of reducing poverty and unemployment.
2) Ensure political stability.
It should be noted that sustainable and sustained growth cannot be achieved without political stability. To this end, authorities should opt for a conflict prevention policy that consists of improving the independence and impartiality of the judicial system; favoring more dialogue in the resolution of the various potential political crises; strengthening the conditions for the functioning of a true republican army; promoting greater involvement of civil society in the resolution of disputes. The lack of transparency, lack of accountability in economic management, an improper balance of power and counterpowers, and the absence of the rule of law are among the main sources of conflict. The lack of transparency in the management of mining and other natural resources is often at the center of conflicts. An effective mechanism for the publication of revenues from forestry and petroleum exploitation (or extraction) and exports should be put in place for the benefit of transparency. In order to gain the confidence of international institutions, the State should also encourage the establishment of an appropriate juridical environment and promote transparency at all levels of the management of public affairs.
3) Policy of trade
The policy of trade openness allows to increase imports of goods and services that include new technologies, and through quality training, its innovative products would be better understood in society in order to boost the national economy; the installation of multinational firms in the Congo would be favorable insofar as it increases competition and encourages domestic firms to improve their technologies and reorganize their management and organizational methods. On the other hand, it allows the transfer of foreign technology to the Congo and stimulates domestic companies. In addition, multinational firms help reduce unemployment in developing countries by hiring skilled and unskilled workers. However, human capital in developing countries does not allow them to benefit from openness. This may be the result of the austerity policy pursued by these developing countries to repay the debt. They must make efforts to improve quantitatively and qualitatively this factor in order to be able to assimilate foreign technology and transfer it to the whole national economy.
Economic growth and free trade cannot be measured in isolation to prove that free trade improves or hinders growth. The issue is complex and requires a thorough analysis of economic freedom factors encompassing business freedom, monetary freedom and property rights. Countries such as Argentina and Mexico have demonstrated that other factors can also affect GDP growth and that, when social unrest is evident, levels of trade freedom would not align with GDP growth ( Lambrechts, McGrath, & Rule, 2012 ).
This study did not take into account governance variables in the relationship between trade openness and economic growth, which would elucidate the implementation of anti-corruption strategies and political instability. This would also allow us to verify the effectiveness of government actions and the quality of the regulatory framework. Credible governance would influence the level of growth of the Congo economy.
Appendices
Stationarity test
The execution of these different tests in this paper gave the results summarized in the table below.
Results of the stationarity tests
Source: authors, on Eviews 7.
Result of the Johansen cointegration test
Source: authors, on Eviews 7.