Impact of Covid-19 on Global Debt: A Study of Countries in the G-20 Group ()
1. Introduction
Well after the deleterious health and economic effects of Covid-19 are resolved, it is likely to leave the global economy with one long lasting effect, namely, an upsurge in the debt-GDP ratios of individual countries. For analyzing this, we have selected 19 individual countries of the G-20 group1. The evolution of country-wise debt indicates that major economic crises have led to one-time upsurges in the debt-GDP ratios. These tend to remain at high levels well after the crises are over, showing downward rigidity. Further, each major crisis has resulted in an increase in both government and private debt relative to GDP on average. After 2010, the government debt-GDP ratio rose at a rate faster than the increase in the private debt-GDP ratio. This resulted in a change in the composition of debt where the share of government debt in total debt increased. In this paper, we estimate that Covid-19 induced increase in government debt-GDP ratio for the selected countries, would amount to 14.9% points on average, which is more than 141% higher than the increase of 6.2% points resulting from the 2008 global economic and financial crisis. This is because the Covid-19 induced contraction in GDP is estimated to be much sharper and the fiscal stimulus has also been quite larger than the 2008 crisis. Both of these factors are expected to lead to an increase in the country-wise debt-GDP ratios, particularly government debt to GDP ratios in 2020. The private sector entities have also attempted to cope with the pandemic by increasing their indebtedness.
In the related literature, a country’s indebtedness has been indicated by the sum of private non-financial debt and government debt (Mbaye, Badia, & Chae, 2018), where government debt pertains to the general government covering central and subnational governments.
In this paper, we propose a methodology for projecting the increase in the debt-GDP ratio as a function of: 1) incremental borrowing relative to GDP, 2) real GDP growth and 3) GDP deflator-based inflation. We also estimate the relative contribution to the increase in government debt-GDP ratio, individually of these factors.
2. Evolution of Country-Wise Total Debt-GDP Ratio: 1996 to 2019
In this section, we undertake a review of the evolution of country-specific total debt-GDP ratios over the period 1996-2019. This analysis is in terms of debt-GDP ratios where both debt and GDP are in local currency units (LCU). Data for this analysis has been drawn from the International Monetary Fund (IMF, 2020a, 2020b and Global debt data base2) which is presently available up to 2019. For two years, that is, 2020 and 2021, government debt levels have been projected by using real GDP growth and inflation rate forecasts as sourced from the IMF World Economic Outlook (October 2020a). Further, the fiscal deficit to GDP ratio for 2020 and 2021 has been derived by using government debt to GDP ratio and the nominal GDP for these two years as projected by the IMF in its WEO (October 2020a).
In terms of the underlying economic conditions during 1996 to 2019, the 2008 global economic and financial crisis was preceded by other economic crises affecting different groups of countries from time to time. Thus, in the late 90’s, there was the Latin American economic crisis as also the Southeast Asian crisis. The latter had continued up to the early 2000’s. From 2010 to 2013, there was the European sovereign debt crisis. Also, global crude prices had been strongly cyclical during this period, affecting the fortunes of the oil-rich economies on the one hand and oil-import dependent economies on the other (Baffes et al., 2015). We find that the evolution of the debt-GDP ratio has generally been episodic, rising sharply during crisis years, and then remaining stable at an elevated level until the next crisis is encountered. The downward adjustments in the indebtedness of a country have been very limited and exceptional. Table 1 indicates the total debt-GDP ratio comprising private and government debt of the selected G-19 countries.
![]()
Table 1. Total debt-GDP ratio of selected G-19 economies: 1996 to 2019.
Source (basic data): IMF.
We consider the period 1996 to 2019 into certain sub-periods. The first sub-period covering 1996 to 2005, reflects the impact of the Latin American/Southeast Asian crises. In this period, maximum increases in the debt-GDP ratio have occurred for the UK at 44.2% points, followed by Argentina at 40.9% points. Sharp increases in debt relative to GDP were also observed for Australia (36.9% points), India3 (31.7% points), China (30.1% points), Japan (27.9% points), the US (27.1% points), Brazil (27.1% points), and France (26.9% points).
The second sub-period from 2005 to 2010 captures the impact of the 2008 global economic and financial crisis. In this crisis, many western and European economies were particularly adversely affected. The sharpest increase was experienced by the UK, with an increment of 63.0% points, followed by the US at 46.1% points, and France at 41.1% points. In India’s case, the total debt relative to GDP fell by 2.0% points.
In the next phase during 2010 to 2013, when the European sovereign debt crisis also occurred, countries that experienced an increase in their total debt-GDP ratio of above 10% points include Japan at 21.0% points, China at 19.7% points, France at 17.0% points, Canada at 16.4% points and South Korea at 15.7% points.
In the last phase during 2013 to 2019, sharp increases were observed for China at 53.4% points, Argentina at 46.7% points, followed by France at 37.9% points, Brazil at 34.8% points and Saudi Arabia at 29.0% points. This period coincided with some country-specific crises such as the Brazilian economic crisis (2014 to 2017), Chinese stock market crisis (2015), Turkish currency and debt crisis (2018) and Russian financial crisis (2014).
Considering the overall period, with the exception of two countries namely, Indonesia and Saudi Arabia, all other countries have experienced an increase in their total debt-GDP ratio by significant margins between 1996 and 2019. The highest increase at 140.7% points is that for China, followed by France at 123.0% points, Australia at 93.0% points, the UK at 89.7% points, and Japan at 87.6% points. The lowest increases are for Germany at 0.6% points, followed by Mexico at 9.9% points, Russia at 23.9% points, South Africa at 32.1% points and India at 35.4% points.
3. Composition of Debt: Relative Share of Government Debt in Total Debt
In this section, we examine the changing profile of the composition of total debt as divided between government debt and private debt for individual countries with respect to four benchmark years namely, 1996, 2005, 2010, and 2019.
Chart 1 shows that in the selected countries, in 1996, the share of government debt in total debt was the highest for Russia at 85.6%, followed by Saudi Arabia at 74.4% and India at 71.6%. At the lower end, the lowest share of government debt in total debt was for South Korea at 5.3%. The next two countries were Australia at 20.3% and China at 20.5%. The average share of government debt in total debt for the selected countries was 43.5% in 1996.
By 2005 (Chart 2), a number of Latin American countries (Talvi, 2015) had experienced economic crisis. Prominent amongst these countries was Argentina where the share of government debt in total debt rose to 75.9% by 2005. In Turkey, this share increased to 69.5% and in Brazil, it increased to 59.7%. However, other countries experienced a decline in their share of government debt in total debt as compared to that in 1996. This set of countries includes Russia, Saudi Arabia, South Africa, the UK, the US, Australia, Canada, Italy and India. The average share of government debt in total debt for the selected countries was 42.0% in 2005, a fall of 1.5% points from the level in 1996.
By 2010 (Chart 3), the effect of the 2008 global economic and financial crisis had become visible. The share of government debt in total debt increased in the UK, the US, Germany, Australia, Japan, China and France. However, in most other countries, this share fell, indicating that the 2008 crisis had led to an even greater increase in private debt particularly in the emerging market economies. The average share of government debt in total debt for the selected countries was 37.4% in 2010, a fall of 4.6% points from the level in 2005.
In Chart 4, we look at the composition of debt for 2019. The intervening years from 2008 were characterized by growth of both private and government debt in

Chart 1. Share of government debt in total debt: 1996. Source (basic data): IMF.
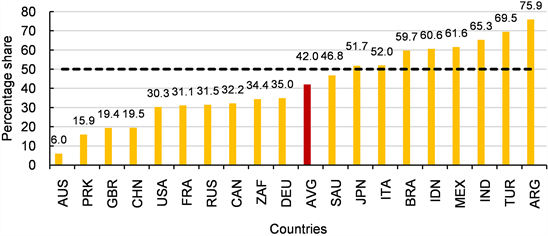
Chart 2. Share of government debt in total debt: 2005. Source (basic data): IMF.

Chart 3. Share of government debt in total debt: 2010. Source (basic data): IMF.
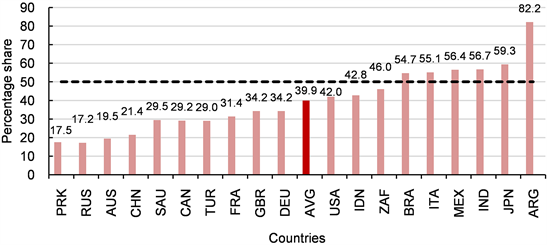
Chart 4. Share of government debt in total debt: 2019. Source (basic data): IMF.
most countries. The relative share of government debt increased prominently in the case of Saudi Arabia, South Africa, Argentina, Australia, Italy, the UK, and the US. Countries which experienced a decline in their share of government debt in 2019 as compared to 2010 include Turkey, Germany, Indonesia, Canada, Mexico and France. The average share of government debt in total debt for selected countries was 39.9% in 2019, an increase of 2.5% points from the level in 2010.
Thus, over the period from 1996 to 2010, there was an increase in the overall debt-GDP ratio of countries in general, but this increase was relatively more for private debt whereas the share of government debt in total debt had shown some decline. Between 2010 and 2019, the overall debt-GDP ratio continued to surge, but in this period, the share of government debt in total debt increased on average.
4. Government Debt-GDP Ratio
In this section, we look at the drivers of growth in Government Debt to GDP ratio both from a theoretical perspective and an empirical perspective. Empirically, we review the comparative position of the countries under study with respect to the evolution of their government debt to GDP ratio. This section is divided into two sub-sections. Section 1) provides the theoretical underpinnings leading policy makers to incur annual borrowing. Section 2) provides an overview of evolution of country wise debt.
1) Theoretical underpinnings rationalizing annual borrowing
Policy makers are informed by their persuasion of the arguments emanating from one or more of four major schools of thought. These are referred to in the literature as: 1) Ricardian equivalence 2) Neo-Classical school, 3) Keynesian paradigm in its conventional or modern forms and 4) the “tax and spend” school. For a detailed discussion see Barro, Robert (1989), Bernheim, B. D. (1989), Von Furstenberg et al. (1986), Eisner, R. (1989) and Rangarajan, C. and Srivastava, D. K. (2004, 2005).
Economists have not arrived at any consensus on analytical grounds or otherwise as to the relevance or superiority whether financing government expenditure by incurring a fiscal deficit is good, bad, or neutral in terms of its real effects, particularly on investment and growth. Among the mainstream analytical perspectives, the neo-classical view considers fiscal deficits detrimental to investment and growth, while in the Keynesian paradigm, it constitutes a key policy prescription. Theorists persuaded by Ricardian equivalence assert that fiscal deficits do not really matter except for smoothening the adjustment to expenditure or revenue shocks. While the neo-classical and Ricardian schools focus on the long run, the Keynesian view emphasizes the shortrun effects. Whatever may be the persuasion of policy makers in different countries in different times, it is clear from our overview that most policy makers become Keynesian when the economy faces a major economic crisis resulting into a recession or slowdown. This is amply clear by the one time jumps in the fiscal deficit to GDP ratio in the presence of a major economic crisis (see Appendix 3).
In 1996 (Chart 5), three countries, namely Italy, Japan and Canada already had a government debt to GDP ratio which was higher than 100%. Other countries like Saudi Arabia, the US, India, and France had a government debt-GDP ratio in the range of 60% to 75.2%. As economies went through different phases of economic crises and responded to these crises through fiscal stimulus based on an increase in their fiscal deficits, their government debt to GDP ratio kept increasing. The average government debt to GDP ratio for the selected countries was 53.9% in 1996.
By 2005 (Chart 6), in the case of Japan, the government debt to GDP ratio had increased to 176.6%. For Italy, this ratio fell marginally from 119.1% in 1996 to 106.6% in 2005. In India’s case, it increased from 66% in 1996 to 80.9% in 2005. The government debt to GDP ratio remained in the range of 50% to 71% for a number of countries including Turkey, the US, Brazil, Germany, France and Canada in 2005. The average government debt to GDP ratio for the selected countries was 58.1% in 2005, an increase of 4.2% points from its level in 1996.
By 2010 (Chart 7), the government debt-GDP ratio surged to 207.7% in the case of Japan and 119.2% for Italy. For the US, there was a massive jump from 65.5% in 2005 to 95.5% in 2010, an increase of 30% points. Some of the other western economies like France, Canada, the UK and Germany also experienced an increase in their government debt to GDP ratios of more than 10% points.
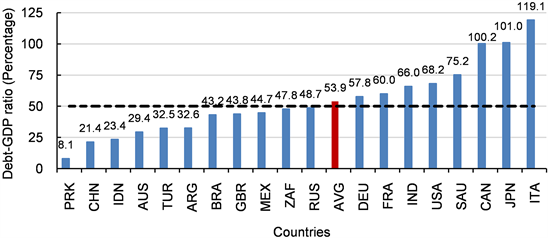
Chart 5. Government debt relative to GDP: 1996. Source (basic data): IMF.

Chart 6. Government debt relative to GDP: 2005. Source (basic data): IMF.
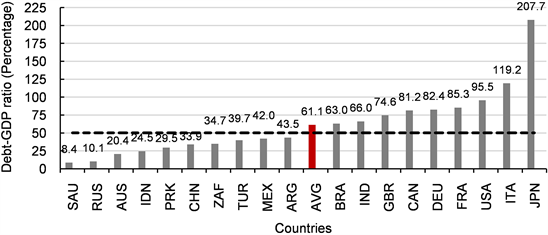
Chart 7. Government debt relative to GDP: 2010. Source (basic data): IMF.
These countries had borne the brunt of the 2008 crisis. India however experienced an improvement in its government debt-GDP ratio which fell from 80.9% in 2005 to 66% in 2010, a fall of nearly 15% points. This showed the effect of adherence to the Fiscal Responsibility and Budget Management Act (FRBMA) which was adopted by both the central and state governments during 2003 to 2010. The average government debt to GDP ratio for the selected countries was 61.1% in 2010, an increase of 3.1% points from its level in 2005.
By 2019 (Chart 8), in the case of Japan, government debt to GDP ratio had continued to surge, reaching a level of 238.0%.
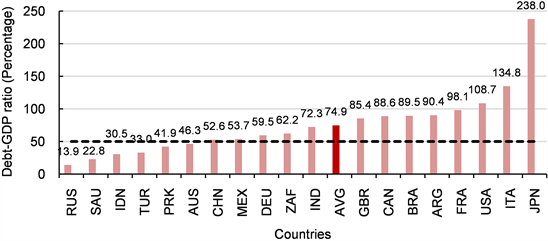
Chart 8. Government debt relative to GDP: 2019. Source (basic data): IMF.
Italy showed a substantial increase, touching a level of 134.8%. In the US, government debt relative to GDP reached a level of 108.7%. Countries showing a fairly high government debt to GDP ratio included France, Argentina, Brazil, Canada, and the UK. In India’s case, the government debt-GDP ratio increased to 72.3% in 2019. The average government debt to GDP ratio for the selected countries was 74.9% in 2019, a sharp increase of 13.7% points from its level in 2010.
5. Projecting Government Debt-GDP Ratio for the Pandemic
In this section, we consider decomposing the change in the government debt-GDP ratio in a country into three factors namely, 1) increased borrowing, 2) real growth rate and 3) inflation rate. Change in government debt amounts to a country’s fiscal deficit which is one of the main instruments through which a stimulus is injected in order to overcome an economic crisis.
Change in the government debt-GDP ratio in any year t may be defined as:
(1)
Here,
and
denote the debt-GDP ratio in the year t and
respectively.
is the fiscal deficit to GDP ratio in year t which is defined as change in the level of debt relative to the level of nominal GDP, that is,
refers to the nominal growth rate which can be expanded as the sum of real growth rate and the inflation rate, that is,
Equations (1) can be written as follows after ignoring the interaction term
:
(2)
or
(3)
(4)
Utilizing Equation (4), we project the government debt-GDP levels for 2020 and 2021, using independent projections of fiscal deficit to GDP ratio, real GDP growth and inflation rate in these years. Real GDP growth and inflation forecasts are taken from the October 2020 issue of IMF’s World Economic Outlook (WEO). The fiscal deficit to GDP ratio has been derived by using government debt to GDP ratio and the nominal GDP for these two years as projected by the IMF in its WEO (October 2020a). The relevant values are given in Appendix 2.
Table 2 shows the sharp increase in the government debt-GDP ratio in 2020 over 2019. The largest increase is for Japan at 28.1% points, followed by Italy at 26.7% points, Canada at 25.9% points, and the UK and the USA at 22.4% points each. The average increase in the government debt-GDP ratio for selected countries in 2020 is estimated at 14.9% points.
![]()
Table 2. Projected government debt relative to GDP: 2020 and 2021.
Source (basic data): IMF, OECD, authors’ estimates.
6. Analyzing Change in Government Debt-GDP Ratio: Relative Contributions of Fiscal Deficit, Growth and Inflation Factors
With a view to estimating the relative contribution of different factors, we may rewrite Equation (4), after ignoring the product terms, as follows (see Appendix 1):
(5)
Equation (5) indicates that in order to derive the current level of debt-GDP ratio, only a proportion of previous year’s debt to GDP ratio should be added to the current fiscal deficit relative to GDP. This fraction applied to previous year’s debt to GDP ratio depends on current real growth and inflation levels. Higher the levels of current growth and inflation, the lower would be the increase in the current level of debt to GDP ratio.
Following from Equation (5), we can also write:
(6)
where
.
The relative contribution of the two terms on the right hand side in explaining the increase in the debt-GDP ratio between two successive years namely t and
can be written as:
(7)
In a normal year,
and
are positive and the entire second term enters with a negative sign. However, in a crisis year, when the growth rate contracts,
would be negative while
may continue to be positive. The contribution of the second term in Equation (7) can be divided into two terms with associated signs as indicated below:
Thus, a negative growth rate will contribute positively to the increase in the debt-GDP ratio while a positive inflation will contribute negatively to the increase in debt-GDP ratio. If a country experiences a price deflation in a crisis year, even the third term would contribute positively to the increase in the debt-GDP ratio.
A review of available literature on the subject has also highlighted the significant role that the growth experience of countries has played in the evolution of their debt-GDP ratio. Thus, Easterly (2001) shows how the growth slowdown played an important role in the debt crisis of the middle income countries in the 1980s, the crisis of the Highly Indebted Poor Countries (HIPCs) in the 1980s and 1990s, and the increased public debt burden of industrial countries in the 1980s and 1990s. Using a VAR model with debt feedback, Cherif and Hasanov (2012) conclude that when the economy is weak, the safest policy for reducing high level of public debt is to stimulate growth as compared to the option of introducing fiscal austerity and/or high inflation.
In Table 3 and Table 4, we have analyzed the change in the government debt-GDP ratio with respect to the two crisis years namely, 2009 and 2020. This requires comparing change in government debt-GDP ratios for end-2009 over end-2008, and end-2020 over end-2019. With respect to the earlier 2008 crisis, it is clear that in all those countries where the growth factor made a positive contribution to the increment in debt-GDP ratio, the change in debt became quite substantial. Thus, in Canada, the increase was 11.4% points, in France, 14.3% points, in Italy, 10.4% points, in Japan, 17.6% points, in the UK, 13.9% points and in the US, 13.0% points. India, however, was able to show a contraction in its debt-GDP ratio of (−)1.7% points while Indonesia showed a contraction of (−)3.8% points. In these cases, the contribution of the growth factor to the increase in government debt-GDP ratio was negative.
![]()
Table 3. Estimated contribution to increase in government debt to GDP ratio: 2009 over 2008.
Source (basic data): IMF, OECD, authors’ estimates.
![]()
Table 4. Estimated contribution to increase in government debt to GDP ratio: 2020 over 2019.
Source (basic data): IMF, OECD, authors’ estimates.
Table 4 shows the impact of Covid-19 on the government debt-GDP ratio of selected countries and the relative role of its determinants. A major reason for a sharp increase in the government debt-GDP ratio in the Covid-19 period is because of the expected contraction in the growth rates of both developed and developing countries. The average percentage contribution of the growth factor to the increase in government debt-GDP ratio is expected to rise to 37.5% in 2020 as compared to 23.6% in 2009. Clearly, Covid-19 is turning out to be a far more serious crisis, having its impact on countries’ economic and fiscal parameters.
7. Policy Implications
Countries which have Fiscal Responsibility Legislations (FRLs) where government debt-GDP ratio is a policy target include France, Germany, India, Indonesia, Italy, South Korea and Saudi Arabia. Amongst these countries, except Saudi Arabia and South Korea, all others are governed by a general government debt ceiling of 60% of GDP. In Saudi Arabia, the government debt ceiling has been raised to 50% of GDP in 2020 from 30% earlier whereas in South Korea, it is set at 40% for the period 2018 to 2022 and is proposed to be raised to 60% of GDP from 2025 onwards. In France, Germany and Italy, which are part of the European Union, the government debt ceiling is determined by the Maastricht criteria. In the case of India, it is set at 60% of GDP as per the Fiscal Responsibility and Budget Management Act as amended in 2018. In Indonesia, the government debt ceiling of 60% of GDP was adopted in 2003 through the enactment of Law No. 17 of 2003 on State Finances.
From a policy perspective, it may be useful to examine the extent of achievement of the debt targets by these individual economies in 2019 and the likely slippage from their respective FRL targets in 2020 due to the pandemic. Prior to the pandemic, in 2019, the slippage in public debt levels in France and Italy was 38.1% points and 74.8% points respectively whereas for Germany, there was no slippage. In 2020 however, the projected slippage in government debt levels for these three European economies is expected to increase significantly to 58.5% points, 101.5% points and 13.2% points respectively. Similarly, in India, the deviation of general government debt from the limit of 60% is forecasted to rise to 28.9% points in 2020 (FY21) as against 12.3% points in 2019 (FY20). In South Korea, the slippage from the public debt limit of 40% is forecasted at 8.4% points in 2020.
Table 5 shows the slippage in the government debt-GDP levels of the selected counties with respect to a common benchmark value of 60%. Except for some of the oil and mineral rich countries, the slippage has been building up even before the onset of Covid-19. On average, it was 14.9% points in 2019. Within a short span of two years, the Covid-induced spurt in slippage is likely to amount to 16.4% points. Experience of previous crises has indicated that the private debt levels may also rise in tandem. Further, once countries become used to a higher debt-GDP level, due to downward rigidity, there may be considerable difficulty in reducing this slippage. Thus, both the fiscal and financial systems of the global economy are likely to become much weaker even after the health and growth situation becomes normal. These effects are expected to last much longer.
We have indicated that the substantive upsurge in the government debt-GDP ratio is because two of its three determinants namely, fiscal deficit and growth supplement each other in a pandemic year leading to an increase in the government debt-GDP ratio. This is because growth rate becomes negative. There is thus a policy trade-off in dealing with the pandemic. A higher fiscal deficit within a country could be justified if it can minimize the contraction in its growth rate. Furthermore, there is a case for coordination amongst major economies of the world in implementing their fiscal stimuli. A joint and well-coordinated effort to stimulate major global economies may help minimize the contractionary export effect of the pandemic. In 2008 crisis, such a coordination was consciously attempted within the G-20 framework. But in the Covid-19 crisis, such a global coordination of stimulus efforts is notably missing.
![]()
Table 5. Estimated slippage in government debt-GDP ratio from the benchmark of 60%: pre and post-pandemic.
Source (basic data): IMF, OECD, authors’ estimates; aFor Argentina, the 2020 debt-GDP level has been used in the absence of the fiscal deficit value for 2021.
8. Concluding Observations
An overview of evolution of government debt relative to GDP over the period 1996 to 2019 for a set of 19 countries of the G-20 group indicates the following trends:
1) Major economic and financial crises have resulted in one-time increases in the government and private debt-GDP ratios in countries experiencing the crises. Once the debt level increases, with few exceptions, it tends to remain at higher levels, showing downward rigidity. During 1996 to 2019, the average total debt-GDP ratio increased from 136.4% to 191.6%.
2) The government debt-GDP ratio increased from 53.9% in 1996 to 74.9% in 2019 on average.
3) Governments rely on stimulus programs to overcome economic crisis, resulting in increase in fiscal deficit in the crisis years. When this is accompanied by a contraction in growth rate, the upsurge in the government debt-GDP ratio is quite large.
4) The impact of Covid-19 on the government debt-GDP ratio is estimated to be more than double the size of the impact of the 2008 global economic and financial crisis. This increment was 6.2% points in the 2008 crisis and is estimated at 14.9% points on average following the Covid-19 crisis.
5) As a result, most countries having government debt-GDP targets in their Fiscal Responsibility Legislations (FRLs) are likely to slip significantly away from their respective target values. Using a government debt-GDP ratio of 60% for 19 countries as benchmark, post-Covid, at the end of 2021, the average slippage is expected to be 31.3% points.
The Covid-19 crisis has been characterized by a lack of inter-country coordination in their stimulus programs unlike the G-20 coordination in dealing with the 2008 crisis. With a significantly weaker fiscal and financial post-Covid situation, policy coordination among major countries of the global economy requires to be vigorously brought back in global policy dialogue.
Appendices
Appendix 1: Decomposing Change in Government Debt-GDP Ratio: Methodology
Change in the government debt-GDP ratios in any year t may be defined as:
(1)
Here,
and
denote the debt-GDP ratio in the year t and
respectively.
is the fiscal deficit to GDP ratio in year t which is defined as change in the level of debt relative to the level of nominal GDP, that is,
.
refers to the nominal growth rate which can be expanded as the sum of real growth rate and the inflation rate, that is,
Equation (1) can be written as follows after ignoring the interaction term (
):
(2)
We can write Equation (3) as:
(4)
(5)
*The expansion of Taylor series using binomial theorem can be given as:
If we substitute (−1) for n, we get:
Ignoring the third order terms*, we can write:
(6)
Ignoring the third order terms again, this may give us a close approximation of the evolution of debt relative to GDP.
(7)
The above equation can also be written as:
(8)
Ignoring the product term, contributions of real growth and inflation to the evolution of debt can be separated by re-writing this equation as:
(9)
Following from Equation (9), we can also write:
(10)
(11)
The relative contribution of the two terms on the right hand side in explaining the increase in the debt-GDP ratio (
) between two successive years namely t and
can be written as:
(12)
(13)
In the case of a contraction when
is negative, the second term can be rewritten as
that is
Thus, a negative growth rate will contribute positively to the increase in the debt-GDP ratio in addition to the contribution of the current year’s fiscal deficit relative to GDP. In fact, if a country experiences a price deflation in a crisis year, even the third term would contribute positively to the increase in the debt-GDP ratio. However, as long as inflation remains positive, there would be some counterbalancing effect of the inflation factor on the increment in the debt-GDP ratio between two successive years.
Appendix 2: Parameters Used for Projecting Debt-GDP Ratios for 2020 and 2021
Source (basic data): IMF World Economic Outlook, October 2020.
Appendix 3: Fiscal Deficit as Percentage of GDP
![]()
![]()
Source: IMF World Economic Outlook database (October 2020 update); Notes: 1) The upsurge in fiscal deficit to GDP ratio for all the 19 countries in 2009 reflects the impact of the Global Economic and Financial crisis of 2008; 2) The impact of the Latin American crisis (Late 1990s) and Southeast Asian Crisis (late 1990s and early 2000s) is shown by an elevated fiscal deficit to GDP ratio for Brazil and Mexico in 1998 and Argentina in 2001; 3) The Brazilian economic crisis during 2014 to 2017 led to an increase in the fiscal deficit to GDP ratio of Brazil during these years; 4) The impact of the European sovereign debt crisis (2010-2013) is visible in the increased fiscal deficit relative to GDP for France, Germany and Italy in 2010; 5) The high fiscal deficit to GDP ratio for Russia in 2015 and 2016 was on account of the Russian financial crisis of 2014; 6) The Turkish currency and debt crisis 2018 led to a higher fiscal deficit to GDP ratio for Turkey in 2018 and 2019; 7) The Covid-19 crisis is expected to lead to an increase in the fiscal deficit to GDP ratio for all the 19 countries in 2020.
NOTES
1List of countries include Argentina (ARG), Australia (AUS), Brazil (BRA), Canada (CAN), China (CHN), France (FRA), Germany (DEU), India (IND), Indonesia (IDN), Italy (ITA), Japan (JPN), Korea (PRK), Mexico (MEX), Russia (RUS), Saudi Arabia (SAU), South Africa (ZAF), Turkey (TUR), United Kingdom (GBR), United States (USA). The EU has been excluded from the group, since its data was not available in the IMF Global debt database.
2Collectively, G20 members represent around 80% of the world’s economic output, two-thirds of global population and three-quarters of international trade (https://g20.org/en/about/Pages/whatis.aspx).
3In this paper, data for India pertains to fiscal year. For instance, 2020 implies FY21 covering the period April 2020 to March 2021.