Evaluation of Size Structure in Freshwater Cyanobacterial Populations: Methods to Quantify Risk Associated with Changes in Biomass and Microcystin Concentrations ()
1. Introduction
Many programs have been developed to evaluate and manage exposure to cyanotoxins in recreational waters and drinking water supplies. At the federal level risks in drinking water supplies are being assessed by the U.S. Environmental Protection Agency via the Unregulated Contaminant Monitoring Rule (UCMR) and managed according to a series of drinking water health advisories [1] . The assessment and management of recreational waters are being conducted according to draft recommendations [2] . Traditional methods rely upon cell counts and toxin analysis to initiate responses to protect human health, however it has been noted that these methods require expensive and time consuming laboratory analyses, potentially increasing the risk of exposure.
As such there is a great need for assessment techniques that provide critical information that is of high quality, timely, low cost, and supports initiation of preventive (rather than responsive) measures. Advances in technology have provided alternatives to traditional methods, ranging from site-specific fluorometric analysis to satellite surveillance. There appear to be challenges to these passive and automated approaches. In the evaluation of fluorometric applications [3] , it was noted that in-situ monitoring programs needed to account for species composition and growth, while an evaluation of satellite applications [4] revealed that routine field verification was needed to confirm algorithms. The continuing need for site-specific analysis providing information for management decisions has led to the development of qualitative and quantitative techniques. These include site specific models using environmental variables that influence the biomass of cyanobacteria [5] [6] , measurements of increased cyanobacteria and elevated microcystin concentrations [5] [6] [7] [8] [9] , and more specifically the influence of community structure on microcystin concentrations using light microscopy [8] [9] , cell counts [5] and qPCR [5] [7] .
The purpose of this study was to determine the influence of cyanobacterial population size and community structure on the toxigenicity profile using seasonal studies. We used light microscopy and fluorometric techniques to 1) conduct semi-quantitative analysis of the composition and relative abundance of bloom forming cyanobacteria, 2) quantitatively describe changes in community structure through the use of size fractionated samples and 3) provide estimates of growth and toxin content in cyanobacterial populations.
2. Materials and Methods
2.1. Studied Sites
There were seven surface water bodies that were included in this study located within the states of New Hampshire (Silver Lake and Lake Massabesic) and Massachusetts (Gooseberry Pond, Cliff pond, White Pond, Upper Mill Pond and Lower Mill Pond). Silver Lake in Hollis, NH (Latitude: 42.76˚N; Longitude: −71.59˚W) has a maximum depth of 2.7 m lake, is 16 ha in size and is used for swimming and recreational purposes. The lake has a history of cyanobacterial blooms. Lake Massabesic in Manchester, NH (Latitude: 42.97˚N; Longitude: −71.39˚W) has a maximum depth at the sampling site of 5.5 m, is 1040 ha in size and is used for drinking water purposes. Gooseberry Pond in Barnstable, MA (Latitude: 41.67˚N; Longitude: −70.34˚W) has a maximum depth 1.5 m, is 16.5 ha in size and is used for swimming and recreational purposes. Cliff Pond in Brewster, MA (Latitude: 41.75˚N; Longitude: −70.02˚W) has a maximum depth 25.9 m, is 82.5 ha in size and is used for swimming and recreational purposes. White Pond in Chatham, MA (Latitude: 41.69˚N; Longitude: −69.98˚W) has a maximum depth of 16.8 m, is 16.3 ha in size and is used for swimming and recreational purposes. Upper Mill Pond in Brewster, MA (Latitude: 41.73˚N; Longitude: −70.12˚W) has a maximum depth of 8.5 m, is 102.4 ha in size and is used for swimming and recreational purposes. Lower Mill Pond in Brewster, MA (Latitude: 41.73˚N; Longitude: −70.11˚W) has a maximum depth of 3.9 m, is 20.2 ha in size and is used for swimming and recreational purposes (Figure 1).
2.2. Sampling
All samples were collected as previously reported [9] where samples for analysis were collected on a bi-weekly or weekly basis from May-October 2018 from the deep site. An integrated whole lake water sample (WLW) was collected using a 13 mm I.D. clear weighted vinyl tubing lowered to 3 m depth, cinched, and pulled upwards from the bottom. On September 23, the WLW sample from Silver Lake was contaminated with sediment. The sample was dispensed into a 500 mL darkened amber bottle. Approximately 100 mL of the WLW sample was passed through a 53 um ring net, and the filtrate collected in a 125 ml darkened amber bottle. Subsamples were removed with a 5 ml pipette and placed into darkened microvials and frozen at −20˚C. Bloom forming cyanobacteria (BFC) isolates were collected as a vertical net plankton tow (NET), using a Students Plankton net (15 cm diam. 53 µm mesh), lowered to a 3 m depth and pulled upwards at a
![]()
Figure 1. Map of New England states showing general locations of New Hampshire (black) and Massachusetts (white) study sites.
rate of 0.5 m∙s−1. The BFC isolates were collected as shoreline horizontal tows at Gooseberry and Cliff Pond. The samples were processed [9] , placed into darkened 5 ml microvials and frozen at −20˚C.
2.3. Composition and Abundance of Bloom-Forming Cyanobacterial Populations
Bloom-forming cyanobacteria isolates were collected as previously described [9] , transferred to a darkened 5-ml microvial and gently mixed for 30 secs whereupon a subsample was removed with a 5 ml pipette and placed in a Sedgewick-Rafter counting cell. Qualitative analysis of the BFC isolate was conducted by scanning the entire sample to evaluate the composition of the BFC isolate by genus and noted. Quantitative analysis of the BFC isolate was conducted using a compound microscope set to 40X. The Sedgewick-Rafter slide was aligned to the first quadrant in the lower left hand corner and then moved vertically to the 5th quadrant. The Sedgewick-Rafter was then moved horizontally in a strip, and cyanobacteria in the quadrants counted up to a total of 100 observations. A single observation included any colony, filament, raft or fragment of the same [10] . Observations were noted as percent Microcystis spp. (%Mic) of the entire sample.
2.4. Fluorometric and Toxicological Analysis
Samples were prepared for fluorometric analysis as previously reported [9] . Phycocyanin concentrations were quantified using a two channel handheld Fluoroquik fluorometer (AmiScience FQD-PC-CHL/IV-RATIO-C) with phycocyanin (PC), excitation at 595 nm, emission at 670 nm, that was standardized using powder isolated from Spirulina platensis and spectrophotometrically (Abs615 = 0.339, Abs652 = 0.113) analyzed [11] . Samples were prepared for toxicological analysis as previously reported [9] . Toxin analysis for total microcystins (MC) was conducted using Envirologix EP-022-HS Quantiplate Kit for Detection of Microcystins-High Sensitivity: Low Level of Detection by ELISA plate = 100 pg∙mL−1 High Level of Detection by ELISA plate = 1200 pg∙mL−1. Readings were taken using a Bio-Tek Instruments Inc. El-800 Universal Microplate Reader Primary 450 nm Reference 630 nm and interpreted using KC Junior software. The standard curve was calculated in Sigma Plot using a 4 point logistic regression. Values for all size fractions (<50 µm and bloom forming cyanobacteria isolates) and whole lake water were reported as total microcystins representing dissolved + particulate microcystins.
2.5. Statistical Analysis
All samples collected during the study were used for fluorometric analysis of either phycocyanin (PC) or chlorophyll-a (Chl-a) except when the lowest level of detection (LoD < 1.0 µg∙L−1) was encountered. For untransformed data, the coefficient of variation (CV%) was calculated as the standard deviation divided by the mean, while for transformed data the CV% was calculated as the standard deviation. Data was log transformed as necessary to allow for parametric analysis. Studentized T-tests were used to determine if the means were significantly different from each other. One way analysis of variance (1-way ANOVA) was conducted to identify where differences existed between groups, and Tukey’s post-hoc comparisons conducted. Parametric analysis (Pearson’s correlation coefficients and linear regression analysis) and non-parametric analysis (Spearman’s correlation coefficients) were used to describe relationships between variables. For linear regression analysis and analysis of covariance (ANCOVA) autocorrelation (Durbin-Watson = 2.0), leverage (Studentized deleted residuals: SDR > 2) collinearity (VIF > 3), and influence (Cooks distance: Cd > 4/n and Difference in Fits: DFFits = 2 × sq.rt [(p + 1)/(n − p − 1)] where n = number of observations, p = number of variables (including the constant) were used. Log percent Microcystis (Log %Mic) was calculated from Log (All non-Microcystis spp./All cyanobacteria) based upon the first 100 observations. Cyanobacterial biomass growth rates were calculated from phycocyanin concentrations and net toxin production rates were calculated from total microcystins concentrations using the equation (lnPCt1 − lnPCt0)/(t1 − t0) and (lnMCt1 − lnMCt0)/(t1 − t0) respectively. Doubling times (DT) were calculated as 0.683/growth rate (µ). All statistical analyses were conducted using Sigma Plot Version 14 [12] .
3. Results
3.1. Variability of Cyanobacterial Biomass and Microcystin Concentrations
All of the lakes exhibited variability in the PC and MC concentrations in the WLW and BFC samples throughout the study period, typically characterized with non-synchronous temporal patterns and peaks (Supplemental Figures 1(A)-(G)). There were significant differences between the lakes by PC and MC concentration and sample type, where Upper Mill Pond and Lower Mill Pond consistently had higher PC and lower MC concentrations than other lakes in the study [WLW PC (H(6) = 44.993, p < 0.001), WLW MC (F(6) = 45.3319, p < 0.001), BFC PC (H(6) = 28.423, p < 0.001) and BFC MC (H(6) = 55.881, p < 0.001)] (Figures 2(A)-(D)). Between lakes the WLW PC sample (CV = 218%) was more variable than the BFC PC sample (CV = 188%), while the WLW MC sample (CV = 146%) was less variable than the BFC MC (CV = 204%) sample (Supplemental Table 1). During our study only one lake (Lower Mill Pond) consistently had Chl-a concentrations in the <50 µm and WLW sample above the acceptable detection limit of 1.0 µg∙L−1, therefore the BFC PC/Chl-a ratio was used to measure the relative dominance of cyanobacterial to all phytoplankton biomass in our samples throughout the study period. Concurrent maxima of cyanobacterial population metrics and cyanotoxins are summarized in Table 1.
3.2. Composition and Abundance of Bloom-Forming Cyanobacterial Populations
The study lakes were divided into three general groups according to the composition of the BFC populations, including three lakes (Silver Lake, Lake Massabesic
![]()
Table 1. Dates of concurrent maxima of cyanobacterial metrics observed during this study.
Shaded areas indicate surface scums and/or accumulations present.
![]()
Figure 2. (A-D) Box plots of phycocyanin and total microcystins in whole lake water (A-B) and bloom-forming cyanobacteria (C-D) in this study. Letters indicate where significant differences were observed. (Kruskal-Wallis ANOVA and Dunn’s Method, p < 0.05 with log transformed data).
and Gooseberry Pond) consisting of Microcystis spp. (MIC), two lakes (Cliff Pond and White Pond) consisting of Microcystis and Dolichospermum mixed assemblages (MIXED) and two lakes (Upper Mill Pond and Lower Mill Pond) consisting of Dolichospermum spp. (DOLI). In the MIC lakes, Microcystis spp. was dominant (%MIC = 99) during the entire study period with the exception of two (of twelve) sampling dates in Gooseberry Pond (July 30 and Aug 6: %MIC = 40). In the DOLI lakes, Dolichospermum spp. was dominant (%MIC = 1) during the entire study period with the exception of one (of twelve) sampling dates in Upper Mill Pond (Sep 11: %MIC = 4) and three (of seven) sampling dates in Lower Mill Pond (Sep 25: %MIC = 5, Oct 2: %MIC = 4 and Oct 9: %MIC = 9). The exceptional MIC and DOLI data were combined with the MIXED data. In the MIXED lakes, the %MIC ranged from 2 - 98, with the exception of four of six sampling dates in White Pond where Woronichinia or Gloeotrichia was observed in small quantities. Overall, the bloom-forming cyanobacterial populations in the study lakes were composed of Microcystis spp. (42%), mixed assemblages of Microcystis/Dolichospermum (36%) and Dolichospermum spp. (22%).
3.3. Relationships between Community Structure, Cyanobacterial Biomass and Total Microcystin Concentration
In the MIC lakes, positive linear relationships and correlations between cyanobacterial biomass (Log PC) and microcystin concentrations (Log MC) were observed in Silver Lake, Gooseberry Pond and Lake Massabesic. In the DOLI lakes, positive linear relationships were observed in Upper Mill Pond and Lower Mill Pond. In the MIXED lakes, there was a positive correlation between Log PC and Log MC (Table 2). Where linear relationships existed (Figure 3), ANCOVA indicated significant interactions between phycocyanin and Microcystis spp. abundance in both the MIC (F1,49 = 4.411, p = 0.041) and DOLI (F1,35 = 6.964, p = 0.012) lakes, therefore genus-specific data could not be combined. We used forward stepwise and multiple linear regression analysis to investigate the influence of cyanobacterial community structure (Log %Mic) and biomass (Log PC) on total microcystin concentration (Log MC) for the entire dataset (Supplemental Figure 2(A)). The most influential variable, Log %Mic (beta 0.7381) (F(1, 194) =
![]()
Table 2. Regression and correlation coefficients between cyanobacterial biomass and total microcystins in Microcystis spp., mixed assemblages, and Dolichospermum spp. dominated systems, where LogY = a + b × LogX where Y = Log MC (ng∙L−1) and X = Log PC (µg∙L−1).
![]()
Figure 3. Graph showing the linear regressions (solid lines) and Spearman’s rank correlation (dotted lines) between phycocyanin and total microcystins at sites denoted as MIC (triangles), MIXED (squares), and DOLI (diamonds).
105.42, p < 0.001), explained 34.9% of the variability in the total microcystin concentration. Inclusion of the second independent variable, Log PC (beta 0.6831), into the model (F(2, 193) = 346.51, p < 0.001) explained 78.0% of the variability in the total microcystin concentration (Table 2). An evaluation of population size structure (Supplementals Figure 2(B)-(D)
3.4. Relationship between Cyanobacterial Biomass Growth and Microcystin Net Production
Linear regression and correlation analyses were used to evaluate the relationship between the growth rate (µ) and microcystin net production rates (r) in the Microcystis spp. and Dolichospermum spp. dominated lakes. In the BFC population of the three Microcystis spp. dominated lakes a positive correlation was observed, while in two of these lakes (ANCOVA F(1(20) = 0.218, p = 0.645) a linear relationship was observed (Table 4, Figure 4). In contrast, a significant negative correlation was observed in both Dolichospermum spp. dominated lakes (Table 4). In the WLW, growth of the populations exhibited either a weak positive (Microcystis spp.) or negative (Dolichospermum spp.) influence on microcystin production (Table 4).
In the populations that were <50 µm in size, there were weak positive correlations between growth and microcystin production for both Microcystis spp. and Dolichospermum spp. During the course of the study, we observed a range of negative and positive values for the growth rates and net toxin production rates. Maximum growth rates in the <50 µm (MIC µ = 0.089 d−1, DOLI µ = 0.212 d−1),
![]()
Table 3. Correlation coefficients between community structure, phycocyanin and microcystin concentrations for size fractionated samples (<50 µm, n = 61, WLW n = 65, BFC n = 70). Boldface indicates significant correlations.
![]()
Table 4. Regression and correlation coefficients between rates of cyanobacterial biomass growth and net microcystin production in Microcystis spp. and Dolichospermum spp. dominated systems, where Y = a + b × X where Y = Net toxin production rate (r) and X = Biomass growth rate (µ). Dark letters identify significant relationships.
a = Silver Lake, Lake Massabesic and Gooseberry Pond; b = Silver Lake and Lake Massabesic.
![]()
Figure 4. Graph of the linear relationship between cyanobacterial growth rate and net toxin production in two MIC lakes (dark circles) in this study.
WLW (MIC µ = 0.154 d−1, DOLI µ = 0.140 d−1) and BFC samples (MIC µ = 1.095 d−1, DOLI µ = 0.234 d−1) and net toxin production rates in the <50 µm (MIC r = 0.034 d−1, DOLI r = 0.049 d−1), WLW (MIC r = 0.032 d−1, DOLI r = 0.0009 d−1) and BFC (MIC r = 0.723 d−1, DOLI r = 0.138 d−1) samples were observed. The percentage of positive growth rates < 0.10 d−1 was higher than growth rates > 0.10 d−1 in both Microcystis spp. and Dolichospermum spp. for all size fractions (Supplemental Figure 3). In Silver Lake when the WLW MC equaled 0.350 µg∙L−1 on Sept. 23, the 7 day preceding growth rate was 0.15 d−1 (potentially higher due to sediment contamination). In Lake Massabesic when the WLW MC equaled 0.21 µg∙L−1 on Sept. 7, the 7 day preceding growth rate was 0.01 d−1. In Gooseberry Pond when the WLW MC equaled 0.63 µg∙L−1 on July 9, the 7 day preceding growth rate was 0.04 d−1.
4. Discussion
4.1. Relationships between Community Structure, Cyanobacterial Biomass and Total Microcystin Concentration
Many studies have been conducted that describe cyanobacterial populations [13] and biotoxin concentrations [6] [8] [14] [15] using the photopigment phycocyanin [5] [7] [9] . Our analysis included composition of the cyanobacterial biomass, as this variable appears to influence MC concentrations [9] . In this study of lakes with “field monocultures” of Microcystis spp. we observed causative relationships and a highly significant positive correlation during the study period (Table 2). In Silver Lake and Gooseberry Pond, the PC concentration explained 94.2% and 79.1% of the variability in the MC concentrations, respectively. In Lake Massabesic, increased concentrations of PC and MC were associated with each other (rs = 0.818, n = 26, p < 0.001). A slightly stronger correlation between the variables was observed in Maumee Bay (rs = 0.85, n = 24, p < 0.05) where Microcystis spp. represented 93% and 91% of the median and maximum cyanobacterial biovolume respectively and a standardized coefficient of 0.6799 was reported [5] . Within the mixed assemblages in this study, the observation of a positive correlation between cyanobacterial biomass and microcystin concentration (rs = 0.627, n = 71, p < 0.001) (Table 2) was similar to those previously reported [9] in Lake Attitash (r = 0.901, n = 30, p < 0.001), and the mid-west in Lake Erie (rs = 0.7633, n = 45 p < 0.001) and Western Basin (rs = 0.6274, n = 25 p < 0.001) using similar methods [7] . In Lake Harsha using in-situ monitoring, where Microcystis spp. was detected 76% of the time, stronger correlations were observed (rs = 0.930, n = 17, p < 0.005) [5] . In this study of lakes with “field monocultures” of Dolichospermum spp. we observed causative relationships between PC and MC with regression coefficients (Table 2) similar to those reported for Lake Cochichewick, an Aphanizomenon spp. dominated system [9] . The low MC concentrations we observed in Dolichospermum spp. are in contrast to those reported [16] , however they are consistent with other studies that associate this genus with saxitoxins [8] or concerns related to peak biomass events [6] .
During this study, the two lakes dominated by Dolichospermum spp. consistently had higher PC and lower MC concentrations than all other lakes (Figure 2(A) & Figure 2(B)), while lower PC and higher MC concentrations were associated with the three lakes dominated by Microcystis spp., reflected in the unique slopes, intercepts and correlation coefficients (Table 2). The increased dominance of Microcystis spp. was correlated with increased MC concentrations (Table 3), as previously documented in field studies [5] [13] . In addition, negative correlations existed between Log PC: Log MC for the <50 µm and WLW samples, while the relative dominance of Microcystis spp. (Log PC: Log %Mic) supported similar observations for all size fractions (Table 3). Somewhat similar results with photopigments appear to have been previously observed [5] where the lines of best fit for the phycocyanin (RFU) and microcystin (µg∙L−1) scatterplots from Maumee Bay State Park (MBSP) and Lake Harsha (Microcystis spp. maximum 91% and 41% respectively) depict a steeper slope and lower intercept in MBSP than Lake Harsha. Pip and Bowman [17] reported overall positive correlations between photopigments and microcystins with community composition (Anabaena, Aphanizomenon and Microcystis spp.) influencing the line of best fit. During their two year seasonal studies in Lake Winnipeg, within each season, Chl-a and MC remained positively correlated (r = 0.67, p < 0.001), however lower mean chlorophyll was associated with higher mean microcystin in 2010 while in 2011 the reverse was observed. Our analysis suggests that genus dependent “fingerprinting” could have influenced the observed differences in photopigment content. There are several fluorescent accessory pigments (phycocyanin, phycoerythrocyanin and phycoerythrin) that can be found in morphologically distinct cyanobacteria [18] [19] [20] optimizing photosynthetic functionality [21] whereby the process of chromatic acclimation can result in proportional redistribution of the pigments [22] [23] . These findings have been confirmed and refined using genetic analysis [24] [25] [26] , which support previous observations made during controlled growth experiments [27] [28] . Chang [27] demonstrated four-fold genus dependent differences in phycocyanin cell content where A. circinalis [19] [26] ranged from 0.01 - 0.0175 RFU/cell and M. aeruginosa [26] ranged from 0.0025 - 0.0045 RFU/cell. Macario [28] demonstrated clear variation of phycocyanin content per cell using C. raciborskii, N. muscorum and M. aeruginosa, where M aeruginosa [26] had the lowest value (2 µg∙L−1 per 20,000 cells) by two-fold to N. muscorum [19] [26] and three-fold to C. raciborskii [24] . As part of this study, concentrations of phycoerythrin (RFU’s) were evaluated in samples from Microcystis spp. dominant Silver Lake and Dolichospermum spp. dominant Lower Mill Pond (data not shown). The proportions of the accessory pigments phycocyanin and phycoerythrin (and possibly phycoerythrocyanin) appear to explain our results of genus-specific linear regressions and correlations. Further investigation into the relationship between cyanobacterial community structure, photopigments (primary and accessory) and microcystin concentrations could reveal value-added applications of fluorometric analysis.
To refine our analysis multiple linear regression was employed to quantify the influence of community structure and proliferation of cyanobacterial biomass on toxigenicity. Previous studies [5] [6] [8] have used multivariate screening models with “if-then” criteria to estimate the growth of cyanobacterial biomass and increase in microcystin concentrations. Both Recknagel [6] and Newcombe [8] considered environmental variables that influenced the growth (measured by cell counts and proliferation rates) of the “buoyant bloom formers” [8] Microcystis spp. and Anabaena spp. to prioritize risk, being associated with cell quotas and measured concentrations of cyanotoxins. In the study to develop three multi-variate predictive models [5] risk was associated with cyanobacterial (Model #1, beta 0.6799), genus-specific (Model #2, beta 0.4781) and toxigenic presence (Model #3, beta 0.5081). In the previous applications, it was not noted whether relative abundance was considered as a variable. In our study, the most influential variable in the multivariate predictive model was cyanobacterial community structure (Log%Mic) (beta 0.7381) followed by biomass (Log PC) (beta 0.6831). By using this metric as an input variable the influence of community structure on microcystin concentrations can potentially be accounted for [6] , as mixed assemblages are commonly encountered [5] [7] [9] [15] [27] .
4.2. Relationship of Cyanobacterial Biomass Growth and Microcystin Net Production
The observed relationships between biomass growth rates and toxin production rates highlight morphometric and compositional risk associated with cyanobacterial populations (Table 4). Previous studies of Microcystis spp. have demonstrated this causative relationship both in cultures [29] [30] [31] and field studies [13] [32] . The regression parameters from these studies are similar to our findings (slopes close to 1 and intercepts close to 0), suggesting that both cell counts and PC concentrations may be used to quantify cyanobacterial biomass. This has been demonstrated where continuous monitoring of PC (RFU’s) to identify periods of growth as 7 day and 14 day moving averages [5] were highly correlated (7 day rs = 0.98, 14 day rs = 1.00) with MC concentrations in Lake Erie. Other studies have used environmental factors to identify the hierarchical potential for growth of cyanobacterial biomass and increase in cyanotoxins, including phosphorus/chlorophyll-a [8] and water temperature/turbidity [6] . Our findings demonstrated that within the Dolichospermum spp. populations the process of growth, while increasing the biomass, did not increase the potential for exposure to microcystins as there were negative correlations in the WLW and BFC samples and weak positive correlations in the <50 µm sample. (Table 4). Conversely, within the Microcystis spp. populations, and most significantly in the BFC’s, the process of growth did increase the potential for exposure to microcystins, highlighting the important role of changes in Microcystis spp. population size structure (Table 4). Our findings demonstrated that the biosynthesis of microcystins occurred in both populations, exhibiting a constitutive role [29] in the Microcystis spp. populations while potentially functioning as a low-level siderophore [33] in the Dolichospermum spp. populations. Within this study, we did not attempt to discriminate between toxic and non-toxic Microcystis spp. however evaluation of the temporal patterns of growth and net toxin production rates in these lakes (not shown) suggested that these populations were limited by the carrying capacity of the systems, and succession of non-toxic Microcystis populations [34] [35] [36] did not occur. Based upon our results we could anticipate that in future investigations involving Microcystis spp., non-toxic forms may exhibit correlation coefficients similar to those observed in the Dolichospermum spp. populations.
We observed a range of positive and negative growth and net toxin production rates (Supplemental Table 2) which could be attributed to factors such as environmental variables, biosynthetic and catabolic pathways and biotic influences. This was anticipated as previous studies have reported of thirty-six (36) positive and thirty-four (34) negative values [13] [29] [37] , and all positive values [6] [31] [32] [38] [39] . This has led to several quantitative methods to assess the potential of exposure to cyanobacteria and associated toxins, using similar assumptions regarding critical rates of µ = 0.3 d−1 [32] and µ = 0.2 d−1 [6] . While we observed similar ranges for positive rates, during our study whole lake water maxima or concentrations greater than 0.3 µg∙L−1 MC were observed when growth rates were substantially lower than those contemplated by other authors. Additional evaluation of cyanobacterial growth rates under varying conditions could provide empirically derived critical values.
5. Conclusion
The seasonal evaluation of compositionally and morphologically diverse cyanobacterial populations demonstrated that measures of composition, size structure and biomass could be used to estimate microcystin concentrations through linear regression techniques. Genus-specific toxigenic profiles, influenced by photopigment content, demonstrated that dominance of Dolichospermum spp. implies accumulation of biomass, while dominance of Microcystis spp. implies increased microcystin concentrations. Additional cyanobacterial accessory pigments, phycoerythrin and phycoerythrocyanin, may influence these findings and expand our understanding of population dynamics and cyanotoxin production. Concentrations of the bloom-forming cyanobacterial accessory photopigment phycocyanin were used to describe the critical process of growth and confirm the linear relationship with microcystin net production, both increasing at an exponential daily rate. Using simple evaluative techniques (light microscopy and fluorometry) new metrics to quantify cyanobacterial populations have been developed which can be used by the regulated and non-regulated community. Application of the metrics in additional freshwater systems should be conducted to affirm and/or refine the results we obtained.
Acknowledgements
We thank the following for assistance in sample collection and fluorometric analysis of field samples for this project including the Brewster Ponds Coalition, Association to Preserve Cape Cod, Town of Barnstable, MA and Manchester Water Works, Manchester, NH. Laboratory facilities were kindly provided by the University of New Hampshire-College of Life Sciences and Agriculture. Partial funding was provided by the New Hampshire Agricultural Experiment Station. This is Scientific Contribution Number 2817. This work is/was supported by the USDA National Institute of Food and Agriculture Hatch/Evans-Allen/McIntire-Stennis Project 1007227.
Supplemental Tables and Figures
Supplemental Table 1. Mean, minimum, maximum and coefficient of variation (CV %) of cyanobacterial biomass (µg∙L−1) and microcystin concentrations (µg∙L−1) in lakes studied from June to October 2018.
Supplemental Table 2. Biomass growth rates (µ∙d−1), net microcystin production rates (r∙d−1) and toxin production (MC/PC ng∙µg−1) in < 50 micron, whole lake water and bloom-forming cyanobacteria samples in Microcystis spp. and Dolichospermum spp. dominated lakes during the entire study period.
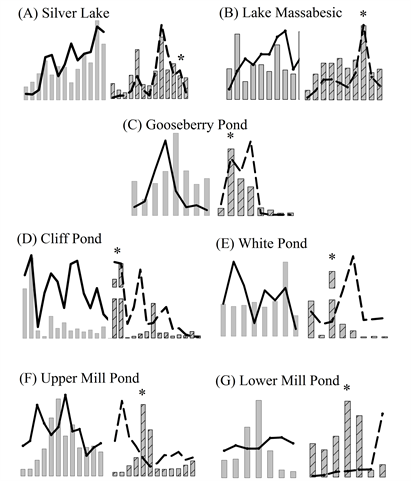
Supplemental Figure 1. (A-G) Plots of cyanobacterial biomass (bars) and total microcystins (lines) in whole lake water (left) and bloom-forming cyanobacterial (right) samples from this study. Asterisk (*) indicates maximum BFC PC/Chl-a ratio.
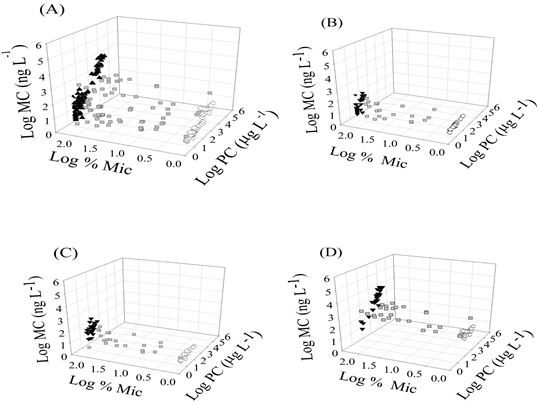
Supplemental Figure 2. (A-D) Graphs depicting the relationships between cyanobacterial community structure (Log %MIC), phycocyanin (Log PC) and total microcystins (Log MC) in all of the lakes in this study (5A) and within the size fractions <50 µm (5B), whole lake water (5C) and bloom –forming cyanobacteria (5D). Composition denoted as MIC (black triangles), MIXED (gray squares) and DOLI (white diamonds).
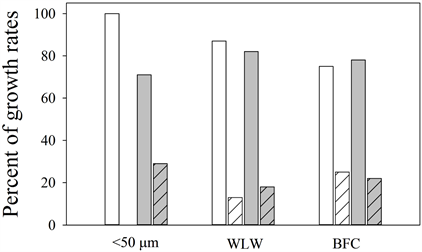
Supplemental Figure 3. Bar graphs of percent of positive growth rates (µ) <0.1 d−1 (solid) and >0.1 d−1 (hatched) in Microcystis spp. (white) and Dolichospermum spp. (gray) populations during this study.