An Online Productivity Measuring and Analyzing System: Proof-of-Concept ()
1. Introduction
The rapid pace of globalization resulting from free flow of trade and capital around the globe has intensified the competition among nations. This is after the implementation of new and updated trade agreements that emphasized openness and competition. Firms that enjoy competitive advantage are the winners in today’s economic arena. However, firms which are lacking in-part any competitive advantage will be under the mercy of foreign aids and are threatened to lose their independence. These firms will be also subject to all kinds of disorder and political unrest. Therefore, competition (high level of productivity growth) is the name of the game that any firm must strive to win it.
Productivity on the other hand, is the major contributor to competitiveness and can be taken as an indication of the firm’s ability to stay in line with new economic order and survive in face of the international harsh competition. Competitiveness and productivity, however, remained a neglected issue for some firms. This negligence is due to that these firms are getting some types of government subsidies to enable them to continue with their poor level of productivity growth. Thus, the heat of competition in the world economy has not yet been felted. Thus, given the new state of globalization, producers and industries need to continuously improve their competitiveness/productivity in the local and international markets. There are a number of arguments which support the view that productivity measurement and analysis are of particular importance to the future survival [1] .
Productivity2 growth is considered to be one of the major factors contributing to overall economic growth. It is also an important key to enhance competitiveness at all economic levels (i.e., economy, economic sector, industry, firm and/or farm). This research comes at a very critical stage where cut-throat competition in world trade endangers the economic stability and survival of many firms. It comes to address the analytical measurement issues with respect to the decompositions of the output growth and of the partial productivity measure, i.e. labour productivity.
Thus, I am building up an online productivity measuring and analyzing system: Proof-of-Concept to measure and analyze the output, production factors, multifactor productivity, single (i.e., labor and capital) productivity growth rates. In addition, it investigates the interrelationship between economic, labor productivity, and multifactor productivity at both firm and ISIC 2-digit industry levels. This research has the following folds:
1) to provide an instant report that investigates the competitiveness of a firm as measured by its productivity and compared to its industry, using time series data.
2) using one-year loss/profit sheet to provide an instant report that investigates the competitiveness of a firm as measured by its productivity and compared to its industry.
3) to provide some recommendations that would help firms’ official (decisions makers) to improve the performance of his/her firm within its related industry and increase its productivity and competitiveness.
4) Researcher also could utilize the facilities and get an instant measurement of productivity growth rate as they upload their data file.
This study is organized in the following way. Section 2 presents an overview on Productivity Studies. The Productivity Measurement Methodology is discussed in Section 3. Section 4 shows the required data set for the production function based empirical model. Section 5 presents the technical based as proof-of-concept for proposed the Online Productivity Measuring and Analyzing System. Overall Remarks and Future works are stated in Section 6.
2. Productivity Studies: An Overview
Analytically, the problems of productivity and economic growth measurements have been overcome by the recent developments in productivity measurement models, [2] . One of these developments is the application of aggregation and index number theories that are exploited in productivity studies. The development of econometric specifications and the use of more “flexible” functional forms in estimation of the underlying production technology are also regarded as important advances utilized by productivity studies. Therefore, it is needless to say that the decomposition of multifactor productivity has encouraged recent efforts to modify the standard “traditional” accounting type measure of economic performance indicators and especially that of productivity growth [3] .
Productivity is generally defined in terms of an efficient use of a given level of the factors of production to be transformed into the highest possible level of output. The single-factor productivity measure, expressing output as a ratio of a single production factor, has the advantage of simplicity of calculation. However, if a single-factor measure of productivity improves, it may not necessarily be the case that the overall productivity has improved. The single-factor productivity, say labor productivity, also has some disadvantages which it generates serious interpretation problems. These problems may be summarized as: 1) the difficulty of identifying the causal factor which is responsible for the growth of inputs and/or output; and 2) it does not reflect overall productivity change which is an important key element for the competitiveness of the industry (or firm) under consideration.
The index number measurement approach to productivity growth is one of the most common approaches in productivity studies. It is based on construction of a ratio of aggregated unit of output divided by the quantity of a single input (labor). This measure is usually normalized to a base period of time. Furthermore, under the assumption of constant returns to scale and Hicks neutrality of technological change, production technology could be presented in an index-number framework.
The economic theory of index numbers and aggregation (such as the Divisa and Tornqvist indices) has contributed significantly to the development of the growth accounting approach. Economic index number theory has been exploited to compute an index of productivity growth. The simplicity of this measure is a result of several strong assumptions that have been imposed in its derivation.
The research works on the theory of the exact and superlative index numbers have overcome many measurement and interpretation issues in output and input aggregations. It followed that another important development in productivity measurement has been made in the context of the index number approach. Researchers had extended this approach to incorporate and identify a number of economic factors which might affect firm behavior and productivity growth [4] .
It is worth noting that the implicit or sometimes explicit assumption that production factors are instantaneously adjusted in the short-run is another distinct area of the most recent development in productivity measurements. This assumption implies that all production factors are fully utilized. Another implicit assumption that productivity studies usually make is that all producers are technically efficient. The assumptions underlying the use of this approach are constant returns to scale of the underlying production technology, competitive equilibrium in both output and inputs markets and Hicks neutrality of technological change. It also implicitly assumes instantaneous adjustment of the quantities of inputs―all production factors are fully utilized and all producers are technically (cost) efficient.
It follows that the measure of productivity should be regarded as a composed measure of a number of economic behaviors that are important pieces of the overall economic performance puzzle. Identifying and measuring these components of overall productivity help to provide a more accurate and interpretable measure of economic performance. That is, the observed change in overall productivity (residual) could be a result of various economic interactions in the production process, including technical change, scale economies, and changes in capacity utilization and inefficiency3. However, due to unavailability of the necessary data for a firm/industry, a full structural model that takes into account the contribution of the major components of the overall productivity change would not be possible to be utilized. A relatively simple (restricted)4 model will be utilized in measuring and analyzing multifactor productivity and labor productivity growth rates. This simple method could be used in case studies of other countries given the similar data limitation.
3. Productivity Measurement Methodology
For the simplistic understanding a restricted5 growth accounting model is used in measuring and analyzing productivity growth. A growth accounting method is used in deriving the measurement model of output, MFP, and labor productivity growth rates. Conceptually, MFP indicates the change in output resulting from the shift of the production function. On the other hand, changes in inputs indicate that the change in output results from movements along the production function. Thus, given the main approaches in productivity and production modelling, the gross output approach is exploited in this study [5] . This complies with the fact that an analysis of productivity change in an open economy must be based on production function that contain all primary inputs (labor and capital) in addition to the intermediate inputs [6] .
The general form of the firm/industry-level production function can be written as:
(1)
where Qt is the real output, At is the index of MFP (technical change), Kt is the inputs of the capital services (flow), Lt is the labor inputs, Et is the energy inputs, and Mt is the intermediate inputs, all in time period t.
Thus, differentiating the production function (1) with respect to time gives the growth equation, which can be written as:
(2)
This Equation (2) shows the rate of change of output as a sum of the rate of change in the MFP [(dA/dt)/A] and the weighted average of the rate of change in use of inputs.
Exploiting the models’ underlying assumptions, Equation (2) can reproduced as:
(3)
where Si = Xi/PQQ, where i = K, L, and M, Xi is the total payment to input (i), and PQ is the price of output (Q). The model’s assumptions also imply that the weights (shares) sum up to one that is [SK + SL + SE + SM = 1].
Equation (3) is known as the Divisia index, with an index number framework and taking the (log) for the inputs and output index and with using the average inputs share, we can get the approximation of the Tornqvist index number as [7] :
(4)
where:
It follows that MFP growth rate can be presented as:
(5)
This shows that MFP can be seen as the growth rate of output over and above the growth rate of all inputs6.
It follows that the relationship between the labor productivity and sources of its growth could be easily obtained and illustrated. The average labor productivity (LP) is defined as the ratio of total output to labor input (Q/L). This average dependent on two factors:
1) the shift in production function; and
2) the intensities of other (not labor) inputs.
Now, let the average labor shares of output and each inputs be defined as follows:
1) qt = Qt/Lt; the average output per unit of labor
2) kt = Kt/Lt; the average capital input per unit of labor
3) et = Et/Lt; the average energy input per unit of labor
4) mt = Mt/Lt; the average intermediate inputs per unit of labor
Then, the growth rate of labor productivity (LP) can be computed as the sum of the growth rate of MFP and the weighted growth rate of labor-factor (input) intensity, LFI.
(6)
This shows that labor productivity growth rate can be seen as the growth rate of MFP over and above the growth rate of labor factor Intensities (LFI).
4. Data Required for the (OPMAS)
Output (Q): Output is measured in physical or real values. For products to be regarded as a homogeneous commodity (production in physical units) certain conditions should be satisfied. In this study, output is equal to the summation of the real values of the produced output.
Capital (K): The most preferred measure of capital input for productivity analysis is the flow of capital services used. The flow of capital services, which should in principle include the value, at current replacement cost, of the reproducible fixed assets used up during the year as a result of normal wear and tear. In practice, however, data are generally not available in the details required for the estimation of capital flow [8] . In this study the capital depreciation (in real terms) would be used as a measure of the flow of the capital service7.
Labor (L): The number of persons employed is defined as the total number of persons who work in the establishment. Compensation is defined as comprising of all payments, both in cash and in kind. In this study the real value of compensation is used as a measure of labor input to take into account the difference in skill among workers assuming that there is a strong relationship between wages and the workers’ level of skill and experience.
Energy (E): Energy is measured in physical or real values. In this study, energy is equal to the summation of the real values of the energy and energy-related inputs.
Intermediate-inputs (M): Intermediate-inputs are defined as equal to the real value of all production inputs, however, excluding the cost of labor (L), capital (K), and energy (E) inputs.
5. The (OPMAS) System Architecture/Design
As an implantation to the above productivity measurement and decomposing model, an Online Productivity Measuring and Analyzing System has been constructed for two use cases; time-series data and profit/loss statements (balance sheet) [9] .
The core model’s calculations of the OPMAS are implemented using Python; Python is a programming language works up more quickly and integrates to other systems more effectively for any scope of data analysis. However, the server-side programming language “PHP” was utilized for dynamic rendering of the data and the model’s reporting including the empirical results, tabulation, and imaging. Furthermore, for user (client)-side programming language, the HTML and JavaScript were utilized for an online user-friendly web-based interface. Diagram 1 shows the system architecture of the Online Productivity Measuring and Analyzing System, OPMAS.
5.1. The OPMAS: Use Cases
Reference to the System architecture of the Online Productivity Measuring and Analyzing System (Diagram 1), there multiple (group) of users. This section presents the available use cases in the OPMAS.
Diagram 2 is showing the different possible users of the OPMAS. Reference to Diagram 2, users could be classified into three sorts:
1) non-registered non-member users. These users would be asked to register
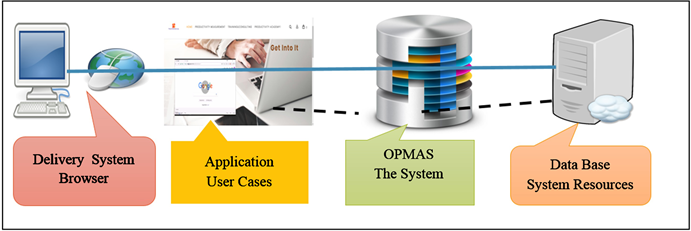
Diagram 1. OPMAS―system architecture.
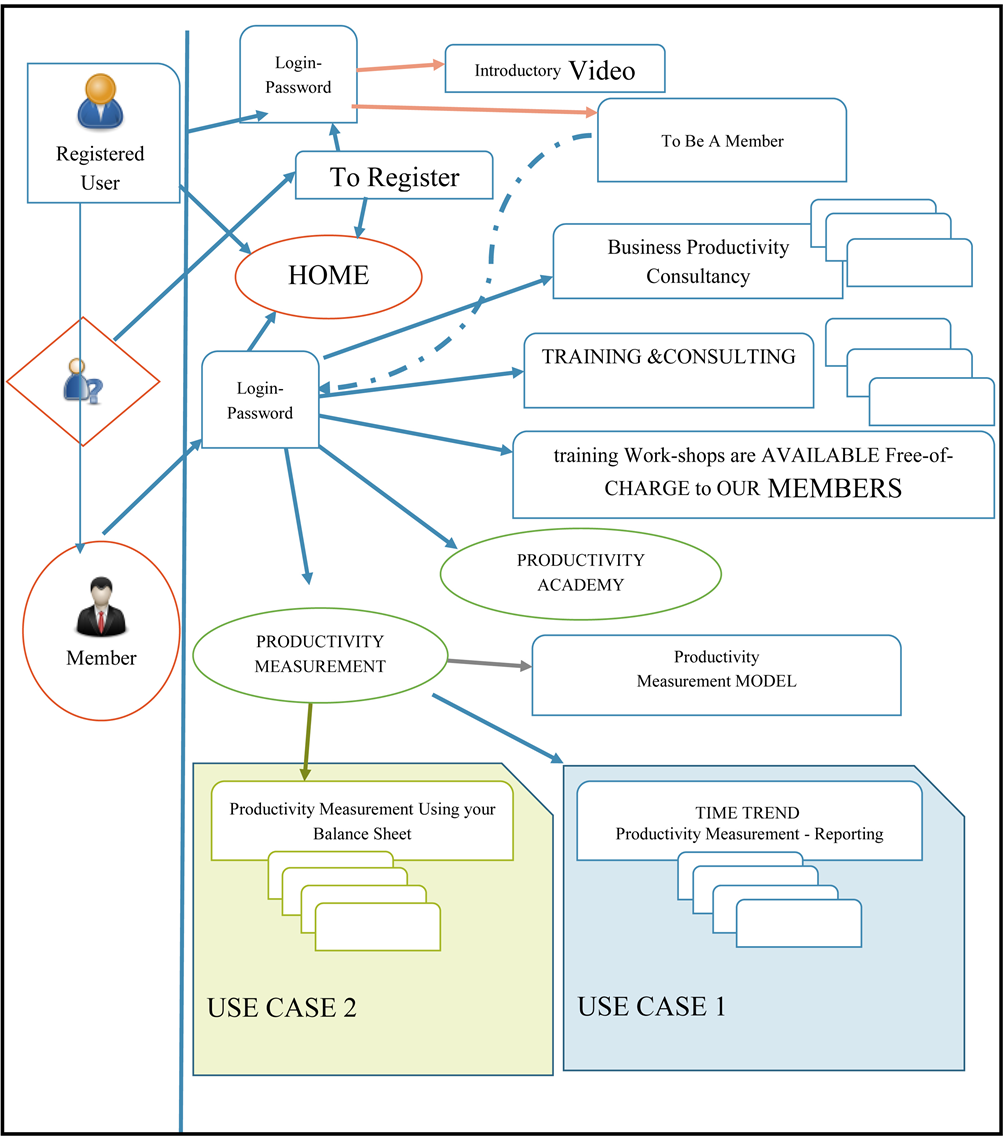
Diagram 2. The OPMAS: use cases.
to access the basic available services, i.e. the home page,
2) registered but non-member users. These users are having access to the basic available services, with an option to become members, and
3) member users. These users are having full access to the available services and to benefit from the Online Productivity Measuring and Analyzing System.
Also, it is clearly shown in Diagram 2 that there are two use cases for members. These two use cases are; 1) “time-series” Online Productivity Measuring and Analyzing; and 2) “Static One-year” Online Productivity Measuring and Analyzing. These two cases are detailed and illustrated, respectively, in the use cases below.
5.2. OPMAS: Use Case 1―Time-Series Online Productivity Measuring and Analyzing
This use case 1 is linked to the “time series” online productivity measuring and analyzing sub-system, as it is shown in the Diagram 2. Chart 1 shows that in use case 1, the user has to provide the system with the basic data which it needs to be filled-in using the system-dropdown menu. This basic data would include the following:
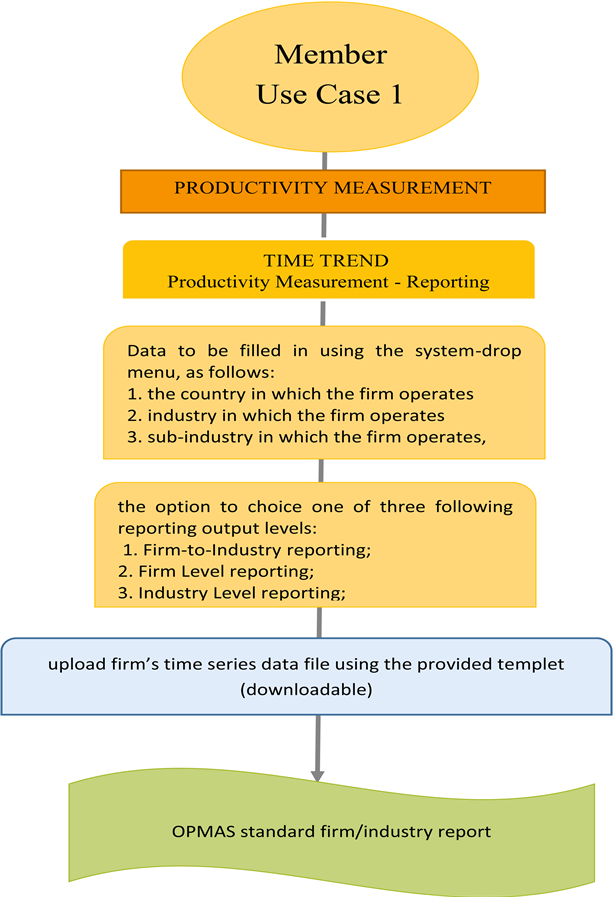
Chart 1. Time-series online productivity measuring.
1) the country in which the firm operates, for example, “Kuwait”
2) industry in which the firm operates, i.e., “Manufacturing, (D-Digit SIC)”
3) sub-industry in which the firm operates, for example, “Manufacturing of chemical and chemical products, (2-Digit SIC)”
Then, as it is also shown in Chart 1 that the user in use case 1 would also have the option to choice one of following three reporting levels:
1) Firm-to-Industry reporting;
this option would be selected by the user if he/she would like to relate the performance of his/her firm to the industry (economic sector) in which it operates,
2) Firm Level reporting;
this option would be selected by the user if he/she would like to know the performance of his/her firm only with no relation or comparison to the industry (economic sector) in which it operates, and/or
3) Industry Level reporting; this option would be selected by the user if he/she would like to know the performance of the industry (economic sector) in which it operates only.
Once the basic information is keyed-in, the user would be asked to upload the firm’s time series data file8 if he/she did select any of options 1 or 2 above. It follows that as the required time series data file has been up-loaded, the basic model would be applied to measure the growth rates of output, labor productivity, multi-factor productivity (MFP), and factor intensities in a Firm and industry. The results would be presented in two subtitles;
1) output growth and its sources of growth
2) labor productivity growth and the sources of its growth.
It follows that the OPMAS would produce its standard firm/industry repot as show in Figure 1. This OPMAS report includes two tables and seven self-explanatory charts. The first table (Table 1) of the OPMAS report would be showing a time-series decomposing of the annual gross output growth rate; the annual growth rate of the Multifactor productivity (MFP) and the annual growth rate of the factor intensity (FI) over the selected time periods for the firm. Table 1 also shows the annual average growth rates for the gross output and its main fragments; the Multifactor productivity (MFP) and the factor intensity (FI) over the selected time periods at firm and industry levels.
The second table (Table 2) of the OPMAS reporting would be showing the Decomposing of Labor Productivity Growth Rate; the annual and the average growth rate of the Multifactor productivity (MFP) and the annual and average growth rate of the labor-factors intensity (LFI) over the selected time periods for the firm. The second table also shows the annual average growth rates Multifactor productivity (MFP) and labor-factors intensity (LFI) at the industry level. For clear visual presentation these two tables are presented graphical into two Charts; Chart 1: Decomposing of Gross Output Growth Rate Chart 2: Decomposing of Labor Productivity Growth Rate.
![]()
![]()
![]()
Figure 1. Time-series online productivity reporting.
Furthermore, the OPMAS report includes addition five Charts to present clear comparison between firm and industry performance as listed below:
Chart 3: Annual Growth Rate of Multifactor productivity; It presents the annual assessments/comparison of the firm’s annual growth rate of MFP relative to the annual growth rate of MFP of Kuwait Manufacture of chemical and chemical products of over the me period.
Chart 4: Annual Growth Rate of Factor-Intensity; It presents the year-by-year assessments/comparison of the firm’s annual growth rate of FI relative to the annual growth rate of FI of Kuwait Manufacture of chemical and chemical products of over the me period.
Chart 5: Annual Growth Rate of Gross Output; It presents the year-by-year assessments/comparison of the firm’s annual growth rate of Gross Output relative to the annual growth rate of Gross Output of Kuwait Manufacture of chemical and chemical products of over the time period.
Chart 6: Annual Growth Rate of Labor Productivity; It presents the year-by-year assessments/comparison of the firm’s annual growth rate of LP relative to the annual growth rate of LP of Kuwait Manufacture of chemical and chemical products of over the me period.
Chart 7: Annual Growth Rate of Labor Factor-Intensity; It presents the yearly assessments and comparison of the firm’s annual growth rate of LFI relative to the annual growth rate of LFI of Kuwait Manufacture of chemical and chemical products of over the me period.
5.3. OPMAS: Use Case 2―Static One-year Online Productivity Measuring and Analyzing
The use case 2 is the “one-time period” subsystem of the online productivity measuring and analyzing sub-system, as it is shown in the Diagram 2. In Chart 2, the use case 2 is illustrated. It shows that for use case 2, users have to
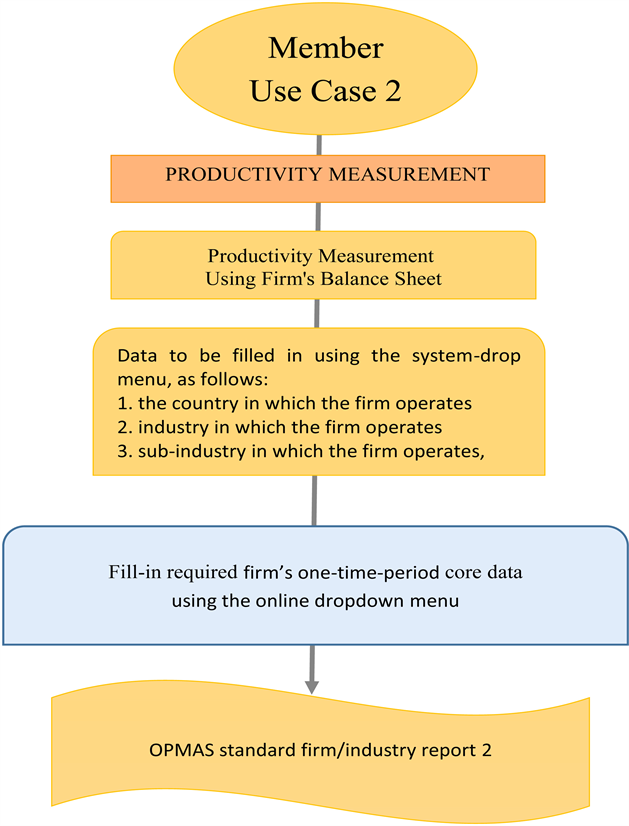
Chart 2. Use case 2―static one-year online productivity measuring.provide the OPMAS with the core data that to be filled-in using the system-dropdown menu, as follows:1) the country at which the firm operates, i.e., Kuwait2) industry at which the firm operates, i.e., Manufacturing3) sub-industry (2-Digit SIC) at which the firm operates, i.e., Manufacturing of chemical and chemical productsThe above information is needed to enable the OPMAS System to provide the overall comparison between the firm’s productivity/performance and its counterpart of the industry in which it operates.Then, as the required core-data is submitted, an instant reporting is provided by the system. This report is illustrated in Figure 2. It reports the overall
![]()
![]()
Figure 2. Use case 2―static one-year online productivity reporting.
comparison between the firm’s productivity/performance and its counterpart of the industry levels in which it operates.
As it is shown in Figure 2, the “one-time period” online productivity measuring and analyzing sub-system of the OPMAS is reporting. It includes the major economic performance indicators, such as: Gross Output (Q), Value added (VA), Labor Productivity (LP), Labor-Factor Intensity (LFI), Capital Productivity (KP), Capital-Factor Intensity (KFI), and Multi-Factor Productivity (MFP). All these major economic performance indicators are measured at the firm level and interrelated instantly to the industry’s performance in which the firm operates at the given year. It also comes with instant analysis which it is directed to the main key components of the firm’s overall performance.
6. Remarks and Future Works
The principle objective of this applied research is establishing Proof-of-Concept for an Online Productivity Measuring and Analyzing System (OPMAS). The significant outcome of this applied research was its unique online productivity measuring and analyzing and it’s potential to develop an online educational and training HUB for productivity awareness and improvements for both researchers and organizations.
It also comes with its unique online measuring models of the economic performance (Multifactor and Single-Factor Productivity measuring and analyzing) of a firm using its profit/loss statement. In addition to the online-prompt measuring of productivity, the firm will also be provided with instantaneous reporting about its economic performance in-compression to its related industry.
Furthermore, a simulation model (Productivity Analytics) for investigating the impact of various policies on the firm’s economic performance could be proposed and outlined. The policies that could be analyzed including environmental regulations, import/export taxes, and the provision of infrastructure.
Acknowledgements
I am grateful for Mr. Mohamed A. Nassar for his professional web developing and programming. I also would like to thanks with high appreciation Mrs. Eman Alsharif and Ms. Rasha Ani for their research assistances, supports, and for data collocations and entry.
NOTES
1https://www.productivityanalytics.org/
2It is worth noting that the Overall-Productivity (OP), Multifactor-Productivity (MFP), and Total Productivity (TP) are all synonyms. This paper uses the term MFP.
3It follows that if any of these major economic aspects of the production process is ignored, the resulting estimates of productivity are likely to have measurement bias.
4Therefore, readers need to keep in mind the underlying assumption at which the analysis has taken place.
5The assumptions underlying the use of this model (production function) are as follows: Constant return to scale, Hicks’s neutral technical change, perfect competition in both input and output markets, full capacity utilization of all inputs, and all production process (operations) are efficient (inefficiency does not exist).
6It follows that since the growth accounting model measure is defined as a non-stochastic and non-frontier based, no statistical test for its estimates can be conducted. That is, the significance of the measured growth rates and any other factor that potentially affects productivity growth cannot be verified.
7It is known that this measure mainly refers to the capital consumed not capital services, and is based on different accounting methods. However, due to many difficulties of measuring capital flow, in productivity studies capital depreciation is normally used as approximate [8] .
8using the provided downloadable templet.