Synthesis and Characterization of Mass Produced High Quality Few Layered Graphene Sheets via a Chemical Method ()
1. Introduction
Graphene is a two-dimensional hexagonal allotrope of carbon. Since its isolation in 2004, this seemingly simple material has revealed a number of intriguing physical properties [1] . It has a large theoretical specific surface area (2630 m2∙g−1), high intrinsic mobility (200,000 cm 2 v−1∙s−1), [2] [3] high Young’s modulus (~1.0 TPa) [4] and thermal conductivity (~5000 Wm−1∙K−1), [5] and its optical transmittance (~97.7%). These exciting properties make this carbon material a rising star in the world of nanomaterials and open the way to a large space of optoelectronic applications including sensors, transistors, terahertz imaging, composites, membranes, energy storage devices, batteries, and thin coatings for solar cells and LCD displays [6] . Owing to the versatility of graphene properties and projected applications, several production techniques are summarized, ranging from the mechanical exfoliation of high quality graphene to the direct growth on carbides or metal substrates and from the chemical routes using graphene oxide to the newly developed approach at molecular level [7] . Recently, much attention has been paid to the production of large amounts of high-quality graphene platelets, which have attracted considerable attention for possible applications in various fields where chemical graphitization from grahene oxide to graphene has been introduced for mass production where the compatibility of high-quality graphene and wafer-scale processing is a big challenge [8] . This project demonstrates a mass production of pure graphene powder via our modified hummers method followed by different dispersion and purification process.
2. Materials and Setup
The graphite used in this work was purchased from Sigma-Aldrich. The synthesized graphene powder was realized using a modified Hummers method which involved the exfoliation of graphite in the presence of strong acids and oxidants [9] . The obtained fewlayerd graphene oxide solution was reduced by hydrazine hydrate at 40˚C with stirring for 6 h. The particularity of our method is based on the good exfoliation and purification guaranteed by dispersion in 2-Propanol and PVP medium and different heat treatment steps to produce graphene nanopowder (Figure 1).
AFM and STM images were obtained using a Nanosurf system, SEM images by a Nova NanoSEM 230 and TEM images from a FEI/Tecnai F20 Cryo TWIN FEGTEM. The absorption spectrum was recorded at room temperature using a Cary UV-visible-near-infrared spectrometer. XRD patterns were recorded on a Bruker diffractometer using Cu-Kα (λ = 1.054 Å). RAMAN scattering spectra were recorded using a SENTERRA OF BRUCKER spectrometer with the following parameters: Excitation wave length 785 nm, Power 100 mW, Raman stocks spectral range 90 - 3200 cm−1 and an automatic correction of fluorescence. The Element composition was investigated with an Energy Dispersive X-ray (EDX).
3. Results and Discussion
In this work, the large scale and the high purity of graphene sheets from our synthesized powder were examined by different morphological and structural techniques

Figure 1. Solutions of graphene oxide (Brown) reduced graphene oxide (Black) and graphene powder.
3.1. Morphological Analysis
The first technique we used is an optical microscope. GO and RGO had much paler color and even weaker optical absorbance than graphene powder, which practically prohibits their direct optical observation by eye under bright field illumination. It was impossible to see graphene sheets from the powder using Silicon wafer substrate. To resolve this problem we prepared silicon oxide substrates which helped to show few layered graphene sheets reflected by the transparency of most areas of the sample (Figure 2).
The SEM images obtained using Nova NanoSEM 230 Electron Microscope show typical large flakes of graphene powder (Figure 3). The transparency of these flakes confirms the successful exfoliation of graphene sheets and indicates that each flake is composed of a few individual graphene sheets. For more information about this system we have used an AFM.
For this characterization, graphene powder was dispersed in water and the solution was sonicated for 15 min and deposited on normal glass substrate via a spray-coating. Atomic Force Microscopy images (Figure 4) of this sample show a typical transparent, large, highly thin and flat graphene film which confirm the results obtained with SEM.
Scanning tunneling microscopy provide unique tools to investigate the surface of nanomaterials due to its atomic resolution. Figure 5 displays STM three dimensional (3D) topograph of few layered graphene surface deposited on ITO substrate which shows clear evidence that these nanostructures are forming a continuously uniform layer reveals that this nanosheets have a very flat tops with low defects.
The importance of SEM, AFM and STM results enabled us to readily characterize these nanosheets by

Figure 2. Optical microscope images of GO, RGO and graphene powder.

Figure 3. SEM images of our prepared graphene powder show a pure and transparent flakes indicating that each flake is composed of a few individual graphene sheets.

Figure 4. AFM images of graphene sheets deposited on normal glass substrate (A). The AFM image (B) of a normal glass substrate was used to show the transparency of our sample.

Figure 5. 18 × 18 nm2 S TM 3D topography of graphene sample at a tunneling bias and current of 0.4 V and 2 nA.
HRTEM. The images obtained by this technique of our graphene powder dispersed in ethanol revealed a wide and flat individual graphene sheets without any fold along its length with straight and nearly atomically smooth edges without any discernible roughness or parallel lines (Figure 6(a)). In our samples, it was rare to observe these parallel lines seen in (Figure 6(b)) related to a double layer, or more layers. HRTEM images confirm that graphene sheets are fully exfoliated and the final graphene product is composed of a single layer.
3.2. Structural Analysis
Crystalline properties of our prepared graphene powder were investigated and compared with graphite, graphene oxide and reduced graphene oxide via the XRD patterns depicted in (Figure 7). Table (Table 1) presents Peaks position, the d-spacing, the Full width at half maximum (FWHM), the mean crystallite size (Lc) of a stacked graphene sheets, the average number of layers in a packed lamellae and the average number of carbon atoms (Nat) per aromatic lamellae of graphite, graphene oxide and reduced graphene oxide graphene which were calculated from the equations given elsewhere [10] . The comparison of the typical peaks observed for the GO, RGO and graphene powders showed a dramatic shift to higher 2θ angles, a huge increase of the FWHM and a drastic change in d-spacing as well as the lowest average number of layers in a packed lamellae been found due to the exfoliation of graphite, an enhancement of the c-axis spacing to 0.771 nm, brought about by completely eliminating the 0.333 nm graphite interlayer (center to center) spacing due to exfoliation of graphite by weakening the van der Waals forces of adjacent graphene sheets through chemical reactions; and the successful purification process suggesting that our prepared graphene powder is composed of a single two-dimensional sheets
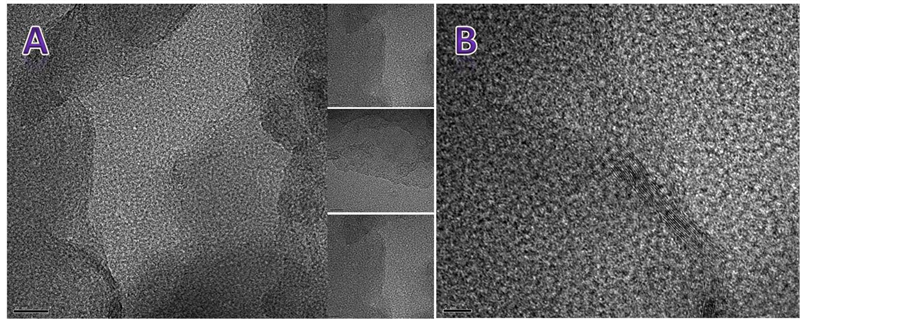
Figure 6. HRTEM images of our graphene powder dispersed in ethanol show are a fully exfoliated graphene sheets composed of a single layer (A). The Image (B) shows a multilayer graphene sheets.
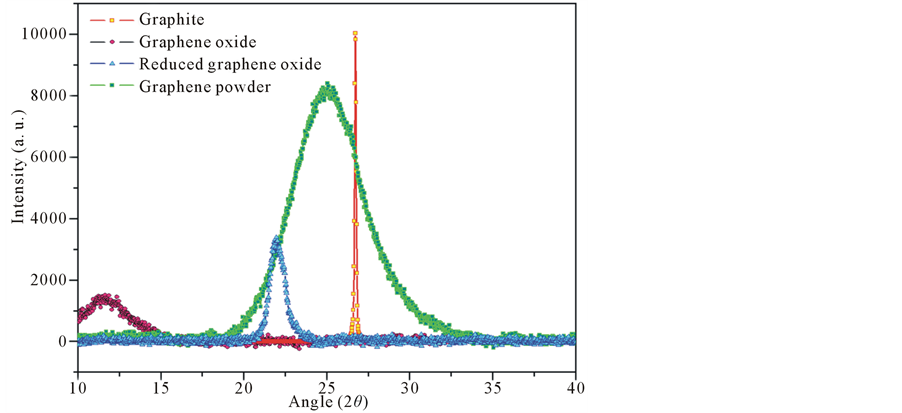
Figure 7. XRD patterns of graphite, graphene oxide, reduced graphene oxide and and graphene powders.

Table 1. This table presents the crystalline properties of graphite, graphene oxide, reduced graphene oxide and graphene powder via the XRD patterns.
without oxygen incorporation.
Graphene powder vibrational modes spectrum is shown in (Figure 8). The G band originates from in-plane vibration of sp2 carbon atoms and is a doubly degenerate (TO and LO) phonon mode (E2g symmetry) at the Brillouin zone center. One common application for the G-band is to aid in determination of graphene layer thickness. Figure 7 demonstrates the effect that layer thickness has on the position of the G-band. As the layer thickness increases, the band position shifts to lower energy representing a slight softening of the bonds as the layer thickness increases. G-band of graphene flakes in Raman spectrum of our prepared graphene powder shows a peak located at 1602 cm−1 which confirm that this product is composed of a few layered graphene. The 2D band originates from a two phonon double resonance Raman process and provides confirmation that our prepared graphene is few layered. Finally the D band at 1308 cm−1 may be attributed to defects in the graphene nanosheets or their agglomeration. The ratio of the G band to D band intensity can be related to the in-plane crystallite size (La) [11] . The in-plane crystallite size calculated by using the relationship given in Ref. [12] , La (nm) = 4.4 (ID/IG) gives about 2.15 nm.
EDX analysis was done for different area of the graphene powder. From the EDX spectrum result in (Figure 9)

Figure 8. Raman spectrum of M-RGO showing an intense 2D peak attributed to isolated graphene sheets vibration mode.

Figure 9. This figure shows the element composition of the graphene powder and confirms its purity.
chemical residues and Oxygen atoms are totally removed and the percentage of carbon atoms was in our samples was higher than 99% confirming the purity of this product.
4. Conclusion
In this work we have demonstrated that our method, which uses no substrates, will be an important step toward easily producing high quality and high purity sheets of graphene on a commercial scale to offer low costs and high throughput. This approach also opens the door to many well-established chemical techniques that could be used to cast graphene sheets into various structures or to integrate graphene with other materials to form nanocomposites. This work opens the way to combine graphene properties with other nanostructured materials to generate promising nanocomposites for optoelectronic applications.
NOTES
*Corresponding author.