Change of Tillage Layer Thickness of Farmland in Anhui Province of Eastern China ()
1. Introduction
Soil degradation includes physical, chemical and biological deterioration. Lots of attentions were paid to the degradation of topsoil or tillage layer in the aspects of erosion, pollution, nutrient depletion, compaction and crusting, acidification, salinization, etc. [1] -[3] . The tillage layer of farmland is formed after anthropic long-term tillage, irrigation and fertilization, plays an important role in the growth and yields of crops [4] , thus tillage layer thickness (TLT) is regarded as one of physical indexes in assessing soil productivity and quality.
Traditionally 20 - 30 cm is regarded as the suitable TLT because crop roots mainly distribute within this space [5] . Tillage layer shallowing can hinder the growth and distribution of crop roots, weaken the resistance of crops to natural disasters and reduce the yields of crops. In recent years, the phenomena of tillage layer shallowing were reported frequently in China, mainly attributed to the adoption of no-tillage and rotary tillage practices [6] [7] , for example, TLT of rotary tillage is usually limited to 12 - 15 cm as reported. However, during our soil surveys in recent years we found contrary change tendencies occurred in TLT even in the same region, so a question here is proposed: is the phenomenon of tillage layer shallowing universal in China or what is real change of TLT in China? So far only little rough and non-quantitative information is available on this issue, thus, it is necessary to conduct a quantitative study on this issue. Here, we took Anhui, a typical agricultural province in eastern China, as an example and compared the data of TLTs in 1980s and 2010s on the scales of wholeprovince and typical-county in order to disclose clearly the change of TLT.
2. Materials and Methods
2.1. Information of Anhui Province and Typical Counties
Anhui Province, locates in 114˚54'N - 119˚37'N and 29˚41'E - 34˚38'E in eastern China (Figure 1), is a typical agricultural province in China. Its area of total land is about 14.0 × 10⁴ km2 with the area of farmland of 5.7 × 10⁴ km2. The mean annual sunshine hour, temperature, precipitation and frost-free period is 1800 - 2500 h, 14˚C - 17˚C, 800 - 1800 mm and 200 - 250 d, respectively.
According to the conditions of topography and crop rotation, Anhui Province usually is divided into three regions (Figure 2): 1) plain on the north bank of the Huai River, more than 85% farmland in this northern region is dry-land in wheat-maize rotation, the main soil types are no-vertic Aquic Cambosols [8] generated from the alluvial sandy loess materials, vertic Aquic Cambosols or Aquic Vertosols [8] generated from clayey lacustrine loess deposits; 2) hilly terrain between the Yangtze and Huai River in middle Anhui, dry-land in wheat-maize rotation and paddy-field in wheat-rice rotation play equally important role, the main soils are Udic Argosols [8] for the dry-land and Staganic Anthrosols [8] for paddy-field, and most soils were generated from clayey Xiashu loess; 3) low mountain region on the south bank of Yangtze River, more than 95% of farmland in this southern region is paddy-field in early rice/rape-late rice rotation, the dominant soil type is Staganic Anthrosols [8] generated from sandy alluvial materials.
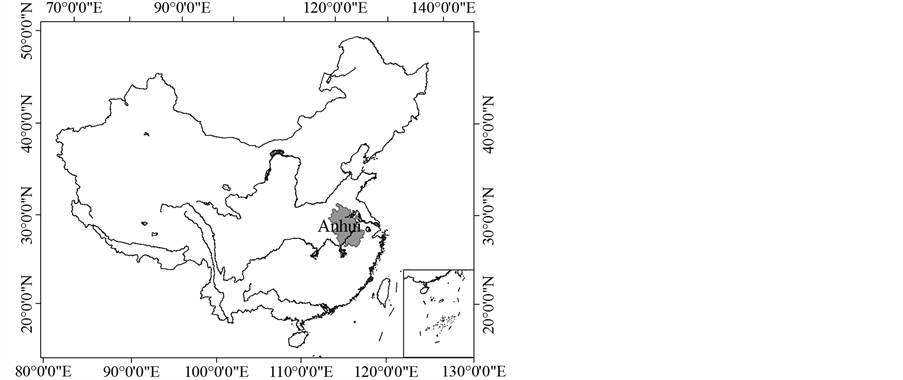
Figure 1. Location of Anhui Province in China.
2.2. Method of Locating Sampling Site in Farmland
Two scales were adopted in our study on the change of TLT: provincial scale and county one. Mencheng (MC), Dingyuan (DY) and Xuanzhou (XZ) were selected respectively as the typical county from northern, middle and southern Anhui (Figure 2). Soil survey documents used in our study for deciding sample location include Anhui Soils edited by Soil Survey Office of Anhui Province in 1990, Mengcheng Soils edited by Soil Survey Office of Mengcheng County in 1985, Dingyuan Soils edited by Soil Survey Office of Dingyuan County in 1985, Xuanzhou Soils edited by Soil Survey Office and Soil & Fertilizer Satation of Xuanzhou District in 1987.
After comprehensive consideration on soil type, landform and topography, land use type (dry-land and paddy-field), soil parental material and crop rotation system, finally 87 sites were selected on provincial scale (▲ in Figure 2) and 70 sites on the county scale (● in Figure 2) were decided from MC, DY and XZ respectively.
TLT of each site in 1980s was obtained from the description of typical profile in soil survey documents as mentioned above, and TLT of each site in 2010s was acquired by field survey conducted in 2010 and 2011. Because there was no information of longitude and latitude of typical profile in 1980s, the site of each typical profile was decided by the following steps: 1) found the village name from location description of typical profile in 1980s, 2) labeled corresponding sample site on soil map near the village within the polygon of the same soil type as typical profile, 3) inquired old farmers of the village about the exact dug location of typical profile, then adjust the sample site to the decided field. TLT of each site was observed and measured by digging soil into 40cm depth, for each site mean TLTs of in total 5 adjacent fields with the same soil type were used as the final TLT of this site.
2.3. Statistic Information of Samples
Table 1 showed the information of sample numbers of land use type and spatial distribution of samples on provincial and county scales. There were in total 40 and 110 dry-land samples as well as 47 and 100 paddy-field samples on provincial and county scales respectively. It also showed as described above that the land use type mainly is dry-land in northern region (93 samples, about 95.9% of the total 97 samples in northern region), paddy-field in south region(93 samples, about 91.2% of the total 102 samples in northern region) and

Table 1. Land use types and numbers of samples of TLTs survey in Anhui Province.
MC: Mengcheng, DY: Dingyuan, XZ: Xuanzhou, same in Table 3.
co-existence of dry-land and paddy-field in the middle region in middle region (48 samples of dry-land and 50 samples of paddy-field, about 49.0% and 51% of the total 98 samples in northern region respectively).
2.4. Statistical Methods of Data
All data were analyzed by SPSS 20.0 statistical software (SPSS Inc., Chicago, IL, USA) using descriptive and linear correlation analysis. Comparisons among groups were performed using a two-sample t-test. A value of P < 0.05 or P < 0.01 was considered statistically significant.
3. Results
3.1. Changes of TLTs from 1980s to 2010s
Figure 3 showed the distribution of sample numbers under different TLTs of farmlands in 1980s and 2010s, while Table 2 showed the changes of TLTs of farmlands in Anhui Province from 1980s to 2010s.
From Figure 3, it could be found that sample number with TLT >20 cm in 1980s was 11 in total, only 3.7% of total samples. In 2010s it was increased to 51 in total with a percentage of 17.2% of total samples. This showed that TLTs of most farmlands in Anhui Province ranged from 15 to 17 cm in 1980s and 2010s (Table 2), less than the suitable depth of 20 - 25 cm, so the tillage depth of the farmlands in Anhui province need to be deepened further in the future.
The sample number of TLT between 15 and 20 cm were 194 and 184 in 1980s and 2010s respectively, about 2/3 of total samples. Table 2 showed the mean TLTs of farmlands were 16.3 cm and 15.0 cm in 1980s and were 17.4 cm and 15.5 cm on provincial and county scale respectively. The above data suggested TLT of farmland in Anhui Province was generally at shallow level if compared with suitable depth of 20 - 25 cm.
However, there was an general incremental tendency of TLT of farmland in Anhui province, which could be reflected in two following aspects: 1) the increase of sample number of TLT >20 cm and the decrease of sample number of TLT <15 cm both on the provincial and county scales (Figure 3), 2) the mean of TLT increased by 1.1 cm and 0.5 cm on provincial and on county scales respectively (Table 2).
3.2. Changes of TLTs on Different Scales
Table 3 showed the general change of TLT of farmland in Anhui Province ranged from 3.3 to 4.3 cm. The mean incremental range of TLT was within 3.3 - 4.3 cm while the mean reduced one of TLT was within 3.4 - 4.2 cm. TLTs of 24 samples (27.6% of the total provincial samples) on provincial scale decreased averagely by 3.3 cm and 96 samples (45.7% of the total county samples) on county scale decreased averagely by 3.4 to 4.3 cm. Meanwhile, TLTs of 53 samples (60.9% of the total provincial samples) on provincial scale increased averagely by 3.4 cm, and 100 samples (47.6% of the total county samples) on county scale increased averagely by 3.8 to 4.2 cm.
The mean TLTs in middle and south regions increased by a mean of 0.4 cm and 0.7 cm on provincial scale and by a mean of 0.3 cm and 3.2 cm on county scale (DY and XZ) respectively. However, the change situation of TLT in northern region was on the contrary between on provincial scale and on county one, the mean TLT increased by 2.3 cm on province scale but decreased by 2.0 cm on county scale (MC).
The mean TLT of dry-land increased by a mean of 1.4cm on provincial scale but decreased by a mean of 1.0 cm on county scale. Meanwhile, the mean TLT of paddy-field increased by a mean of 0.8 cm and 1.3 cm on

Figure 3. Sample number distributions under different TLTs in 1980s and 2010s.
Table 2. Changes of TLTs of farmlands in Anhui Province.
(a, b), (c, d): the difference between the mean of TLTs significant at p < 0.05 or p < 0.01 level respectively.
Table 3. Range of decrease and increase of TLT.
provincial scale and on county one respectively. The decrease of TLT of dry-land on county scale was mainly resulted from the decrease of TLT of dry-land of MC.
4. Discussion
The influence of soil erosion on TLT of farmland could be neglected in our survey because most of surveyed farmlands locate at flat topographic positions, particularly in northern and middle regions of Anhui Province, and almost all the farmlands located at slopes in Anhui Province were built into terraced-fields. Here change of TLT was considered be influenced comprehensively by the factors of soil texture, the depth of rotary tillage and the farming positivity of the farmer.
Usually soil with coarse texture is easier in plough than ones with fine texture [4] . It could be seen from Table 2 that in northern region only the mean TLT of MC samples decreased while the mean TLT of northern provincial samples increased. If considering soil texture, 17 samples of total 27 northern provincial samples were from Aquic Cambosols with alluvial coarse loess parent materials, the contents of sand particles (0.05 - 2 mm) of these soils are usually higher than 60%, thus those soils are easy in plough, and TLTs of those samples were 17.5 ± 2.4 cm (Samples on provincial and county scales in total)and 19.8 ± 3.0 cm (Samples on provincial and county scales in total) in 1980s and 2010s respectively. Comparatively, 46 samples of the total 70 MC samples were from Aquic Vertosols or vatic Aquic Cambosols with clayey lacustrine loess deposits, the contents of clay particles (<0.002 mm) of these soils are usually high than 30%, so those soil are difficult in plough, TLTs of those samples were 15.6 ± 2.1 cm and17.8 ± 1.8 cm (Samples on provincial and county scales in total) in 1980s and 2010s respectively, shallower than those of provincial samples. Soil texture could also be regarded as one of the reasons for TLT in 2010s was an order of XZ (16.9 cm)> DY(15.0 cm) > MC(14.8 cm), the content of clay particles is about 20% in DY soils which were derived mainly from clayey Xiashu loess parent materials while that are about 7% - 10% in XZ soils which were mainly derived from coarse alluvial parent materials, both are lower than the clay content of MC soils, so plough easiness of soil is generally in an order of XZ > DY > MC.
TLTs in 1980s showed an order of MC (16.8 cm) > DY (14.7 cm) > XZ (13.7 cm), it could be attributed to the differences of local economic conditions. Usually farmers with high income not from the farmland pay less attention to tillage; they usually plough in a shallower depth to save time and cost. In Anhui province the economy of southern region are best, then followed by middle and north regions, for examples, the per capita net income of farmer in 2011 were about 800, 720 and 680 US $ in XC, DY and MC respectively. Before 1980s MC and DY were agriculture-dominant counties, and at that time the farmers there could hardly leave their homes, so family incomes of farmers in MC and DY in 1980s were almost all from the farmlands, they had to try all ways to promote crop yields from the farmlands including deep plough. But cattle and manpower were the main forces in plough at that time due to poor economy and lack of tillage machines, which was hard to plough deeply, thus TLTs in MC and DY in 1980s were about 15 - 16 cm (Figure 1). Comparatively, township enterprise were more developed in XC because it is adjacent to Jiangsu and Zhejiang, two famous provinces with developed township enterprises in China, the farmers in XC could find jobs in these enterprises easily and get higher income than from the farmlands, so the family economic conditions of farmers in XZ was generally better than in MC and DY. Under this situation, the farming positivity of famers in XC was lowest and TLT of farmland in XC in 1980s was also the lowest even the plough easiness of soil in XC is best due to the coarse soil texture.
With the development of agricultural machinery and the improvement of agricultural economy, as other regions of China, rotary tillage technique was adopted in Anhui province ten years more ago and usually it can plough soil to 12 - 15 cm depth. In 2010 and 2011 the cost of diesel oil for 1 hm2 farmland plough in Anhui province was about 32 US $ (27L of diesel oil) while the plough charge was about 120 US$. In order to reduce oil cost, to plough more farmlands to get more money and to avoid the damage of coulters, the operator of rotary cultivator usually tries to plough shallowly. During the field survey we found a funny phenomenon, the operator ploughed deeper (usually reached to 15 cm) if the farmer was on the spot during the plough process, on the contrary, the operator ploughed shallowly (usually less than 13 cm) if the farmer was not on the spot. Luckily most farmers were usually on the spot during the plough process, it could explain why TLTs in MC and DY (14.8 cm and 15.0 cm) were near the maximum 15 cm depth of rotary-tillage. As for XZ, as mentioned above, the rotary coulters could easily reach to 17 cm or more in paddy-field with coarse soil texture, that is why the mean TLT in XZ increased most (3.2 cm) and were maximum(16.7 cm) in 2010s under the same rotary tillage as MC and DY.
The above results suggest that the historically initial thickness must be considered when discussing whether shallowing or deepening of TLT of farmland, usually the decrease of TLT occurred when the historically initial TLT was higher than 15 cm, the current deepest tillage depth rotary tillage, otherwise, the increase of TLT occurred.
The phenomenon of tillage layer shallowing has attracted attentions in China in recent years [6] [7] , the techniques of subsoiling or deep-loosening as well as deep tillage (usually in 25 - 40 cm depth) has been proposed and applied effectively in overcoming the adverse consequences of tillage layer shallowing and increasing the yields of crops [9] [10] .
Moreover, in China 20 cm depth was widely used in estimating soil organic carbon of farmland surface layer [11] -[15] , however TLTs observed in our study suggested 20 cm is not an accurate depth of TLT, thus will inevitably give an inaccurate estimation of SOC of farmland.
5. Conclusion
Our survey showed that tillage layer thickness of farmlands in Anhui Province was generally increased averagely by 0.1 - 0.4 cm from 1980s to 2010s, but it was only about 15 - 17 cm in 2010s, still need to be ploughed deeply if compared with suitable 20 - 25 cm depth. The thickness of tillage layer was influenced comprehensively by soil texture, the depth of rotary tillage and farming positivity of the farmer. The initial thickness must be considered when discussing whether shallowing or deepening happened in tillage layer of farmland.
Acknowledgements
This study was supported by the Strategic Science and Technology Special Subject of Chinese Academy of Sciences (XDA0505050303), the Foundation Special Project of the Ministry of Science and Technology of China (2008FY110600) and the International Science and Technology Cooperation Project of China (2010DFB24140). We would like to express thanks to the colleagues in Soil and Fertilizer Stations of Mengcheng County, Dingyuan County and Xuanzhou district for their participation in field survey.
NOTES
*Corresponding author.