A Study on Chinese Regional Scientific Innovation Efficiency with a Perspective of Synergy Degree ()
1. Introduction
Science and technology acts as an engine of the sustainable development of finance and is the basic motivation to pave the future path of human. Innovation is the soul of nation progress and the inexhaustible motive force of state prosperity. Along with the development of regional economy and fiercely aggravating competition, the regional capability of innovation has already become an indicator of regional competiveness and a decisive factor for the regional economy to obtain an advantage position in international competition [1]. Thus researches of the efficiency of regional sci-tech innovation comprehend the state of regional innovation system of China, and advices upon the results of them will play an important role in enhancing the regional innovation of China and launching the strategy of regional innovative development.
In this paper, from the perspective of the process of regional sci-tech innovation, we conceive of the regional sci-tech innovation system as two sub-systems of technology output and economic output (Figure 1). During the sub-system of technology output, research bodies such as research institutes and companies’ R&D departments, utilize the enormously invested scientific resources to carry out R&D activities, which finally generates the achievements like patents and sci-tech papers. On the other hand, during the sub-system of economic output, companies or social groups invest money to industrialize the achievements from the former process, in order to pursue financial benefits. In recent years, after continuous perfecting of the data-envelopment-analysis (DEA) method, it is widely employed in researches of sci-tech innovation efficiency. Chen [2] uses DEA to calculate the scientific input/output efficiencies of cities in Fujian province of China, upon which he then analyzes the elements of non-efficiency and the dynamic changes of productivity with composite DEA method and Malmquist index. In the end he points out that technical efficiency is important to the enhancement of productivity and tech-

Figure 1. Regional sci-tech innovation process model.
nical progress remains to be intensified. In Yao’s analysis of the sci-tech innovation efficiencies of Shanxi and Heilongjiang province of China, adopting DEA method and Malmquist index model [3], he concludes that the rise of efficiency in the first stage results from the effectively launched approaches for both technical efficiency and technical progress, while it decreases in the second stage because of the non-optimal conditions of both technical efficiency and technical progress. Feng [4] and Du [5] construct a two-stage DEA model, which takes patents, papers as the intermediate products, to assess the sci-tech innovation efficiency of each province in China. Then they divide them into different groups and study the features and causes of each group, based on the former results. At last, they bring out some suggestions for each group accordingly. Guan [6] evaluates the technical efficiency, economic efficiency and organizational efficiency of the regional innovation in China, using two-stage DEA method. According to the results, he then expresses the state of each region in three perspectives.
We can see from the studies above that scholars in China have carried out a series of profound researches of the regional innovation efficiency of China via DEA method. However, the synergy degree of sub-systems is an aspect that scholars hardly look into. So, this paper starts from the two sub-systems. First, we calculate technical, economic sub-system efficiency and organizational efficiency of China’s regional innovation from 2001 to 2011 through two-stage DEA method. Second, we use the linear regression model to inspect the relation between the synergy degree of the efficiencies of two subsystems and the organizational sci-tech innovation efficiency. Then we discuss the synergy degree’s impact on the organizational efficiency.
2. Model Construction
2.1. Two-Stage DEA Model
Data Envelopment Analysis is first brought up by Charnes et al. in 1978 [7], which is a linear programmingbased methodology for evaluating the relative efficiency of each member of a set of organizational units. These units, called decision-making-units (DMUs), consume various level of each specified input and produce various levels of each specified output. Traditionally, DEA makes no assumptions concerning the internal operations of a DMU, rather, treats each DEA as a “black box”, so the whole system lacks insightful interpretation and processspecific guidance to managers is inaccessible. This puzzle was perfectly solved when Fare and Grosskopf first brought up network DEA model (FG Model) [8], which divided complex operation flow within a DMU into several sub-DMUs and handled each node of the network respectively. As a typical case of network DEA model, two-stage DEA model is applicable to most practical situations. In this paper, we employ this method according to the system structure of regional innovation in China.
Considering the fact that input parameters are already predetermined by the operating condition of each DMU, thus we set each stage of the model input-oriented. The variable returns to scale model (VRS) is adopted.
Referring to Figure 1, we assume that for n DMUs, input is X, intermediate output is I, intermediate input is Z and output is Y. Then the first stage programming formula can be expressed as:

While the second stage formula:

When we replace the parameters in the second stage with the modified ideal values based on the first stage, then we can obtain the organizational efficiency:
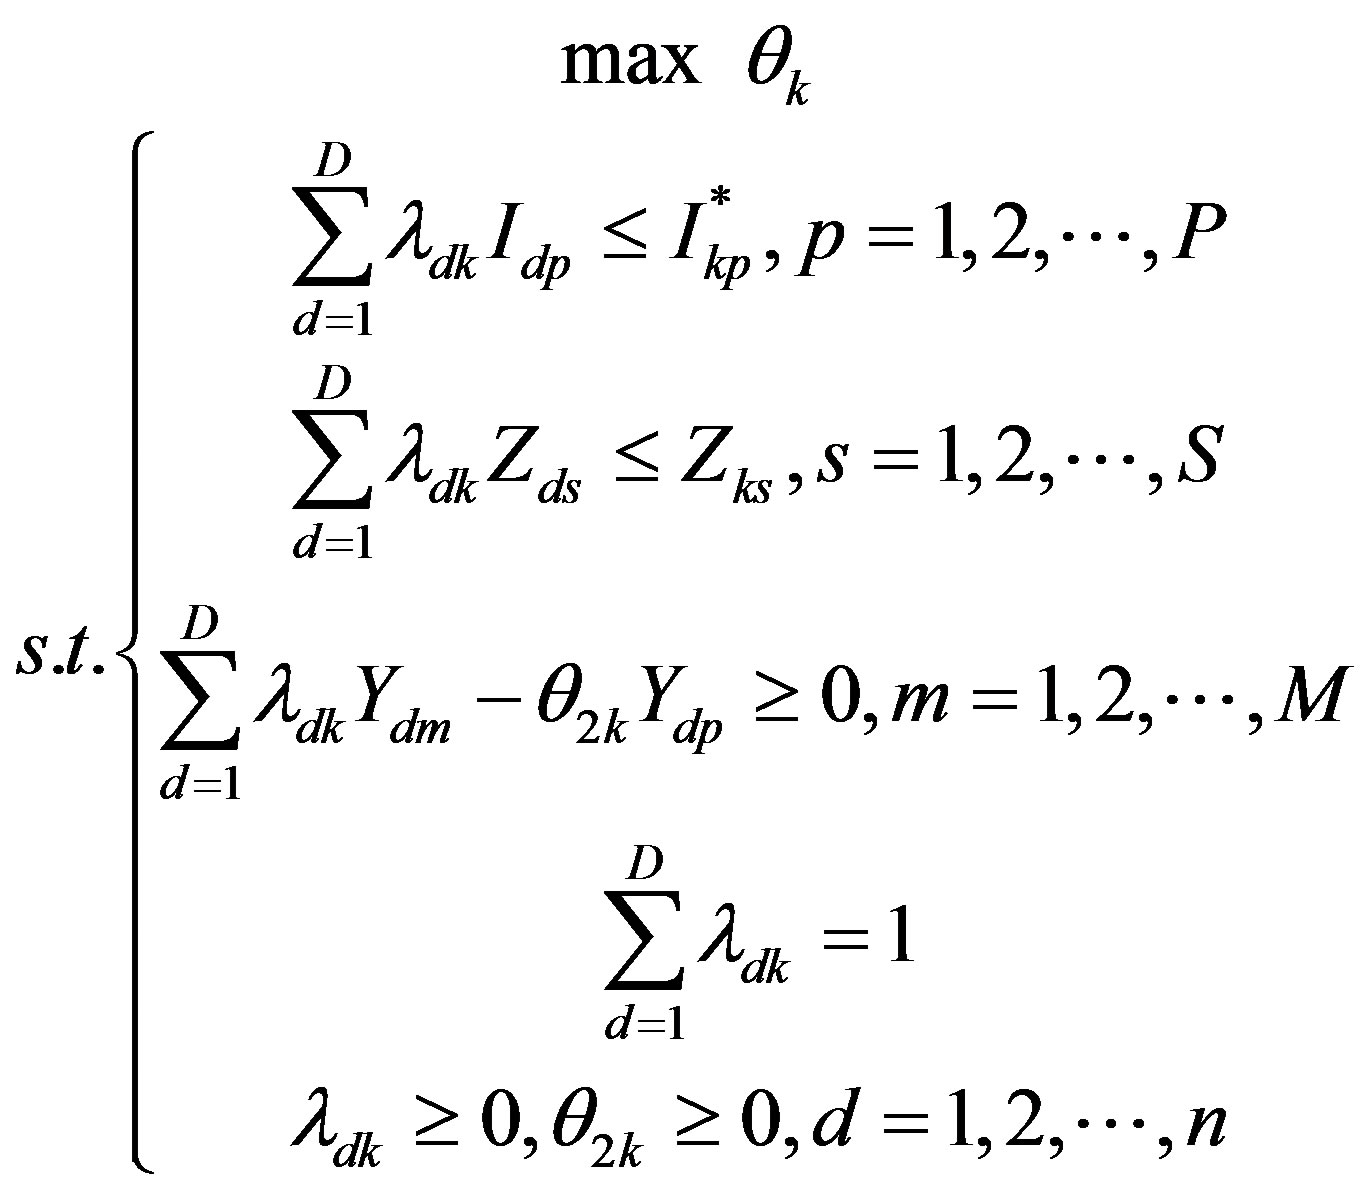

where k is the number of the DMU under-evaluating; I, P, S and M stand for the dimension of input, intermediate output, intermediate input and output. The asterisks on  and
and  indicate the optimal values of these decision variables. Take the reciprocal of the efficiency θ got above, E = 1/θ. If E = 1, then the DMU is effective. If E < 1, then the DMU is non-effective and the output amount can be raised up by θ times to make it effective. As for the inevitable theoretical dilemma [9-11], we utilize Sexton and Lewis’s “reverse input/output” method [12] to get rid of.
2.2. Research Objects and Data Resources
This paper selects the data of 30 provinces in China from 2001 to 2011 as research objects (without HK, Macau, Taiwan and Tibet). Since the postponed effect during the process when sci-tech inputs are transformed into financial outputs, which is usually one or two years [13], we, therefore, employ the data of year T as input for the technology stage, year T + 1 as the output for the technology stage and the input for the economic stage, year T + 2 as the output for the economic stage. Besides the average GDP is acquired from Macro China, the rest data are all obtained from the yearbook of science and technology of China.
2.3. Index Selection
Referring to the past researches and considering our research interest, we select the indexes below in Figure 2.
Technology output system (sub-system I) mainly consists of four inputs and two outputs. The four inputs are sci-tech faculty number, sci-tech expenditure, R&D fulltime equivalent faculty number and R&D expenditure, while the two outputs are patent number and paper numbers archived in three major indexes (SCI, EI and CPCIS). Besides the two outputs from the first stage taken as inputs, the economic output system (sub-system II) also includes another two inputs and four outputs. The additional two inputs are new product expenditure and other sci-tech expenditure (e.g. technology importing, technology absorbing, buying domestic technology and technology reforming), while the four outputs are averaged GDPnew product value, new product sales revenue and the contract turnover in technology market.
3. Calculation and Analysis of Regional Sci-Tech Innovation Efficiency of China
Base on the two-stage DEA model mentioned above, the sci-tech efficiency of each sub-system and the organizational efficiency are calculated via MATLAB R2012a. The sample is the 30 provinces of China and the time range is from 2001 to 2011. For convenience of discussion and save of space, only the time-averaged results are displayed, as shown in Table 1.
First of all, we must point out that some places which are relatively less developed, such as Inner Mongolia, Hainan, Gansu, Qinghai and Ningxia, are strangely showing a higher efficiency. There might be something to do with the relatively less investment of these provinces. Moreover, the results computed by DEA models are only valid for the selected indexes treated as a whole, the impact of each index needs to be further accessed in the future.
To be specific, in sub-system I, four provinces are on the efficient frontier, which are Peking, Zhejiang, Guangdong and Hainan. This indicates that these four regions have made better use of the sci-tech resources and performed better in the process of turning sci-tech investments into achievements. The averaged efficiency is 0.766. Those regions with a lower score still need further development. The Inter-province comparison demonstrates an obvious otherness. On the other hand, in system II, there are more provinces on the efficient frontier, most provinces preserved a high efficiency. Meanwhile, there yet exist some places like Sichuan, Shaanxi and Anhui with a score around 0.5. For these regions, the sci-tech achievements cannot successfully be industrialized and turned into output value. And the otherness among different regions still exists. As for one province, the efficiency levels of the two sub-systems also vary. For instance, Inner Mongolia, Shandong and Qinghai’s performances of each stage do not balance well and show an evident divergence.
As for Table 2, we can easily discovery that from

Figure 2. Regional sci-tech innovation efficiency and two sub-systems efficiencies accessing model.

Table 1. Regional averaged value of sci-tech innovation efficiency and two sub-systems efficiencies of China.

Table 2. Chinese regional averaged sci-tech innovation efficiency from 2003 to 2011.
2003 to 2011, the region-averaged efficiency always fluctuates between 0.7 and 0.8, and the overall average is 0.726, which implies relatively large improvement room. Over the selected years, only Peking and Guangdong are on the organizational efficient frontier. Both their sci-tech usage of investment and industrialization of sic-tech achievements have reached a relatively optimal condition. On the contrary, the organizational scores of Anhui, Henan and Hubei et are only around 0.5. Even though one subsystem of them might function well, the other one is far from optimal so that the whole system do not work well.
Generally speaking, the regional organizational efficiency and sub-system efficiencies all implies a demand of improvement and an inter-province otherness. Moreover, the technical and economic output efficiencies show an obvious divergence, indicating a low synergy degree between the two.
4. Analysis and Verifying of Influencing Factors
4.1. Model Construction
In this section, the synergy degree of two sub-systems is calculated, and then using the result, the impact of the synergy degree upon the organizational efficiency is inspected. Taken several scholars’ approaches for reference [14-16], the composite-system-synergy model is adopted. First, determine index weights. Then compute the order degree of technical and economic sub-system respectively. Finally calculate the synergy degree of the composite system of technology output and economic output.
Synergy degree, by definition, is the harmony and accordance degree among several systems or several elements of one system during development or evolution.
Consider a system ,
,  is the j-th sub-system. Its order parameter is
 .
.
 , where
  is lower limit and
  the upper limit. Define:
 (1)
(1)
For all  , denote the linear superposition as
 .
.  is the order degree of sub-system
 . For year y and y − 1, the order degree can be written as
 ,
,  . Then we have the synergy degree:
 (2)
(2)
When  , sig is 1, which means each subsystem has progressed compared to the past year. On the contrary, when
 , sig is −1, indicating at least one sub-system has declined. The solution
  of which higher value means higher synergy degree.
4.2. Index System and Index Weights
Based on the continuous dynamic observation, it turns out that, the synergy between the outputs of technical stage and economic stage results from the synergy effect of the investment of the two, together with the synergy effect of management of the two as well, and will largely result in a decisive element of development sustainability of the composite system. Thus, from the perspective of output synergy of the two sub-systems of technology and economy, the index system is constructed. From Figure 2, the technical outputs include patents of three categories of invention, appearance and utility, as well as papers from three main data libraries of SCI, EI and CPCIS. The weight is determined through varied coefficient method:

Where for the ith index,  is the varied coefficient,
  is the standard error and
  is the average value. Then normalize the obtained
  by
by  and we get the weight
  , shown in Table 3.
4.3. Order Degree Calculation
Using Equation (1), we can calculate the order degree of

Table 3. Indexes and their weights of two sub-systems’ synergy calculating system.
the technical output system and the economic output system from 2001 to 2011, which can be seen in Table 4.
4.4. Synergy Degree Results and Analysis
Using Equation (2), the synergy degree from 2003 to 2011 is easily acquired, shown in Table 5.
Then by using SPSS 19.0, we can carry out the linear regression analysis between synergy degree and organizational efficiency we have got above in Table 5. Results are listed in Table 6.
Linear regression analysis shows that R2 equals 0.617, meaning the fitting degree is fine. Both S number is below 0.05, indicating the coefficients are trustworthy. The standard regression coefficient is 0.815, revealing a strong positive relation between synergy degree and organizational efficiency. For more straightforward displaying, the result is plot in Figure 3.
It is easy to figure out that two curves are highly in accordance. From 2003 to 2006, when synergy degree is negative, organizational efficiency degreases. In addition, when the synergy rises slightly in 2006, the dropping trend of efficiency alleviates. When synergy is positive in 2007 and 2009, efficiency increases remarkably. For the rest years of 2008, 2010 and 2011, when synergy is again negative, efficiency drops.
In conclusion, organizational efficiency and synergy degree display a positive relation. Whether the sci-tech organizational efficiency progresses or not depends on the symbol (positive or negative) of synergy degree, while the absolute value of synergy degree reflects the rising or dropping speed of organizational efficiency.
5. Conclusions and Suggestions
From the perspective of the sci-tech development process, regional sci-tech innovation is separated into two sub-

Table 4. Order degrees of two sub-systems of sci-tech innovation system of China from 2003-2011.

Table 5. Synergy degrees of technical and economic output composite-synergy-system of China from 2003 to 2011.

Table 6. Linear regression analysis between synergy degree and organizational efficiency.

Figure 3. Development trends of synergy degree and organizational efficiency.
systems of technical output and economic output. Then with chain network DEA model, the efficiencies of each sub-system and the organizational innovation system have been examined. Next, by adopting linear regression model, the impact of the synergy degree of two sub-systems on the organizational efficiency has been investigated. At last some conclusions have been reached that regional sub-system efficiencies and organizational efficiency in China are unsatisfactory and need to be ameliorated, for an obvious inter-province otherness and relatively low efficiency values. Furthermore, as for the same region, two sub-systems do not function at the same level, so that the synergy degree is not very high. At last, the synergy degree of two sub-systems evolving synchronously shows an evident positive relation.
Therefore, according to the conclusions expressed above and the practical conditions of regional sci-tech innovation in China, we propose some constructive suggestions: 1) For places with high economic efficiency and low technical efficiency such as Inner Mongolia, Jiangxi and Henan, the technology system should be improved firstly, via constructing or sponsoring a series of research-intensive universities and key national research institutes, attracting research talents. 2) For those provinces of high technical efficiency and low efficiency like Heilongjiang, Anhui and Hubei, a mechanism of linking research and manufacturing, on the basis of enterprise, should be established. Taking market needs into consideration, carrying out scientific researches accordingly and bettering the science and technology transformation mechanism make it easier for sci-tech achievements to be industrialized. 3) For those districts with low efficiencies of both sub-systems like Sichuan and Guizhou, the performances of both sub-systems should be optimized at the same time. Talent-attracting strategy, rational market environment and favorable company system should be instituted to alter the current relatively less developed conditions.