Abstract
The present study investigates solar events through geomagnetic
activity and physical processes on the Sun: 1) Quiet activity (QA) related to
the slow solar wind, 2) Recurrent activity (RA) related to high and moderate
speed solar wind streams from coronal holes, 3) Shock activity (SA) identified
by observations of SSCs and 4) Unclear activity (UA) which contains all
activity not covered by the first three cases. For recent cycles, we analyze
and emphasize some important results: Quiet activity is predominant for cycle
23, comprising 40% of the total activity and over 80% of the activity near
solar minimum. Shock and recurrent activity contributions to total geomagnetic
activity are largest in cycle 20. The most fluctuating events are observed
during cycles 21 and 22. Throughout solar cycle 23, the contribution, from each
type of activity, differs from recent solar cycles, with larger percentages of quiet and
recurrent activity and less unclear activity. These percentages are similar to
those in solar cycles observed in the late 1800s. Since 1963, solar wind data
are available. We analyze the distribution of the solar wind velocity for each
geomagnetic class of activity and find that: 1) Within each activity type aa
does not depend on V, 2) Approximately 80% of the solar wind has V < 450
km/s for QA and 80% of the solar wind has V > 450 km/s for
RA, 3) SA and UA both have 60% of the solar wind V > 450 km/s. We found the
following conditions for all four solar cycles: 1) For QA 95% of
solar wind speeds are in the range 399 ± 69 km/s, 2) For RA 95% of the solar
wind speeds range from 582 ± 110 km/s, 3) For SA 95% of the solar wind
velocities are order of 482 ± 101.4 km/s, and 4) For UA 95% of solar wind
speeds are 480 ± 85.82 km/s. These results confirm the classification scheme
that QA reflects slow wind effects, RA effects high wind stream and UA answers to the
fluctuations between high wind stream (~60%) and slow wind (~40%).
The study shows that high wind stream (~60%) and slow wind (~40%) are both
registered for SA.
1. Introduction
Geomagnetic activity may be divided into four classes: quiet, recurrent, shock, and fluctuating/unclear [1-7]. Legrand and Simon [1] and Simon and Legrand [2] proposed the first classification of geomagnetic activity for the period 1868-1977 using pixel diagram. Pixel diagrams represent the geomagnetic data as a function of solar activity for each solar rotation (27 days) and give an overview of the geoeffectiveness of solar events. Previous pixel diagrams were built using the the geomagnetic aa index defined and explained by Mayaud [8-10], the times of SSCs (Sudden Storm Commencements) and the strong correlation between the aa index and solar wind established by Svalgaard [11]. Important works [12, 13] show that geomagnetic activity has two components. The first component varies in phase with the sunspot cycle and the second begins immediately after the maximum of the sunspot cycle. Following Legrand and Simon [1]’s works, Ouattara and Amory-Mazaudier [6] investigate the time variation of solar activity from 1968 to 1996. Very recent study [7] extends and improves the classification of geomagnetic activity, and we use it to investigate the time profiles of geomagnetic activity during solar cycles 20, 21, 22, and 23. We also study the statistical distribution of solar wind speeds in each class of geomagnetic activity for cycles 20 to 23.
2. Data and Methodology
2.1. Data
The times of sudden substorm commencements (SSC), which are rapid increases in the magnetic field observed at the ground per day are taken from http://isgi.latmos. ipsl.fr/. The solar wind speed and the international sunspot number (SSN) are obtained from http://omniweb. gsfc.nasa.gov/form/dx1.html.
2.2. Geomagnetic Classification Methodology
Legrand and Simon [1] justified their use of the aa index to classify geomagnetic activity on two features: 1) The contribution of solar wind shocks to geomagnetic activity can be determined from ground-based observations of SSCs; time periods with SSCs are defined to have shock activity (SA). 2) The strong correlation between the aa index [8-10] and the solar wind speed [11]. This correlation allows the data to be divided into three classes of geomagnetic activity: 1) low-speed solar wind, 2) variable-speed solar wind and 3) high speed solar wind. Zerbo J.-L. et al. [7] consider these criteria, the contributions of magnetic clouds, and the contribution of moderate speed wind streams to improve the classifications [1]. We divide the solar wind into classes using the aa index and then use the results to study correlations with solar wind parameters. Figure 1 illustrates the pixel diagrams of the aa indices. The top panel illustrates the year 1974a very active year [7], and the bottom panel the year 2009, a very geomagnetic quiet year at the minimum of the sunspot cycle. The pixel diagrams display the daily averages of aa as a table. Each horizontal line contains 27 days corresponding to a 27-day Bartels solar rotation with two days of overlap on each end. The number in each square is the mean daily value of the aa index and the squares are color coded based on these values using the color bar shown in Figure 1. Circles show the days when SSCs were observed. This diagram, similar to a Bartels diagram, simplifies the identification of geomagnetic phenomena. From the pixel diagrams, the class of activity, QA, SA, RA or UA, for each day is determined. The 1974 pixel diagram illustrates the different classes of activity. The use of these diagrams is best explained by Zerbo J.-L. et al. [7]. 1) Quiet activity days are defined as days when aa < 20 nT (colors white and blue on Figure 1). The three other classes (shock activity, recurrent activity and fluctuating activity) constitute the disturbed geomagnetic activity classes which occur on days when aa ≥ 20 nT. These classes are distinguished as follows:
2) Recurrent (stream) activity corresponds in the pixel diagrams to days where aa ≥ 20 which repeat at the same solar longitude for at least two consecutive solar rotations. This class is driven by fast solar wind from coronal holes which persist for more than one solar rotation. SSCs are not observed during the main phases of storms driven by recurrent streams. An example of RA is shown in Figure 1 (top panel).
3) Shock activity is defined to occur on days when SSCs are observed and up to 3 days after the shock passage if aa remains > 20 nT. SA is driven by CMEs on the Sun which often produces high solar wind speeds. An example of shock activity which persists for three days is shown in Figure 1 (top panel).

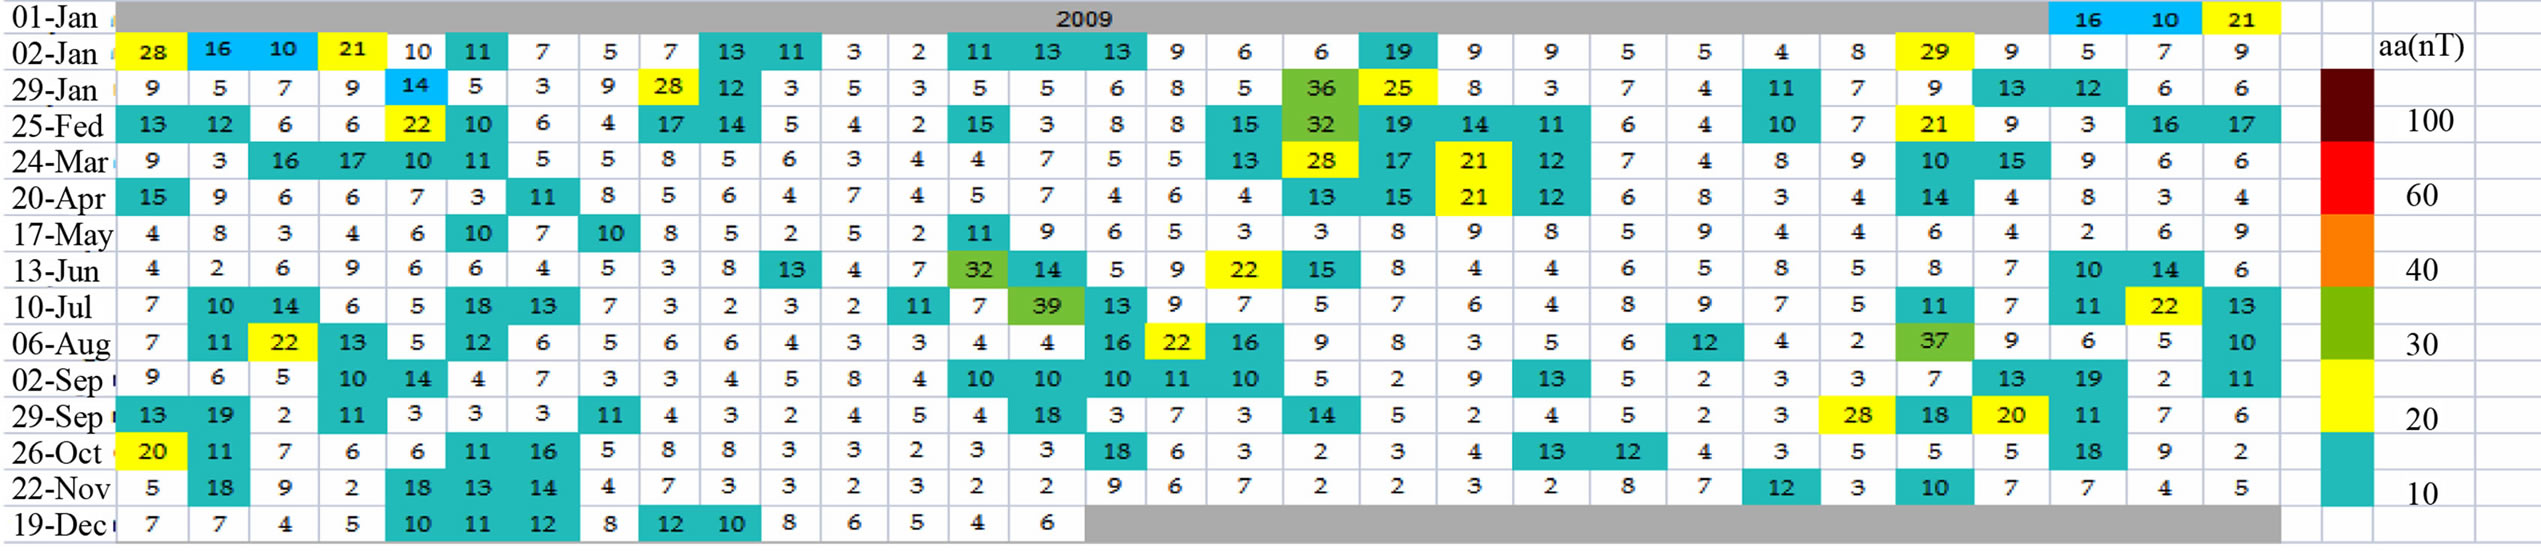
Figure 1. Pixel diagrams for the years 1974 (panel a) and 2009 (panel b) constructed with aa indices.
4) Unclear activity includes all times which do not fit the criteria for the other three classes and is thus a mixed class of disturbances. This activity results from variable moderate and high-speed solar wind and may be related to the fluctuations of the heliospheric neutral sheets.
3. Results
3.1. Geomagnetic Classes, Their Activity Variation during the Solar Cycles 20, 21, 22, and 23
In this section, we study the four latest solar cycles using aa indices and solar wind data. Figure 1 shows the large difference in solar activity between the beginning of the declining phase in 1974 and very quiet recent solar minimum in 2009.
Figure 2 extends the Legrand and Simon [1]’s work to include 32 more years of data. It shows the yearly percentage of occurrence of each class of geomagnetic activity from 1868 through 2009. Figures 2(a)-(e) show long time variations of QA, RA, SA, FA, and SSN respectively (classification of Legrand and Simon, 1989). QA decreases with time from 1868 until solar cycle 22 and then strongly increases at the end of solar cycle 23.