Radiometric Characteristics of the Landsat Collection 1 Dataset ()
1. Introduction
The Landsat program provides the longest continuous climate records from space. The trustworthy information preserved by the Landsat images has improved the researches of global resilience to climate change and variability. However, the inconsistency of Landsat radiometric measurements imposes the scientific values of the Landsat images. In 2016, the United States Geological Survey (USGS) started reorganizing the 40-year multi-sensor Landsat archive into a formal Collection structure. The new collection management strategy has been implemented to form the Landsat Collection 1, which was released in 2017. All Landsat data are cross-calibrated (regardless of sensor) across the full collection (Landsat Collections, https://landsat.usgs.gov/landsat-collections). The essential goal of the new Landsat product is to provide a consistent Landsat archive with improved geometric and radiometric quality. The new high quality Landsat images will finally offer the users community a Climate Data Records (CDRs) suitable for time-series analyses. Consistent radiometric measurements enable producing sustainable and scientifically defensible CDRs for environmental remote sensing studies.
The Landsat Collection 1 data contains the earth surface observations from four satellites in the Landsat series: Landsat-4, Landsat-5, Landsat-7, and Landsat-8 (L4, L5, L7, and L8). We focus on the radiometric calibration of the Landsat solar reflective bands, including three basic sensor types: the L4 and L5 Thematic Mapper (TM) with bands 1-5 and 7, the L7 Enhanced TM Plus (ETM+) with bands 1-5 and 7, and the L8 Operational Land Imager (OLI) with bands 2-7.
The radiometric calibration procedures for the Landsat Collection Tiers represent a significant change in the implementation of creating radiometric consistent Landsat measurements. The results from this study reveal the radiometric changes on how, where and to what extent of the Landsat Collection 1 compare to Pre-Collection. The purpose of this paper is to report a preliminary study of the radiometric characteristics of the USGS latest released Landsat Collection 1 data. Following this section, this paper provides a brief review of the radiometric calibration history of the L4 TM, L5 TM, L7 ETM+, and L8 OLI and the efforts of cross-calibration between the Landsat sensors, gives the details regarding the comparison of the radiometric characteristics between Landsat Collection 1 and Pre-collection data, discusses the scientific improvements of the first radiometric consistent Landsat CDRs, and closes with a summary of the performance using Landsat Collection 1 archive for time-series analysis.
2. Brief Review of the Landsat Radiometric Calibration
The radiometric calibration of the L4 TM was based on the internal calibrator (IC) lamps to determine the gain and bias for each detector. A significant effort was expended on the radiometric calibration procedures for the L4 TM by Barker et al. [1]. For each detector, the least squares analysis was used to estimate the gain and bias against the IC lamp data. The linear coefficients were further applied to remove the residual striping [1]. However, Fischel found that detector bias of L4 TM was not constant when the scan-to-scan periods longer than scene acquisition times [2]. He developed an alternative algorithm, using the shutter data to estimate the bias and lamps to estimate the gains. The radiometric correction of L4 TM was dramatically improved using the alternative algorithm [2]. In follow-on studies, the radiometric calibration of the L4 TM were tied to L5 TM and L7 ETM+ by using cross-calibration and Pseudo-Invariant Sites (PICS) approaches [3][4][5][6]. The L4 TM long-term trend observations based on the PICS indicated that uncertainties on the order of 3% can be obtained during the lifetime of L4 TM radiometric calibration [6][7].
From launch until May 5, 2003, calibration of the L5 TM was also based on the IC lamps [8]. Nevertheless, due to the observed instrument’s IC degradation a relative gain approach (lifetime gain model) was developed and implemented to all the USGS distributed L5 TM imagery [8]. Relative gain is radiometric gain of each detector relative to other detectors in the same solar reflective band. The change of relative gain could be described as a linear function of time for the L5 TM detectors. The development of the new L5 TM radiometric calibration procedure was based on period observations (1984-2003) and was anchored to that of L7 ETM+. Helder et al. [9]thoroughly studied the L5 TM lifetime radiometric stability and concluded that the relative gain approach for the L5 TM solar reflective bands is feasible and improved. By using the relative gain model, the L5 TM radiometric calibration overcome the drawbacks of traditional histogram equalization approach, without the related degradation effects, and was tied to the cross-calibration with the L7 ETM+ [9]- [14].
Immediately after the L5 launch, Metzler and Malila started a study of cross-calibration from L4 and L5 TM [15]. The data used for this first L4 and L5 TM cross-calibration efforts were acquired during an underpass maneuver. Direct comparison of the relative radiometric responses was done between the respective solar reflective bands from L4 and L5 TM. They found that the multiplicative factors range from 0.987 to 1.145 were required to convert L4 to L5 TM data.
In addition to the lamp-based IC, the L7 ETM+ has two new on-board calibration devices for the solar reflective bands: a Full Aperture Solar Calibrator (FASC) and a Partial Aperture Solar Calibrator (PASC). Unfortunately, Markham et al. found that the PASC was unreliable [16]. The on-board calibrator lamps and diffusers indicate that the L7 ETM+ drift is generally by no more than 0.5% per year. In order to maintain the L7 ETM+ calibration accuracy and reduce the degradation effects from the on-board calibration system, the vicarious calibration approach has frequently been used to calibration the L7 ETM+. Studies show that the on-board calibrators and vicarious calibration have kept the L7 ETM+ calibration uncertainty within 0.5% [17].
Prior to the establishment of the L7 final orbit, it flew in tandem configuration with L5 allowing cross-calibration. The tandem based cross-calibration provides an update to the L5 TM’s reflective bands calibration. There are 2% radiometric differences or better depending on the reflective band between the L5 TM and L7 ETM+. The follow up research tied the L5 TM radiometry to that of the L7 ETM+ to construct radiometric consistent Landsat observation. The cross-calibration efforts resulted the “Look Up Table 2003” (LUT03) and became the formal calibration procedure for the L5 TM [8].
Consistent with the Landsat legacy, the L8 OLI ensures the Landsat observations of the unparalleled Landsat record. The advantages of the L8 OLI (i.e. push-broom imaging, improved on-board radiometric calibration, wider dynamic ranges, and spectral bandpasses refinement) resulted the L8 OLI radiometric quality superior to the previous Landsat data. Three built-in calibration devices (a shutter, lamps, and solar diffusers) are used for the L8 OLI on-orbit radiometric calibration. Relative radiometric approach, such as vicarious calibration has been applied to characterize the L8 OLI’s radiometry and making it more consistent than previous Landsat sensors. The L8 OLI radiometric stability of the six solar reflective bands has been better than 0.3% [18][19]. In more recent journal publications, post-launch study indicates that vicarious and on-board calibrator calibration show much better agreement in L8 OLI except for the SWIR-2 band in disagreement in 0.6% [20].
However, the subtle but significant radiometric improvement of the L8 OLI resulted challenges if L8 OLI data are tied with the L4 TM, L5 TM and L7 ETM+ image stack. During the March 2013 L7 and L8 tandem period, cross-calibration study shows that the L7 ETM+ and L8 OLI TOA radiance and reflectance are within ±2% and ±4% respectively [21]. The L7 and L8 under flight studies show that the L8 OLI blue, green, and red bands had consistently lower values than the corresponding L7 ETM+ bands [22][23].
3. The Study Area and the Dataset
3.1. Study Area
The use of vicarious absolute calibration methods for the optical satellite sensors has been well established and demonstrated a high degree of reliability by a variety of studies [24][25][26][27]. It uses the PICS, the locations with temporally and spatially stable earth surface, to monitor the long-term stability of the space-borne sensors. Recent works has shown that the stable atmospheric and surface properties of the PICS continue to be validated with excellent performance for the applications of Landsat absolute calibration and cross-calibration [6][28]. In this study, a PICS location, known as RVPN (WRS2 P040/R033 in Railroad Valley Playa Nevada, United States), served as the basis for time-series analysis. The RVPN is a one of the CEOS (Committee on Earth Observation Satellites) reference standard test site. It is a spatially homogeneous dry-lake playa. The compacted clay-rich lacustrine deposits form a relatively smooth surface (https://calval.cr.usgs.gov/). The central parts of the railroad valley are considered an excellent site for testing radiometric processing techniques, as well as developing and validating the radiometric cross-calibration.
3.2. Landsat Image Stack
We ordered all available Landsat Collection 1 Tier 1 (T1) L4 TM, L5 TM, L7 ETM+, and L8 OLI images (920 Landsat scenes) with less than 20% cloud cover between 1982 and 2016 for Worldwide Reference System (WRS-2) path/row 040/033 from the USGS Earth Resources Observation and Science (EROS) Data Center. The corresponding Pre-Collection Landsat images were also acquired for radiometric comparison.
The Landsat images, both Collection 1 and Pre-Collection, were converted to Top-Of-Atmosphere (TOA) reflectance, and then were atmospherically corrected using the open source software package, the EROS Science Processing Architecture (ESPA). The ESPA is part of the USGS Land Satellite Data Systems (LSDS) Science Research and Development (LSRD) project (https://espa.cr.usgs.gov/). ESPA has been deployed on the NASA supercomputer, NASA Earth Exchange (NEX, https://nex.nasa.gov/), to process these Landsat images. The Landsat Ecosystem Disturbance Adaptive Processing System (LEDAPS) algorithm was used for the L4 TM, L5 TM, and L7 ETM+ images, while the L8 OLI images were atmospherically corrected using Landsat 8 Surface Reflectance Code (LaSRC) [29]. The original LaSRC algorithm was developed using the popular 6SV model for the OLI atmospheric correction [30].
3.3. Selected Landsat Scenes
Four cloud-free Landsat observations corresponding the four Landsat instruments (L4 TM, L5 TM, L7 ETM+, and L8 OLI) of the RVPN (P040/R033) were selected from the time-series Landsat image stack to examine the changes between the Landsat Collection 1 and Pre-Collection (Table 1). For purposes of comparison, 100 random points were spread across the Railroad Valley Playa, NV. The random points locations were constrained by following the procedures reported by Helder et al. [6]. The pixel values of the DN, TOA reflectance, and surface reflectance of each point were extracted from both the processed Landsat Collection 1 and Pre-Collection data.
4. Results
The cross-calibration changes between the Landsat Collection 1 and Pre-Collection were examined in three levels of the Landsat products (i.e. DNs, TOA reflectance, and surface reflectance).
4.1. Quantized Digital Numbers (DNs)
The quantized Landsat pixel values (Q, or digital counts) in the raw Landsat data (Level 0R or 1R) were converted to at-sensor spectral radiance (L_λ). The L_λ
![]()
Table 1. Four “best” estimate dates for landsat images over the rvpn site.
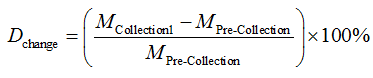
were then scaled to Digital Numbers (Q_cal, or DNs) as Landsat Level 1 products. Previous Landsat programs, like Landsat −4, −5, −7 used 8-bit numbers range between 0 and 255 to exhibit the radiance distribution of the earth surface, while the latest Landsat 8 adopted 12-bit dynamic range (Landsat 8 Data Users Handbook, https://landsat.usgs.gov/landsat-8-l8-data-users-handbook, 2016). The 12-bit L8 Q_cal are scaled to 16-bit integers and delivered as Landsat Level 1 product to the user community. Since the users can only access the Landsat Level 1 product, and the radiometric cross-calibration procedure of Landsat Collection 1 was applied before the step of DNs, which are represented as Q_cal, we explore the Landsat Collection 1 data starting from the DNs. To quantitative estimate of the degree of changes between the Landsat Collection 1 and Pre-Collection, the following equation was used (Equation (1)).
 (1)
(1)
The DN values extracted from the four selected Landsat scenes and the differences between the Landsat Collection 1 and Pre-Collection are presented in Table 2. It indicated that no change had occurred in all the solar reflective bands of the Landsat Collection 1 for L7 ETM+, with less than 0.01% change in L8 OLI data, larger changes have been captured in every single solar reflective band of the L4 TM and L5 TM images (Table 2). Absolute cross-calibration have been implemented to the L4 and L5 TM images. The results that summarized in Tab. 2 reflected the legacy of previous Landsat cross-calibration efforts, where tie the absolute calibration of the TM sensors to the L7 ETM+ [3][7][12].
4.2. Top-of-Atmosphere (TOA) Reflectance
As mentioned above, the DNs of Landsat scenes were converted to at-sensor spectral radiance and TOA reflectance, atmosphere correction was further applied to retrieve the Landsat surface reflectance. Conversion from the DNs (Q_cal) to at-sensor radiance (L_λ) and the TOA reflectance are fundamental steps to cross-calibrate the four Landsat sensors. However, only the variables (i.e. Gain and Bias) that used for the conversion from DNs to at-sensor radiance are relevant to the cross-calibration. The changes of the Gain and Bias determine the changes of cross-calibrated at-sensor radiance and further decide the TOA reflectance values.
![]()
Table 2. The DNs differences between landsat collection 1 and pre-collection images.
In Figure 1, still using the selected 100 pixels to extract TOA and surface reflectance from the image stacks, we show the comparison of Landsat TOA reflectance between the Landsat Collection 1 and Pre-Collection. First thing that can be observed is the larger changes with the two older Landsat sensors (i.e. L4 TM and L5 TM). For the sensors of L4 TM and L5 TM, the probability density function (PDF) distinctions between the red and light green lines suggested that the cross-calibration (±1%) were applied for the two older Landsat sensors. For the L7 ETM+, −0.26% changes were captured during this step, which means the cross-calibration determined Gain and Bias were updated for the L7 ETM+ also. There is almost no change for the L8 OLI (less than −0.01% in Figure 1). The results indicates that the radiometric calibration of the three older Landsat sensor (i.e. L4 TM, L5 TM, and L7 ETM+) have been anchored to that of the L8 OLI.
![]()
Figure 1. Comparison of probability density functions between Landsat Collection 1 and Pre-Collection solar reflective bands (red Collection 1, green Pre-Collection).
The cross-calibration procedures applied for the Landsat Collection 1 dataset finally influences the performance of its surface reflectance. The surface reflectance generated from the USGS ESPA system has been breakdown into sensors and bands in order to reveal where the differences located. Figure 2 shows the comparison from the six solar reflective bands between the Landsat Collection 1 and Pre-Collection archives. The upper panel indicated that the blue, NIR, and SWIR-1 bands have greater changes when compare with that of the rest three solar reflective bands. It is noted that the changes of band NIR and red are −1.751% and 1.253%, which apparently will impact the performance of vegetation indices, like the Normalized Difference Vegetation Index (NDVI). When break down the bands into sensors and bands in lower panel, more details are revealed (Figure 2). Changes from the NIR band were mainly contributed by the L4 TM, L5 TM, and L7 ETM+, however, the red band changes could only be found in L4 TM and L5 TM.
4.3. Normalized Difference Vegetation Index
When apply above changes to the terrestrial remote sensing by using the popular NDVI, the shifts of the NDVI distribution of the three older Landsat sensors (i.e. L4 TM, L5 TM, and L7 ETM+) draw concerns with the previous studies based on the Landsat Pre-Collection data. Figure 3 indicated that the NDVI have been overestimated based on the Landsat Pre-Collection data, especially for the three older Landsat sensors. Based on the Landsat Pre-Collection data, Roy et al. reported that both TOA and surface reflectance derived L7 ETM+ NDVI values are greater than that derived from the L8 OLI [31]. They found that the radiometry difference between L8 OIL and L7 ETM+ in NIR band even influence derived NDVI in 9.88%, though the differences could be reduced as 4.86% when atmospheric corrections are applied. Be noted that the area of interest (AOI) of this study is covered by homogeneous desert surface, and the scattered shrubs don’t dominate the statistic distribution of the calculated NDVI. Figure 3 reveals the NDVI changes in an extreme scenario, while Roy et al. used thousands
![]()
Figure 2. Comparison of probability density functions between Landsat Collection 1 and Pre-Collection band by band (red for Collection 1, light green for Pre-Collection). Upper panel, the all four Landsat sensor observations composed archive. Lower panel, The Landsat observations are broke down into sensors and bands.
![]()
Figure 3. NDVI change between the Landsat Collection 1 and Pre-Collection.
Landsat images to representative range of reflectance spectra (i.e., capturing land cover, land use, vegetation phenology and soil moisture variations) [32].
4.4. Long-Term Trend of the Landsat Collection 1
The essential goal of the new released Landsat Collection 1 dataset is to provide a radiometric consistent archive across the Landsat sensors to support time-series analysis and data stacking (https://landsat.usgs.gov/landsat-collections). Accurate radiometric calibration (consistent radiometric cross-calibration) is a critical step in developing Landsat time-series analysis ready data (ARD) with high quality to perform quantitative remote sensing. Figure 4 shows the temporal evolution of the changes of these cross-calibrations. The long-term trends showed in Figure 4 are fairly similar to both TOA and surface reflectance. It is expected that the cross-calibration for the sensors, tends to eliminate the long-term radiometric shift trend and therefore becomes more sensitive to the earth surface changes. On the other hand, the TOA reflectance changes keep the memory of the seasonal trend in each solar reflective band (left panel of Figure 4).
The plots show in general that, in general the three Landsat sensors L4 TM, L5 TM, and L7 ETM+, band blue seen major cross-calibration. For L5 TM, the blue band reflectance changes (both TOA and surface reflectance) from approximately −10% maximum (before 2003) to +10% maximum. For L7 ETM+, the blue band reflectance changed around −5%. Over the lifetime of the rest solar reflective bands, the time-series changes are very stable. However, when looking the time-series changes of the L5 TM red band, there are twists (less than 5%) at the both ends. The higher cross-calibration changes occurred at the
![]()
Figure 4. Time-series plots of reflectance changes (at-sensor TOA and surface reflectance) from comparison between Landsat Collection 1 and Pre-Collection as measured by the solar reflective bands.
ends forced the time-series L5 TM reflectance consist with both L4 TM and L7 ETM+. For L8 OLI, as mentioned above, there is no change over all the solar reflective bands (both at-sensor TOA and the surface reflectance). It suggested that the cross-calibration model for the Landsat Collection 1 was developed from the absolute calibration marks from the L8 OLI. The observation trend across the four Landsat sensors was anchored to the absolute calibration marks of the L8 OLI.
Figure 5 shows the temporal evolution of the surface reflectance across the four Landsat sensors over the past 30 years. The selected AOI is located at very homogeneous dry-lake playa, so it represents a typical pseudo invariant surface. Over this PICS, the Landsat surface reflectance shows stable long-term trend (upper panel of Figure 5). By examining the time-series surface reflectance, only part of the L4 TM observations (acquired in early 1980s) are still off the time-series. The rest L4 TM observations (acquired at the end of 1980s) are aligning with Landsat time-series perfectly.
The lower panel of the Figure 5 shows more detail of this cross-calibrated Landsat time-series. The data distribution of the long-term observation suggested that after the cross-calibration the performance of the L4 TM is the worst one among the four Landsat sensors. Its data ranges are scattering much wider when compare with that of the rest Landsat sensors. The surface reflectance distribution of the three L4 TM bands (i.e. blue, SWIR1, and SWIR2) shift from the corresponding bands or the rest Landsat sensors. The blue band, however, is the worst band among the Landsat six solar reflectance bands. For the blue band, only the L5 TM and L7 ETM+ align with each other with the data distributions. Even for the blue band of L8 OLI, its cross-calibrated data distribution shifts to the lower part (lower panel of Figure 5).
5. Conclusions
The Landsat Collection 1 Tier 1 and Pre-Collection over a pseudo-invariant site (RVPN) have been utilized for more than 3 decades for radiometric trending assessment of the four popular Landsat sensors (i.e. L4 TM, L5 TM, L7 ETM+, and L8 OLI). Four cloud-free Landsat scenes corresponding the four Landsat sensors have been selected from both Landsat Collection 1 and Pre-Collection image stacks to examine the radiometric characteristics before and after the cross-calibration. The time-series Landsat observations collected from the Landsat Collection 1 and Pre-Collection have been established to investigate the long-term radiometric trending of the Landsat Collection 1. Advantages of the PICS with naturally stable dry-lake surface and little to no vegetation helped to examine the radiometric stability in long-term trend.
The purpose of this paper was to give a first evaluation of the USGS latest released Landsat Collection 1 data for radiometric trending and cross-calibration. To develop radiometric consistent Landsat time-series CDRs requires accurate absolute calibration for each Landsat sensor as well as cross-calibration among
![]()
Figure 5. Lifetime surface reflectance plot for solar reflective bands of the Landsat Collection 1 data across four Landsat sensors (upper panel), and the probability density functions for each bands (lower panel).
the four Landsat sensors. Results from this study lead to two key conclusions. The first is that cross-calibration has been implemented over the whole Landsat Collection 1 process stages. This implies two things. The first is that new absolute calibration procedures have been applied for the L4 TM and L5 TM observations. The second is that relative cross-calibration procedures have been applied to align the radiometric measurements of the four Landsat sensors during the converting DNs into TOA radiance stage. The second conclusion is that the Landsat Collection 1 radiometric reflectance has been anchored to the L8 OLI. Time-series analysis results, both TOA and surface reflectance long-term trending, demonstrated strong support of these suggestions, though there are no USGS published documents to endorse this point. With the L8 OLI’s significantly improved radiometric calibration quality, it has achieved the best ever agreement, in terms of the on-board and vicarious calibration approaches, than the other Landsat sensors [33]. It is suitable to tie the radiometry of the four Landsat workhorse sensors with the L8 OLI.
The cross-calibration between the Landsat sensors, like L4 TM and L5 TM, L4 TM and L7 ETM, L5 TM and L7 ETM+, have been thoroughly studied and documented in past decades. This study indicates that the first four-sensor cross-calibration effort (Landsat Collection 1) is very promising. However, we suggest that Landsat users should pay attention to differences in results from Pre-Collection and Collection 1 time-series data sets.
Ultimately, the USGS new released Landsat Collection 1 provides the best ever radiometric consistent product across the four most popular Landsat sensors (i.e. L4 TM, L5 TM, L7 ETM+, and L8 OLI). It made the longest time-series CDRs possible for regional and global climate change, ecological, land-cover and land-use changes (LCLUC), and environmental remote sensing studies.