Characterization of Polyvinyl Pyrollidone Coated Sodium Borohydride Stabilized Particle Colloidal Silver Fresh None Filtered and Nano Filtered Solution Made up of Magnetic Stirring and Cooling Method ()
1. Introduction
Colloidal metallic nano silver solution exhibits significant importance on fundamental, textile and industrial sector, and also on the metallodielectric silver nanoparticle which also expresses great interest in electrical conductivity in circuit. Colloidal nanosilver particles are vividly used as agents for breakable chemical reaction & optics [1] [2] relevant sensor for biological and chemical products [3] . It also represents the study of lights with no parallel alignment [4] [5] [6] spectroscopy discovered by scientist Raman C V with extended floor (SERS) [7] [8] and the field of electronics and electrical [9] . Photonic crystal study is absolutely a recently created field in universe of nano science which directly has a link and relation with successful characterization of particle colloidal silver. In the recent time, silver nano metals of smallest, smaller, small, bigger and biggest sizes and metallodielectric spheres found new applications in field of photonic crystals [10] [11] [12] [13] [14] to synthesize NaBH4 stabilized and PVP coated colloidal silver nano metal particles by magnetic stirring and cooling method more than one protocols have been developed, but in this manuscript, only specific protocol articulated and others mentioned as material and method section in characterization articles [15] [16] [17] . Sodium borohydrate (NaBH4) and polyvinyl pyrollidone (PVP) [18] are utilized as chemical stabilizer and coater to nanosilver because of the high electronegative characteristic of silver nano metal (+0.483 PDI; −17.52 mV zp). The nanosilver may be coated with reducing agents like citrate which is also called capping agent [19] . It also includes free radicals [19] . Many synthesis methods are famous for the preparation of silver nano metal spheres which are ultimately developed to produce small silver nanoparticles (radius less than 2.75 nm). In this article, we strongly emphasize the characterization of silver nanoparticles after magnetic stirring and cooling synthesis of silver particles in colloidal form with a wide range of small and big sizes and narrow with broad size distribution by reducing silver nitrate with poly vinyl pyrollidone in an aqueous medium and 1.5 molar sodium chloride suspender with sodium borohydried stabilizer. The important properties of silver nanoparticle are shape, size, aggregation state, external surface modification properties, solubility in solution, nano size structure and comprise of chemical constituent with make-up certainly affected silver nanoparticle behavior and toxicity. For silver nanoparticle summarization of synthesis and characterization, a wide range of spectroscopic and biological methods are also available in plenty manner. Dynamic light scattering, zeta potential UV-Vis and infrared spectroscopy and image-j estimation offer the best possibility to characterize silver nanoparticles which are chosen in this work for characterization of size. Especially quantum dots and organic based nanoparticles like fullerenes and carbon nanotubes needs characterization Fourier transformation infrared (FTIR) and UV-Vis spectroscopy which have been used to compare aqueous colloidal suspensions of C60 and this is typically showing similarity to characterization method adopted for various size nanosilver metal [20] . Pesika the main scientist with team also used UV spectroscopy to study the relationship between absorbance spectra and particle size distributions for quantum-sized nanocrystals [21] . Particularly in the case of silver nanoparticles, the UV-Vis absorption spectra have proved to be quite sensitive as the Plasmon peak and full width at half maximum (FWHM) depends on the extent of colloid aggregation [22] . X-ray diffraction (XRD) is a non-destructive technique and can reveal information about the crystallographic structure, size and elemental composition of natural and manufactured materials. It has been widely applied in the characterization of silver and other metal nanoparticles including those synthesized using biological agents. Microscopic techniques can be applied not only to visualize silver nanoparticles but also to generate useful data on the size, shape distribution and other measurable properties [23] . Electron microscopy is one of the techniques that have played a major role on studying silver nanoparticles. Since the early conventional bright field images and the intermediate resolution dark field techniques, to the high-resolution atomic images of nanoparticles the results have shown that indeed the nanoparticles, in the range of a few nanometers, can have well-defined crystal structures [24] . The relationship between the biological activity and size/shape of silver nanoparticles has been investigated. As a general trend, it has been found that smaller particles generally present an enhanced antibacterial power if compared with their larger counterparts. Although little is known about how the biological activity is affected by the silver nanoparticles shape, some scientists have shown that truncated triangular silver nanoparticles present stronger biocidal effect than those presenting spherical or rod-shaped morphologies. However, all studies performed until now have used distinct reactions to synthesize silver nanoparticles with different sizes or shapes. Although, similar trends have been obtained for different groups, the fact of comparing the biological activity of nanoparticles obtained from distinct synthesis was always a point of discussion since the final result could be masked by artifacts coming from different syntheses procedure. This study attempts to made verification of the silver nanoparticle characterization process which was done by the techniques of UV-Vis absorption spectroscopy, transmission electron microscopy (TEM) and dynamic light scattering (DLS) with zeta potential.
1) Material & Methods
All the reagents and chemicals for this silver nanoparticle colloidal solution synthesis and characterization experiment were purchased in raw or powdered form, from Trimurthy Scientific Chemical Organization Pvt. Ltd. Varanasi Uttarpradesh, India.
2) Synthesis of Silver Nano Particle Colloidal Solution
Procedure
Step 1. 30 ml of 0.002 M Sodium Borohydride (NaBH4) added to an Erlenmeyer flask. Conformity achieved that solution used must be made fresh right before the experiment. A 1 inch magnetic stir bar was added and place the flask in an ice bath on a stir plate and stirred. Keeping the Sodium Borohydride (NaBH4) on ice reduce the rate of decomposition during the experiment.
Step 2. 2 ml of 0.001 M silver nitrate (AgNO3) dripped into the stirring fresh NaBH4 solution at approximately 1 drop per second from a graduated bottle fixed with infusion set. Stirring was stopped as soon as all of the AgNO3 is added.
Step 3. The presence of a colloidal suspension can be detected by the reflection of a laser beam from the particles.
Step 4. A small portion of the solution transferred to a test tube. The addition of a few drops of 1.5 M sodium chloride (NaCl2) solution causes the suspension to turn darker yellow, then grey as the nanoparticles aggregate.
Step 5. A small portion of the solution transferred to a test tube. A drop of 0.3% polyvinyl pyrollidone (PVP) added to it. PVP prevents aggregation. Addition of NaCl2 solution then has no effect on the color of the suspension. Slowly PVP solution added to the stirred Silver colloid solution.
Step 6. Silver nanoparticles color the yellow stained glass in medieval churches. To make “stained glass” the mixture decanted into a mold leaving air bubbles [25] .
3) Materials required
Stock Solutions for 8 batches.
・ 0.001 M AgNO3: 0.017 g of AgNO3 was dissolved into 100 ml distilled water. This solution can be kept for later usage.
・ 0.002 M NaBH4: 0.0189 g of NaBH4 was dissolved into 250 ml distilled water. This solution must be made fresh before the experiment.
・ 0.3% PVP solution: 0.1 g of PVP was dissolved into 33 ml distilled water.
4) Equipment (Figure 1)
5) Instrument required
・ Small Erlenmeyer flask.
・ Large dish of ice.
・ Stirrer hotplate.
・ 1" magnetic stir bar.
・ Droppers.
・ Laser pointer.
・ Mold.
6) Characterization of colloidal silver solution done by Figure 2
7) Characterization of silver nano particles
![]()
Figure 1. Synthesis of AgNps colloidal solution by magnetic stirring and cooling method upon a magnetic stirrer.
![]()
Figure 2. (A-D): Methods adopted for characterization of silver nano particles colloidal solution (A), (B). Dynamic light scattering and zeta potential (C). Image-j (D). Transmission Electron Microscopy.
Further, the Silver nanoparticle colloidal solution was observed by TEM (Transmission electron microscopy), DLS (Dynamic light scattering) and Zeta potential for characterization to know particle size and mean, standard deviation, standard error of mean are evaluated from number of particles. Image-J software was also used for this purpose [26] [27] [28] .
8) Procedures for segregating bigger and smaller size silver nano particle of 20 nm mean size (Figure 3)
The procedure adopted for segregating bigger size particles from smaller size particles was to filter the bigger size silver particles colloidal silver with the help of a nano filter device. The device comprises of 2 knobs made up of hard plastic one washer and a fine filter with less than 100 nm pore size. (2 - 20 nm size range) The raw colloidal silver which was freshly prepared and collected inside a 20 ml big syringe with silver foil wrapped and light protected. The shining yellow colored none filtered colloidal silver after filtration becomes amber color the shinning yellow color cause harm to eye ball. The amber colored solution was
![]()
Figure 3. (A-D): (A), (B)-Nano filter device with (C). Falcon tube in which colloidal silver is kept by wrapping silver foil (D). Filtered and non filtered AgNps colloidal solution None filtered AgNps colloidal solution shinning yellow colored Filtered AgNps colloidal solution amber colored.
collected in a properly leveled falcon tube after filtration with silver foil wrapped and light and temperature protected as it was highly sensitive. Both non filtered and filtered colloidal silver bearing falcon tube was properly leveled to differentiate between the two.
9) Transmission electron microscopy
To obtain the size and morphology of the Silver nanoparticles and to get the TEM image of the tissue which is 1, 1.5 and 10 lakh times magnified, TEM processing with viewing performed. TEM analysis of the PVP coated Sodium Borohydried stabilized Silver nanoparticles colloidal solution performed at an accelerating voltage of 100 KV. Silver nanoparticles was examined in the form of colloidal solution suspended in NaCl2 (Ag-1.8 mg/ml) and subsequently deposited on the form var/carbon coated TEM grid. Digital TEM camera was calibrated for size and measurement of the silver nanoparticular mass. Mean, Standard deviation, Individual differences from mean were calculated from procured information measuring over 100 Silver nanoparticles in the random fields of view with addition to it images procured by specific compacted cassettes which is viewed by special software named soft imaging viewer or SIS image viewer that showed general morphology of the scattered silver nanoparticles in the solution.
2. Photography
Analysis and photography of scattered 100 silver nanoparticles in the random fields of view in the solution was done under FEI Tecnai G2 spirit twin transmission electron microscope equipped with Gatan digital CCD camera (Netherland) at 60 or 80 KV.
1) Statistical analysis
Percentage of outputs evaluated from each groups and finally the percentages were compared between and within various size group nanosilver. Continuous data were compared by the application of one way ANOVA, Manova, post hoc, multiple comparison Dunnett test, F, t test, Newmann Keul test and descriptive statistics. Mean, standard deviation, standard error of mean were evaluated. Differences were considered significant when evaluated P value shows less than 0.005 (P < 0.005).
2) Result
3) Characterization of silver nano particles colloidal solution
With an aim to know the exact size and diameter of all the silver nano particles in nano meter (nm) scale the present study was undertaken. AgNps colloidal solution was used to estimate mean and standard deviation of the particle size. Successful characterization of the fresh prepared AgNps colloidal solution by the process of Dynamic light scattering, zeta potential, Transmission electron microscopy and Image-J estimation was done which led to proper segregation of bigger and smaller size silver nanoparticles from none filtered (a(fresh), a1(preserved)) and nano filtered (b(fresh), b1(preserved)) AgNps colloidal solution.
4) Dynamic light scattering by DelsaTM Nano Common Beckman Coulter machine showing intensity distribution and auto correlation function
5) Overall none filtered colloidal AgNps solution analysis (a (fresh), a1 (preserved))
The Dynamic light scattering (DLS) yielded 2 types of result such as distribution result and cumulative result. The DLS analysis (distribution result) of none filtered colloidal silvernano solution (a) resulted in form of 5 peak values its Diameters, standard deviation analyzed from intensity distribution and auto correlation function (ACF) graph. The analysis is shown in Table 1 given below.
The average diameter liberated by Beckman Coulter from distribution result was 6151.2 nm with standard deviation 10,181.3 (6151 ± 10,181.3). The cumulative result part from analysis liberated by DelsaTM Nano Beckman Coulter purchased from United Kingdom was shown to be 1340.3 nm as average diameter of all bigger silver nanoparticles. The poly dispersity index value of the same
![]()
Table 1. The DLS (distribution result) analysis of none filtered colloidal silver solution (a) resulted in form of 5 peak values its diameters, standard deviation analyzed from intensity distribution and ACF graph shown in Table 1.
colloidal silver (a) liberated by the same machine was 0.538 at a measurement condition when temperature is maintained 25.1˚C inside the water diluents of the colloidal silver with refractive index 1.3328 and viscosity 0.8858 and scattering intensity was found to be 11101 (CPS) (Figure 4).
The distribution result part of DLS analysis of none filtered colloidal silver solution (a1) also yielded by Beckman Coulter in form of 5 peak values its diameters, standard deviation analyzed from intensity distribution and ACF graph shown in Table 2 given below.
The average diameter of colloidal silver (a1) liberated by Beckman Coulter was 6750.8 nm with standard deviation 10,979.6 (6750.8 ± 10,979.6) which is seen moderate higher in comparison to colloidal silver (a). The cumulative
![]()
Figure 4. Intensity distribution and ACF graph after DLS analysis of none filtered colloidal silver solution (a) showing distribution result in the form of peak, diameter (nm), std.dev., average with poly dispersity index and diffusion constant.
![]()
Table 2. The DLS analysis of none filtered colloidal silver solution (a1) also resulted in form of 5 peak values its diameters, standard deviation analyzed from intensity distribution and ACF graph table.
analysis of the same (a1) liberated by Beckman Coulter was 1944.9 nm as average diameter of all bigger silver nanoparticles scattered in matrix of solution which showed significant increase in average size of silver nanoparticles present in colloidal silver (a1) in comparison to colloidal silver (a) as the concentration and agglomeration of silver particle in colloidal solution increase. The poly dispersity index of the same colloidal silver (a1) liberated by Beckman Coulter was 0.722 which also showed increase PDI in comparison to colloidal silver (a) at a measurement condition when temperature is maintained 25.1˚C inside the water diluents of the colloidal silver with refractive index 1.3328 and viscosity 0.8858 and scattering intensity having 11101 (CPS). The refractive index, viscosity and scattering intensity of colloidal solution (a1) is found similar to colloidal solution (a). The increments of all those parameters of colloidal silver (a1) found significant (P < 0.001) (Figure 5).
The overlay graph of normalized intensity distribution analysis of colloidal silver (a) liberated by Beckman Coulter machine showed, 2 phase analysis of PI with values 0.483 & 0.517 with average calculated 0.483 + 0.517/2 = 0.500 which more or less matches with PI liberated in Cumulant analysis (0.538) by intensity distribution & ACF graph of colloidal silver (a). 2 phase analysis of Diameter of 10% silver nanoparticles of colloidal silver (a) showed 200 to 373.2 nm ranges
![]()
Figure 5. Intensity distribution and ACF graph of DLS analysis of none filtered colloidal silver (a1) showing distribution result part in the form of peak, diameter (nm), std.dev., average with poly dispersity index, and diffusion constant.
and 200 to 324.6 nm ranges, Diameter of 50% silver nanoparticles showed 200 to 1011.1 nm ranges and 200 to 896.6 nm ranges, Diameter of 90% silver nanoparticles showed 200 to 3147.1 nm ranges and 200 to 3199.0 nm ranges. The overall average size of bigger silver nanoparticles of colloidal silver (a) resulted 200 to 1378.8 nm ranges (Figure 6).
The over lay graph of normalized intensity distribution analysis of colloidal silver (a1) yielded 2 phase analysis of PI by Beckman Coulter machine with values 0.722 & 0.538 with average calculated 0.722 + 0.538/2 = 0.630 which increased significantly (P < 0.001) from the PI value of normalized intensity distribution analysis by overlay graph of colloidal silver (a). 2 phase analysis of diameter of 10% silver nanoparticles of colloidal silver (a1) scattered in matrix of solution showed 200 to 204.2 nm ranges and 200 to 189.9 nm ranges, Diameter of 50% silver nanoparticles showed 200 to 685.4 nm ranges and 200 to 288.5 nm ranges, Diameter of 90% silver nanoparticles showed 200 to 23,286.7 nm ranges and 200 to 23,080.1 nm ranges. The overall average size of bigger silver nanoparticles of colloidal silver (a1) calculated 200 to 1642.6 nm ranges. The overall increments of values found significant (P < 0.001) in comparison to bigger silver nanoparticles of colloidal silver (a) (Figure 7).
![]()
Figure 6. Overlay graph of normalized intensity distribution analysis of none filtered colloidal silver (a) showing pH, average diameter, PDI, segregated analysis of 10%, 50% and 90% silver nanoparticles size in nm range and its overall average.
![]()
Figure 7. Overlay graph of normalized intensity distribution analysis of none filtered colloidal silver (a1) showing pH, average diameter, PI, segregated analysis of 10%, 50% and 90% silver particles size in nm range and its overall average.
6) Overall nano filtered colloidal AgNps solution analysis (b (fresh), b1 (preserved))
The DLS analysis of nano filtered colloidal silver solution (b) yielded by Beckman Coulter liberated in form of 5 peak values its diameters, standard deviation analyzed from intensity distribution and ACF graph shown in Table 3 given below.
The average diameter in distribution result part yielded by Beckman Coulter machine liberated 1500.1 nm with standard deviation 1317.7 (1500.1 ± 1317.7). The cumulative analysis of the same yielded by Beckman Coulter machine liberated 200.1 nm as average diameter of all smaller silver nanoparticles. The poly dispersity index of the same colloidal silver (a) yielded by Beckman Coulter machine liberated 0.483 at a measurement condition when temperature is maintained 25.8˚C inside the water diluents of the colloidal silver with refractive index 1.3327 and viscosity 0.8719 and scattering intensity having 6453 (CPS) (Figure 8).
The DLS analysis of nano filtered colloidal silver solution (b1) yielded by Beckman Coulter machine liberated in form of 5 peak values its diameters, standard deviation analyzed from intensity distribution and ACF graph shown in Table 4 given below.
![]()
Table 3. The DLS analysis of nano filtered colloidal silver solution (b) yielded by Beckman Coulter liberated in form of 5 peak values its diameters, standard deviation analyzed from intensity distribution and ACF graph table.
![]()
Table 4. The DLS analysis of nano filtered colloidal silver solution (b1) also yielded by Beckman Coulter machine liberated in form of 5 peak values its diameters, standard deviation analyzed from intensity distribution and ACF graph table.
![]()
Figure 8. Intensity distribution and ACF graph of DLS analysis of nano filtered colloidal silver (b) showing distribution result in the form of peak, diameter (nm), std.dev., average with poly dispersity index and diffusion constant.
The average diameter yielded by Beckman Coulter machine liberated 1372.9 nm with standard deviation 1415.9 (1372.9 ± 1415.9). The shown value which significantly decrease from the value of smaller particle colloidal silver. (b) The cumulative analysis of the same yielded by Beckman Coulter machine liberated 71 nm as average diameter of all smaller silver nanoparticles. The poly dispersity index of the same colloidal silver (b1) yielded by Beckman Coulter machine liberated 0.461 which significantly decreased from PI value of colloidal silver (b) at a measurement condition when temperature is maintained 25.8˚C inside the water diluents of the colloidal silver with refractive index 1.3328 and viscosity 0.8878 and scattering intensity having 6292 (CPS) (Figure 9).
The overlay graph of normalized intensity distribution analysis of nano filtered colloidal silver (b) yielded by Beckman Coulter machine liberated 2 phase analysis of PI with values 0.679 & 0.243 with average calculated 0.679 + 0.243/2 = 0.461 which decrease significantly (P < 0.001) from the value of normalized intensity distribution analysis by overlay graph of bigger particle colloidal silver (a & a1). 2 phase analysis of diameter of 10% smaller size silver nanoparticles colloidal silver yielded by Beckman Coulter machine liberated 2.3 to 5.2 nm ranges with average 3.75 nm, diameter of 50% smaller size silver nanoparticles yielded by Beckman Coulter machine liberated 71 to 717.5 nm ranges and 30.5 to 30.5 nm ranges with an average of 71 to 374 nm ranges, Diameter of 90% smaller size silver nanoparticles yielded by Beckman Coulter machine liberated 71 to 3605.5 nm ranges and 71 to 198.1 nm ranges. The overall average size of smaller silver nanoparticles of colloidal silver yielded by Beckman Coulter machine liberated 71 to 300.1 nm ranges. The overall decrease of values found
![]()
Figure 9. Intensity distribution and ACF graph of DLS analysis of nano filtered colloidal silver (b1) showing distribution result in the form of peak, diameter (nm), std.dev., average with poly dispersity index and diffusion constant.
significant (P < 0.001) in comparison to bigger silver nanoparticles of colloidal silver (a & a1) (Figure 10).
The overlay graph of normalized intensity distribution analysis of nano filtered colloidal silver (b1) yielded by Beckman Coulter machine liberated 2 phase analysis of PI with values 0.479 & 0.223 with average calculated 0.479 + 0.223/2 = 0.351 which decrease significantly (P < 0.001) from the value of normalized intensity distribution analysis by overlay graph of bigger particle colloidal silver (a & a1). 2 phase analysis of diameter of 10% smaller size silver nanoparticles colloidal silver (b1) yielded by Beckman Coulter machine liberated 2.3 to 5.2 nm ranges with average 3.75 nm, diameter of 50% smaller size silver nanoparticles (b1) yielded by Beckman Coulter machine liberated 21 to 117.5 nm ranges and 30.5 to 30.5 nm ranges with an average of 21 to 74 nm ranges, Diameter of 90% smaller size silver nanoparticles yielded by Beckman Coulter machine liberated 21 to 360.5 nm ranges and 21 to 198.1 nm ranges. The overall average size of smaller silver nanoparticles of colloidal silver yielded by Beckman Coulter machine liberated 21 to 71.1 nm ranges. The overall decrease of values found significant (P < 0.001) in comparison to bigger silver nanoparticles of colloidal silver (a & a1) (Figure 11).
7) Zeta potential analysis of none and nano filtered fresh and preserved colloidal silver (Figure 12).
![]()
Figure 10. Overlay graph of normalized intensity distribution analysis of nano filtered colloidal silver (b) showing pH, average diameter, PI, segregated analysis of 10%, 50% and 90% silver particles size in nm range and its overall average.
![]()
Figure 11. Overlay graph of normalized intensity distribution analysis of nano filtered colloidal silver (b1) showing pH, average diameter, PI, segregated analysis of 10%, 50% and 90% silver particles size in nm range and its overall average.
The zeta potential analysis of the none and nano filtered fresh and preserved particle colloidal silver yielded by Beckman Coulter liberated −17.52 mV zeta potential value in common, same for all type of colloidal solution. Mobility yielded by Beckman Coulter liberated −1.369e−004 (cm2/Vs) in common, same for all type of colloidal solution which indicates that colloidal solution is thin in nature. Conductivity rate of the current in all types colloidal solution showed 0.4356 (mS/cm). Zeta-potential analysis of individual flow cells of all types of colloidal silver yielded by Beckman Coulter liberated in the following form that is upper surface −52.08 (mV) and lower surface 9.63 (mV). The Doppler shift of all types of solution showed 10.7 Hz .The base frequency of all types of solution showed 124.8 Hz. The refractive index of all types of solution showed 1.3328 with dielectric constant 78.3. The viscosity of all types of colloidal silver showed 0.8858 which proofs that the colloidal solution is thin and it contains mixture of smaller particles both which easily allows the current to pass fast through the solution. The average electric field for all types of colloidal solution showed −16.18 V/cm. The average amount of current pass through all types of colloidal solution showed −0.36 mA which also indicates all types of colloidal silver solutions are thin in consistency and it allow the current to pass easily through the
![]()
Figure 12. Zeta potential analysis of none & nano filtered fresh and preserved particles colloidal silver showing zeta potential value, mobility, conductivity value of the current passing through the solution. Zeta potential value of the cell upper and lower surface. Its Doppler shift, refractive index, viscosity of the colloidal. It also shows Avg. electric field and Avg. current rate.
field. Agglomeration of solution which causes inflammation and increase in size of the silver nanoparticles has no relation to rate of conductivity of electric current in matrix of the solution.
8) Spectroscopic evaluation of silver nanoparticles size from nano filtered colloidal silver
The primary size of the silver nanoparticles evaluated by spectroscopic analysis from original nano filtered colloidal silver. The spectroscopy found, highest absorbance (almost 0.35) at liberation of 400 nm wave length inside the colloidal silver solution field due to highest excitement whereas lowest absorbance is achieved (almost 0.07) when 600 nm wave length was liberated inside the original colloidal field due to lowest excitement. So this analysis indicates the solution must be thin in consistency and low in density and it must contains smaller size silver nanoparticles (2 to 5.2 nm range) because at lowest wave length liberation from spectroscope colloidal silver showed highest absorbance and highest excitation (Figure 13).
9) Result of Image-J analysis of none filtered colloidal silver (Figure 14)
![]()
Figure 13. Spectroscopic analysis of nano filtered smaller particles colloidal silver showing rate of emission wave length and its respective absorbance value inside colloidal silver.
![]()
Figure 14. (A-B): Image-J analysis of none filtered bigger particles colloidal silver photo showing mean, standard deviation, minimum & maximum size of particles and area of photograph (Image 5 of bigger particles).
8 transmission electron microscopy photograph of bigger particles none filtered colloidal silver obtained and edited by Image-J software. They resulted in the following form:
Image 1 Bigger Particle mean size-: 220.040 nm
Image 2 Bigger Particle mean size-: 208.010 nm
Image 3 Bigger Particle mean size-: 232.076 nm
Image 4 Bigger Particle mean size-: 200.111 nm
Image 5 Bigger Particle mean size-: 238.069 nm
Image 6 Bigger Particle mean size-: 222.010 nm
Image 7 Bigger Particle mean size-: 196.077 nm
Image 8 Bigger Particle mean size-: 201.055 nm
Over all mean of the bigger particle size = 214.618 nm
The maximum particle size of bigger particles calculated 255 nm and minimum size evaluated by Image-J software 2.3 to 0 nm. Respective mean, standard deviation, minimum, maximum and total area that was scanned and evaluated by Image-J of image 1to 8 of TEM plot of bigger particle colloidal silver which calculated, the overall mean of bigger particles is 214.618 nm with over all standard deviation is 124.628 (214.618 ± 124.628) (Graph 1), showing here only Image-J analysis of Image 5 of bigger particle.
10) Image-J analysis of smaller particles nano filtered colloidal silver (Figure 15)
6 transmission electron microscopy photograph of smaller particles nano filtered colloidal silver obtained and edited by Image-J software. They resulted in the following below form:
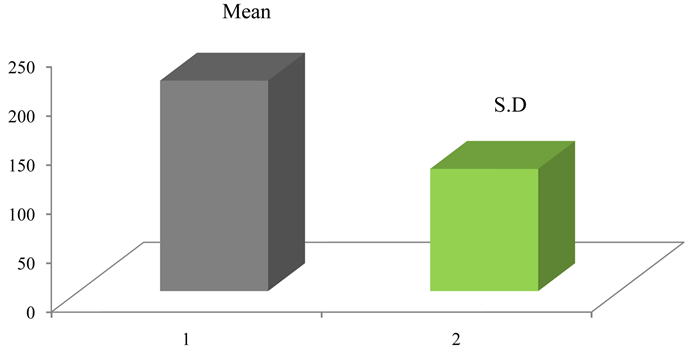
Graph 1. Mean and standard deviation overall size of all bigger particles.
![]()
Figure 15. (A-B): Image-J analysis of nano filtered smaller particles colloidal silver photo showing mean, standard deviation, mode, minimum & maximum size of particles and area of photograph (image 4 of smaller particle).
Image 1 smaller Particle mean size-: 8.503 nm
Image 2 smaller Particle mean size-: 10.909 nm
Image 3 smaller Particle mean size-: 8.604 nm
Image 4 smaller Particle mean size-: 71.56 nm
Image 5 smaller Particle mean size-: 10.808 nm
Image 6 smaller Particle mean size-: 9.706 nm
Over all mean of the smaller particle size = 20.015 nm
The maximum particle size of smaller particles calculated 255 nm and minimum size evaluated by Image-J soft ware 0 nm. Respective mean, standard deviation, minimum, maximum and total area that was scanned and evaluated by Image-J of image 1to 6 of TEM plot of smaller particle colloidal silver resulted, the overall mean of smaller particles is 20.015 nm with over all standard deviation is 12.628 (20.015 ± 12.628) (Graph 2) showing here only Image-J analysis of Image 4 of smaller particle.
11) Summary and histogram comparison of bigger and smaller silver nanoparticles
The summary of mean of image 5 of bigger particle calculated 238.069 nm. Over all mean out of 8 bigger particles TEM image under gone Image-J analysis and calculated 214.618 nm and Mean ± S.D. of 8 bigger particles images calculated 214.618 ± 124.628 where as the histogram of image 5 of bigger particle generated Mean ± S.D. value 233.132 ± 66.921. This more or less matches when going for comparison between the two (Figure 16).
At the same time, the summary of mean of image 4 of smaller particle calculated 71.56 nm. Over all mean out of 6 smaller particles TEM image under gone Image-J analysis calculated 20.015 nm and Mean ± S.D. of 6 smaller particles images calculated 20.015 ± 12.628 where as the histogram of image 4 of smaller particle generated Mean ± S.D. value 143.298 ± 126.518. Here the analysis merely differentiated (Figure 16).
The overall comparison between bigger and smaller silver nanoparticles from the angle of summary and histogram of Image-J says present study used silver nanoparticles size ranged between 20.015 to 71.1 nm in maximum percentage

Graph 2. Mean and standard deviation overall size of all smaller particles.
![]()
Figure 16. Image-J analyses of none & nano filtered bigger & smaller particles colloidal silver histogram and summary and comparison between the two.
from total whereas rest of all measured 71.56 to 200.1 nm size ranged.
12) Comparison of line graph, fractal box count and surface plot between bigger and smaller silver particle
The upper mention Figure 17 generated by Image-J which compares between bigger and smaller particles of study used none and nano filtered colloidal silver says line graph of image 5 of bigger particles shows bigger size column graphs where as image 4 of smaller particles shows significant smaller column graphs and less amount in comparison to the bigger particles. The fractal box count of image 5 of bigger particles calculated D = 1.9823 whereas the fractal box count of image 4 of smaller particles calculated D = 1.8504 which is less value in comparison to image 5. The surface plot generated by image 5 also indicates the sizes of bigger particles are significantly bigger in comparison to image 4 of smaller particles. The status of surface plot of image 4 of smaller particles indicates the same.
13) Particle characterization by transmission electron microscopy (Figure 18)
8 plots of bigger particles TEM images resulted average size of bigger silver nanoparticles ranged from 1300 nm to 1900.8 nm whereas 6 plots of smaller particles TEM images resulted average size of smaller silver nanoparticles ranged from 2.75 to 71 nm. The overall size of all silver nanoparticles ranged from 71 to 200 nm (Figure 19).
There is close approximation observed in dynamic light scattering, zeta potential, Image-j estimation and transmission electron microscopy process after making a comparison of a with a1 and b with b1 type of AgNps colloidal solution after characterization and segregated size estimation.
3. Discussion
The characterization of 4 types of silver nano particles colloidal solution is a vital step done in the beginning phase of this present study which reveals primary size of the study used silver nano particles by dynamic light Scattering, zeta potential, image-j estimation and transmission electron microscopy (TEM) and for their agglomeration in cell medium by photon cross correlation spectroscopy (PCCS)
![]()
Figure 17. (A-F): Image-J analyses of none & nano filtered AgNps colloidal solution (A-C) bigger (5); (D-F) smaller (4) particles colloidal silver showing comparison of line graph, fractal box count and surface plot between the two.
and ultraviolet-visible (UV-vis) spectroscopy, which is ultimately resulted 20 to 71.1 nm mean ranges though close approximation in analysis found in between all procedures . Representative of TEM pictures of the bigger and smaller AgNps were showed. The TEM images of the poly vinyl pyrollidone (PVP) coated AgNps dispersed and suspended in 1.5 molar sodium chloride (NaCl2) confirmed the primary silver nanoparticle size stated by the manufacturers while buying it from market in raw powdered form called silver nitrate (AgNO3) and also in all types of colloidal AgNps solution. Among these, silver precipitation in aqueous colloidal media which is most commonly used in experiment because it is easy, cheap, and versatile. Silver nanoparticle nature is guided by precipitation technique which offers best possibilities by changing the experimental parameters, such as reactant concentrations, temperature, pH, reducing agents, and stabilizers [15] [29] [30] . The uncoated bigger silver nano particles found heterogeneous distribution within the average ranges of 71.1 to 300.1 nm, most of the
smaller being around 20 to 71.1 nm ranges. Changes in hydrodynamic size distribution and state of agglomeration of all size types of AgNps monitored directly after dispersion and suspended after 0 h and after 8 h as well as 24 h in NaCl2 medium are presented as by volume, density distribution and size together
![]()
![]()
Figure 19. (A-B): TEM mode comparison of Mean ± S.D. of overall sizes of bigger and smaller nanoparticles of none and nano filtered colloidal silver.
with the changes in scattered light intensities for the corresponding time points. The silver nanoparticle size distribution by volume (D10, D50 and D90) is included as Table 5.
1) 2 phase analysis of bigger silver nanoparticles (Table 6)
2) 2 phase analysis of smaller silver nanoparticles
When interpreting the data it was noted that the intensity of the scattered light increases non-linearly with increasing nanoparticle size due to agglomeration, and that two processes hence occur simultaneously, agglomeration (increased intensity) and sedimentation (reduced intensity). Furthermore, there is a risk of overestimation of the proportion of small silver particles in the size distributions curves due to rotational diffusion that can take place for non-spherical particles and give rise to a peak at small particle sizes (<3 nm). Furthermore, it is also possible to synthesize and characterize composite bigger and smaller silver nanoparticle and silver ions (Ag+) [31] [32] [33] . Because of the high electropositive character of silver (+0.799/−16.18 v/cm2 V36), agents which reduces in various reaction [15] which also includes free radicals and peroxidases, [34] sodium borohydrate (NaBH4), [35] can be used as stabilizer for colloidal solution for prolong duration preservation. However, most protocols in synthesis and characterization is famous for the preparations of spherical silver nanometals were designed to produce small particles (radius 2 to100 nm ranges). Coating of colloidal particles with a poly vinyl pyrollidone layer has many advantages, because it allows for surface modification and deaggregation, decreases the poly
dispersity index of the particles and makes the colloidal solution thinner. It boosts colloidal solution stability by depleting Van Der Wall force on wall. Poly vinyl pyrollidone acts as successful coating agent for many metal nanoparticle especially silver nanoparticle which helps in deaggrgation and agglomeration ultimately causes for increase size of the particle due to inflammation [36] - [42] . poly vinyl pyrollidone directly over surfactant stabilized silver particles was reported recently in an experimental work by one of the eminent scientist [43] . In this article, we describe the characterization of silver particles of a wide range of bigger sizes and narrow size distribution by reducing silver nitrate with sodium borohydried in an aqueous medium with poly vinyl pyrollidone mixed as deaggregator agent. The various sizes silver nanoparticle morphology was studied by dynamic light scattering, zeta potential, image-j estimation and transmission electron microscopy. Electrical conductivity response on multiple silver nanoparticle level and colloidal solution matrix was studied by means of zeta potential and simulated to scattering theory. The results showed that particle agglomeration as well as sedimentation, indicated by a reduction of the scattered light, and adding a drop of poly vinyl pyrollidone into it as a deaggregator agent was evident for all AgNps with time but there was a clear difference between the citrate coating and PVP coatings though citrate coating is not the part of this study. By use of the procedure described above, we obtained spherical but irregular and spiny silver nanoparticle with a radius in the ranges from 71.1 to 300.1 nm as bigger size range and 20 to 71.1 nm as smaller size range. Particle poly dispersity index was more difficult to control and was varied according to size range. (Bigger PI = 0.722 and Smaller PI = 0.483) However, poly dispersity found as low as 14.6% was achieved in several samples (Table 7).
The particles are spherical aggregates with a rough surface where the roughness is on the order of a few nanometers. The particle upper and lower surface
![]()
Table 7. Radius (R) and Polydispersity (δ) of silver particles obtained at different experimental conditions as determined by TEM.
charge is determined by the polyvinyl pyrollidone layer. The surface charge plays an important role in the particle self-organization after sedimentation in aqueous suspensions. In poly vinyl pyrollidone coated silver nanoparticle the presence of an inert dielectric layer around metal nanoparticle allows tailoring their properties and interaction potential. For instance, a thin (∼16 nm) poly vinyl pyrollidone layer is sufficient to screen the Van Der Waals attraction hold responsible for increase of the silver nanoparticle stability. The most important factor observed while conducting coating process is the stability of the initial colloidal suspension at the reaction conditions (high pH and temperature). The 71.1 nm PVP coated AgNps initially showed a trimodal size distribution, with peaks centered approximately at 71, 300.15 and 1901.8 nm. The two larger modes refer to agglomerates, also seen from the TEM and DLS investigation, and are expected due to the high ionic strength in the NaCl2 medium. The peak at 1901.8 nm refers both to particles of this size and to the rotational diffusion effect, as described above. After 8 h, the two larger modes were shifted towards larger sizes indicating further agglomeration. However, after 24 h the size distribution was similar as the initial observations with smaller size particle/agglomerate distributions. An evident reduction in scattered light intensity with time indicated fewer particles in solution and thus, the discrepancy between 8 h and 24 h is predominantly explained by sedimentation of the largest particles from which follows a reduced intensity and reduced size distribution of particles still in solution. The 20 nm PVP coated NaBH4 ( Sodium Borohydried) stabilized AgNps agglomerated directly after dispersion (0 h), were less stable with time in NaCl2 medium, and sedimented to a larger extent when compared with the 2.31 nm PVP coated AgNps. The latter after nano filtration procedure the silver nano particles showed mostly small particles (<3 nm) even after 24 h, and only a low amount of agglomerates of larger sizes. Also the scattered light intensity was relatively stable with time, indicating a higher stability due to NaBH4 (Sodium Borohydried). The observed differences in agglomeration and sedimentation behavior of the none filtered and nano filtered PVP coated 20 nm particles were further confirmed by UV-Vis measurements, showing a reduced absorbance with time for the no filtered PVP coated particles due to sedimentation. The rate of sedimentation was higher for the no filtered PVP coated particles as compared to the nano filtered PVP coated AgNps, in agreement with the PCCS findings. Also there was a slight broadening of the peaks with time, explained by the formation of larger agglomerates. The freshly prepared 20 nm PVP coated AgNps had a trimodal size distribution, with the peaks broadening out with time up to 8 h. The proportion of the peak of the largest agglomerates (1908.1 - 3173.5 nm) was reduced and vanished after 24 h. Similar to findings for the 20 nm PVP coated particles, the intensity of the scattered light was reduced at the same time as the size distribution became bimodal and more narrow again due to further agglomeration of the smallest particles and sedimentation of the larger agglomerates. The 20 nm PVP coated AgNps initially showed a trimodal distribution and an increased agglomeration with time. After 24 h the larger agglomerates sedimented and the smaller particles became more agglomerated. The uncoated AgNps also agglomerated with time but, after 24 h there were no large agglomerates (>200 nm) in solution. This might be explained by a higher rate of agglomeration for the uncoated particles, resulting in large agglomerates that due to sedimentation were not detected. The observed presence of silver particles sized less than <71 nm has been verified for the same batch of AgNps elsewhere. The zeta potential analysis was done by the same machine. The DelsaTM Nano C, Beckman Coulter machine purchased from United Kingdom. None filtered and nano filtered AgNps colloidal solutions were used in this analysis. Both type particles showed EOS plot −17.52 mV (zeta potential) and mobility distribution −1.369c−004 (cm2/Vs). The machine measured conductivity of 0.4356 (mS/cm). The calculated Doppler shift was found 10.90 Hz for larger and smaller sized particle with a base frequency of 124.8 Hz. Dielectric constant showed 78.3 for both fresh made solution. Base on the results of zeta sizer instrument, hydrodynamic size distribution of AgNps in the suspended powder stock solution, ranged from about 20 to over 200 nm; with a mean average size (ZAve) of 71.2 µm (198.1 nm). In the colloidal solution, hydrodynamic size distribution of AgNps ranged from 71.2 to 1908.1 nm and the zeta average (mean particles size) was 20.0 - 200 nm; also in this case, totally tree classes of particles were distinguishable: 200 - 348.9 nm (10), 200 - 953.85 nm (50%), and 200 - 3173.5 nm (90%). Also according to zeta sizer instrument % information, zeta potential of colloidal and suspended powder AgNps had an average of EOS plot −17.52 mV and +41.03 ± 0.13 mV respectively. A zeta potential range from ±40 to ±60 mV is a sign of good stability for colloids. (ASTM, 1985) The colloidal AgNps observed by TEM were spherical in shape, with a maximum diameter of 200nm: 90% of the particles had diameters between 200 and 3173.5 nm, just 10% of the particles had diameters more than 100 nm, and the CMD (count median diameter) for the particles was 71 nm. Also the geometric mean diameter (GMD) and geometric standard deviation (GSD) of colloidal silver nano particles were 33.9 nm and 7.1 nm respectively. The AgNps colloidal solution dried to powdered form stalk on tungsten grid observed by TEM were spherical in shape, with a maximum diameter of 20 - 25 nm: 85.97% of the particles had diameters between 11 and 24 nm, just 10% of the particles had diameters more than 100nm, and the CMD for the particles was 374 nm. Also the GMD and GSD nano filtered silver nanoparticles were 2.7 nm and 1.1 In the case of suspended powder AgNps, TEM images showed that in an aqueous environment the silver nano particles clumping and form large aggregates, many of which are larger than 200nm. This result is consistent with the results of hydrodynamic size distribution which was obtained from the dynamic light scattering method (zeta sizer). Electron dispersive X-Ray study (EDX) analyses were confirmed that only elemental silver was presented in both colloidal and dry powdered AgNps. According to the ICP-OES results, the concentrations of Ag ions in the acid digested stocks of colloidal and suspended powder AgNps were 1908.1 and 447.2 mg・l−1, respectively. Also results of the XRD pattern confirms the crystallinity of powdered type AgNps and presence of elemental crystalline silver, also other phases, except metallic silver, were not present in the sample. In addition the XRF results showed that purity of powdered type AgNps was 97.86%.The spectroscopic examination and size evaluation of the silver nanoparticles resulted also 20 to 200 nm range with highest absorbance (0.35) at 400 nm wave length and lowest absorbance (0.075) at 600 nm wavelength. The image-j estimation of the TEM images also yielded same result as DLS, zeta potential, TEM and spectroscopy that is the present study used particle size ranged between 20 to 200 nm sizes.
4. Conclusion
The characterization of silver nano particle colloidal solution indicates the mean of silver nano particles size varies between 20 - 71.1 nm ranges (smaller) and 71.1 to 300.1 nm ranges (bigger) which more or less matches with Image-j, DLS and TEM analysis. The smallest particles mean size measured 2.3 to 20 nm. In conclusion, AgNps of 20 nm mean size in hydrodynamic diameter and with a zeta potential of −17.52 mV expresses significant cytotoxicity. In conclusion, we developed a unique magnetic stirring and cooling method to synthesize large and small silver colloidal particles with multi radius larger than 100 nm and smaller than 20 nm via controlled aggregation by poly vinyl pyrollidone coated silver nanoparticles after. After agglomeration, smaller particles flow in medium of matrix of colloidal solution and bigger particles settle at bottom of the solution as sediment after sedimentation process. The remaining smaller silver nanoparticles are spherical but irregular and spiny aggregates with a low polydispersity (<14.6%) and surface roughness on the order of 2.3 nm, as determined by transmission electron microscopy. The particles were coated with a protective poly vinyl pyrollidone layer. The overall zeta potential analysis of all types of experiment used AgNps colloidal solution found −17.52 mV which is nothing but the capacity of electrical conductance inside matrix of solution. More or less there is close approximation found between dynamic light scattering, zeta potential, Image-j estimation and transmission electron microscopy analysis for all fresh and preserved types of bigger and smaller nanosilver colloidal solution regarding characterization and segregated size estimation. The overall estimation shows there is very kin difference between a with a1 and b with b1 type of AgNps colloidal solution which is coated with protective poly vinyl pyrollidone and stabilizer NaBH4.
Acknowledgements
We thank Dr Royana Singh (Proctor Banaras Hindu University) for inspiring this research and Dr Sanjay Singh (IIT, BHU Pharmaceutical division) for characterization process which includes DLS and zeta potential analysis. We also thank Dr Chatterji and Mr. L.K. Chauhan for transmission electron microscopy and himself did image-j estimation and analysis. This work is part of the research program of Department of Anatomy Institute of Medical Sciences, Banaras Hindu University, which is financially supported by the University Grant Commission, India.
Conflict of Interest
Panels of author and co authors declare no conflict of interest.
Abbreviation
SERS: Surface Enhanced Raman Spectroscopy, NaBH4: Sodium Borohydried, PVP: Poly Vinyl Pyrollidone, PDI: Poly Dispersity Index, DLS: Dynamic Light Scattering, ZP: Zeta Potential, FTIR: Fourier Transformation Infra Red, UVVis: Ultra Violate Visa Vis, TEM: Transmission Electron Microscopy, mV: milli Volt, zp: zita potential, AgNO3: Silver nitrate, NaBH4: Sodium Borohydride, NaCl2: Sodium chloride, SIS: Soft Imaging System viewer, FWHM: Full Width at Half Maximum, XRD: XRay Diffraction, ACF: Auto Correlation Function, cps: cycle per second, cp: cycle per, MG: Milli Gram, CCD: Computerized Captured Device, FEI: Fourier Electron Image, ANOVA: Analysis of Variance, MANOVA: Multi Analysis of Variance, AgNps: Silver nanoparticles, nm: nanometer, NID: Normalized Intensity Distribution, PCCS: Photon Cross Correlation Spectroscopy, GSD: Geometric Standard Deviation, CMD: Count Median Diameter, GMD: Geometric Mean Diameter, I4SP: Image 4 Smaller Particle, I5BP: Image 5 Bigger Particle, zs: zita sizer, Ag+: Silver ion, R: Radius, δ: Poly Dispersity Index, EDX: Electron dispersive XRay study, EOS: Equation of State, ICP OES: Inductively Coupled PlasmaOptical Emission Spectroscopy, XRF: X-Ray Fluorescence.