Surface Water Quality Monitoring for River Nile, Egypt Using GIS-Techniques ()
1. Introduction
1.1. General Statement
The River Nile has been considered as the heart of Egypt because of its role in agricultural, drinking, goods transportation and the desert soil recharging. Egypt is an arid country, so River Nile is the major source for fresh water. Egypt faces a water scarcity severely in last years. There are many reasons causing havoc with water security in Egypt. Ineffective irrigation methods and misuse of water are the most recognized reasons [1] . Increasing populations and fast economic growth with ecosystem degradation are raising water demand in Egypt. In addition, Egypt suffers from annual shortage of water about 8 Billion Cubic Meters (BCM). River Nile has two ending branches; Rosetta and Damietta. The Rosetta Branch has length of about 210 km and width about 190 m [2] . Many sources of polluted water discharge in Rosetta branch: agricultural, industrial and domestic effluents. It was assessed that the ecosystem of Rosetta branch gets about 90 Million Cubic Meters (MCM) monthly of unpurified sewages [3] . Many drains are discharged directly in Rosetta branch [3] . Elrahawy, Sabal, El Thareer and Tala drains are the main sources of degradation of Rosetta branch. This research purposes to monitor the surface water quality for the River Nile in Egypt using GIS-Techniques.
The water quality index (WQI) is one of the best good standards which can be used to assess the status of waters quality. In Rosetta branch, a mathematical model, which integrates data as input parameters, will be built. This model will create a score that describes the spatial distribution. Additionally, the temporal of water quality status will be defined. This model will be presented to the public as well as decision and policy makers [4] [5] . There are many previous studies that have used water quality indices models and methods to assess the condition of waters quality [6] - [19] .
There are many techniques used for water quality monitoring through analyzing its physical, chemical and biological properties. Geographic information system (GIS) is one of modern techniques that has useful environment of diverse spatial data, which is widely used to assess resources of water. On the other hand, it has good techniques to analyze the temporal and spatial data for spatially variable phenomena presentation [20] [21] [22] . Therefore this study seeks out to monitor the surface water quality for the River Nile, Egypt using GIS-Techniques.
1.2. Study Area
Rosetta Branch located in the western part of the Nile Delta Figure 1, it’s an important part of the Nile area. The branch length is about 220 km and the average width about 180 m with an average depth varies between 1.5 - 16.0 m [23] . The study area divided into five drains; Elrahawy, Sabal, Tala, El Tahreer and Zawiet El-Bahr. They represent samples sites. Dry climate prevails in the study area according to the map of the world distribution of the arid regions, where the climatic conditions of the Nile Delta are similar to those of the northern part of Egypt [23] [24] [25] . However the along the Nile River the soil is rich and good to use for agriculture and growing crops. Currently it is used in the cultivation of many crops, the most important were wheat, flax, and papyrus. The
![]()
Figure 1. Study area location of (Rosetta branch, River Nile).
mean minimum air temperature varies from 6.2˚C in February to 23.6˚C in August. The mean maximum air temperature ranges between 17.4˚C in January to 34.2˚C in July. in addition the total annual rainfall ranged between 38.1 - 190.8 mm along the Branch from south at Shebin El-Kome city to the north at Rosetta city [23] [25] .
2. Methodology and Materials
The data were obtained by field sampling analysis. The samples were selected and collected for investigation from five different sites. Each site has three samples in the same line; right, center and left river sides. The water samples were extracted from a depth less than 35 cm. Water samples were collected during the research period in dry period in 2014 (December, January, and February). These samples were tested for their physio-chemical and biological characteristics and compared with the prescribed drinking water standards of Water Health Organization (WHO) [26] , as control analysis. Samples for chemical and biological analysis were taken from the surface water using water sampler scientific method. Then, they were kept in polyethylene bottles for further analysis in pollution lab in National Oceanography and Fisheries (NOF) in Egypt.
Fifteen samples were collected in winter from Rosetta branch. Five drains were chosen were El-Rahawy (R1), Sabal (S1), El-Tahreer (E1), Zawiet El-Bahr (Z1) and Tala (T1), and three samples from each drain were collected. Electric conductivity (EC), biological oxygen demand in 5 days period (BOD5), pH and Total Dissolved Solid (TDS), Sulfate, bicarbonate and ammonia were estimated by multi-probe system in the field or analyzed in the National Oceanography and Fisheries (NOF) lab The major parameters, pH, Electrical Conductivity (EC), Total Dissolved Solids, Ammonia, Sulfate and Biological Oxygen Demand (BOD5) of the samples were analyzed. This study’s parameters were modified with other additional parameters appropriate with the area conditions.
The seven (anions and cations), ions Ammonia and Sulfate ions as well as several physical and microbiological parameters should be taken into consideration parameters to achieve the aims of this study. The seven ions are as follows: Major cations (Ca2+, Mg2+, Na+, K+), Major anions (HCO3−, SO42- , Cl− ) and one un-ionized species represent 95% - 99% of the total dissolved inorganic solutes of natural waters.
The concentrations of Ca2+, Mg2+, K+, Na+, Cl− and SO42- were determined by Ion Chromatography, HCO3− was determined by Titration and NH4+, pH, TDS, EC were determined by Electrode while BOD and DO. In addition to physio-chemical parameters, some calculated parameters have been taken into consideration for each water sample over the study period to identify the irrigational suitability e.g., Soluble Sodium Percentage (SSP), Residual Sodium Bi-carbonate (RSBC) and Permeability Index (PI).
Based on special conditions in arid and semi-arid areas such as aridity, rainfall amount and physical characteristic of area, the water quality index needs to be developed. It will be evaluated using new techniques for both groundwater and surface water. This study evaluated surface water quality using GIS and some parameters. These parameters include water physical and chemical properties, surface geology and land use/land cover of area. A schematic methodology of this study illustrated in Flowchart 1.
Nile River is the main source of fresh water in Egypt; more than 95% Egyptians demands is covered by River Nile. It uses for drinking, fishing and irrigation purposes. The physico-chemical nature of the surface water depends on TDS concentration. High levels of TDS accelerate the corrosion and affect the osmotic pressure of the ecosystem; where the particles (for example, molecules or atoms) move from a region high concentration to a region of low concentration of high chemical potential for the ecosystem. EC measured because of its effect on the soil health and crop yields. On the other hand BOD5, NH3 are significance parameters for fish aquatic life. Also, BOD5 is considered an indirect measurement of organic contamination status in the aquatic life.
In addition to physio-chemical parameters, some calculated parameters have been taken into consideration for each water sample over the study period to identify the irrigational suitability e.g., Soluble Sodium Percentage (SSP) [27] , Residual Sodium Bi-carbonate (RSBC) [28] , Permeability Index (PI) [29] Table 1.
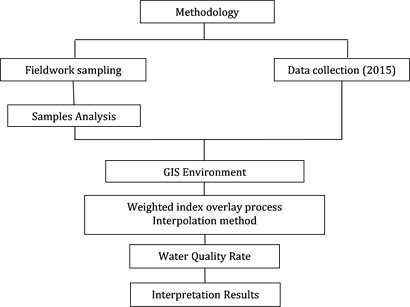
Flowchart 1. Schematic methodology of the study.
![]()
Table 1. Criterion table shows weight ages and ranking assigned for different water quality parameters (modified according WHO standards [26] [30] ).
2.1. GIS and Water Index Modeling
All the data were integrated using GIS through a weighted index overlay process and score results (sum multiplying of weight and ranking). The rating of those variables depends on their importance concerning water pollution with WHO drinking and irrigation water standards Table 1. The general equation for water quality Index is illustrated bellow “Equation (1)” [30] :
(1)
where wi represents how important each parameter is with respect to other parameters, and ri shows how extreme each parameter is within its own subset. Note that a higher WQI means a higher pollution. The spatial distribution maps of WQI were prepared using one special tool of GIS environment which called Inverse Distance Weighted (IDW) technique. IDW referred to as “deterministic interpolation methods because they assign values to locations based on the surrounding measured values and on specified mathematical formulas that determine the smoothness of the resulting surface” [31] [32] . This method uses a defined or selected set of sample points for estimating the output grid cell.
2.2. Water Quality for Irrigation
In order to identify the irrigational suitability some calculated parameters have been taken into consideration for each site, where the Soluble Sodium Percentage (SSP) was calculated by the applied “Equation (2)” based on [27] Table 2 as:
. (2)
Residual Sodium Bi-carbonate (RSBC) was calculated by applied “Equation (3)” given by [28] Table 2:
. (3)
The Permeability Index (PI) was calculated by the “Equation (4)” according to [29] Table 2.
3. Results and Discussion
3.1. Water Quality Index
Water quality index was concluded through integrate the attributes database and temporal data of water quality parameters such as pH, Electrical Conductivity (EC), Total Dissolved Solids, Ammonia, Sulfate and Biological Oxygen Demand (BOD5) that were used to generate spatial variation for surface water index Figure 2.
Based on the variation values of quality parameters, an integrated water quality factor of Rosetta branch Northern Nile River was prepared using GIS environment. The heavy metals also have under taken to assessment the quality of water in this study area Table 3. The mean values of different selected physico-chemical parameters of surface water samples from Rosetta branch in five different sites was presented in Table 4.
![]()
Table 2. Type of water based on standards specified for water quality indices.
![]()
Table 3. Heavy metal analysis of surface water in the study area.
![]()
Table 4. The mean values for different selected physico-chemical parameters used in this study.
Thus the WQI is useful and helpful to evaluate the water status of the sites study area (El-Rahawy (R1), Sabal (S1), El-Tahreer (E1), Zawiet El-Bahr (Z1) and Tala (T1)). The Spatial variation of the water quality index is listed in Table 5.
The results in Table 5 and Table 6 show that water quality index decreases during winter 2014. Based on the water type category which has three classes for each index and after the integrated parameters, the WQI range was classified into three categories good, moderate and poor. Which mean convert the rang WQI values from (160 - 225) to be include values between (0 - 100) to be more
![]()
Figure 2. Spatial variation for surface water index in the study area.
![]()
Table 5. Spatial variation of the water quality index.
understandable and easy comparison with other indices. Therefore the water quality in the study divided into three classes as following: ≤33% Low (Good), 33% - 66% Moderate and ≥66% High (Poor). These ranges were obtained after normalizing of modified water quality index values Table 2.
![]()
Table 6. Normalization of water quality index values.
Based on integrated and normalization processes most of water quality values are moderate to poor. Most of samples which taken from central river has a moderate to poor water quality. While samples those taken from the right and left river sides have moderate water quality. These results can be attributed to a number of factors or variables as pH, Total Dissolve Solid (TDS), Electrical Conductivity (EC) and BOD. This may refer to the circulation and fast movements in the central area of the river. This turbulent will decrease the contaminants concentrations in the middle areas, causing the effect of dilution. The currents and river speed decreases at the river sides were friction with river walls increases. This leads to increase the effects of contamination to be obviously detectable at the river sides. In addition, the contaminants discharge with the drains down streams at the river sides. The final results lead to conclude that the quality of water, according the WHO standards, is unsuitable for drinking. In addition, it is suitable for the uses at least to agriculture. Otherwise if it will be used for drinking purposes, it must be subjected to further treatment process to get good water quality.
3.2. Water Suitability for Irrigation Purpose
Based on the variation values of quality parameters the residual sodium bi-carbonate (RSBC) values of the surface water samples were ranging from 215 to 354 Table 7. In the present study, all the surface water samples were found to be poor Table 2. The soluble Sodium Percentage (SSP) values were ranging from 48.4 to 68.6 in the study area Table 7. In the present study, three sites of the surface water samples were in the moderate category Table 2 for irrigation use, while two sites were in the poor category. The permeability index (PI) values of the surface water samples were ranging from 52.7 to 72.8 Table 7. In the present study, all the PI of the surface water samples was found to be good Table 2.
3.3. Heavy Metals in Water
The Cu content in water for the T1, Z1, S1 and R1 sites was more than 0.02 ppm which is considered above permissible limit, while the Cu content in E1 site reached to 0.018 which it was close to permissible limit, therefore monitor water are required to reduce Cu inflow into the water, where the most of the Cu resources are production industries such as metal production, storage batteries
![]()
Table 7. Water categories for some water quality indices for each site in study area.
and fertilizer. The Cd content in water for all sites of study area was more than 0.005 ppm which is considered above permissible limit, the Cd concentration can bioaccumulate in aquatic organisms if doesn’t reduce Cd inflow into the water. This accumulation can be later effect on food chain in the River Nile.
4. Conclusions
The water quality index of Rosetta branch and its drains was evaluated by GIS technique through collecting 15 water samples. This work aims to understand the water quality as well as to develop suitable management practices for the ecosystem protection. According to water quality index, the final weight values are responsible for classifying water into four categories; excellent, good, moderate and poor. Finally, the spatial variations of major water quality parameters were estimated and all values were integrated.
Based on the physico-chemical parameters, all calculated values for Water Quality Index sites (R1, S1, E1, Z1, T1) had the average values of 60.5, 66.1, 61.1, 58.8 and 67.2, respectively. Consequently the study area has two classes moderate and high as a result of incorporated parameters in WQI calculations. In this study the contaminations of water in the high regions are being dissolved with time and water movement thus becomes to be moderate in quality.
Generally, the WQI values within the study area were about the critical pollution level (60% or more of the study area is above of the pollution level). The concentrations of most elements in the surface water in the study area were above the limits for the permissible levels recommended for drinking water by WHO [26] . Water which contains higher concentrations of BOD5 would require a severe treatment before agriculture, domestic or any other uses. As most of the study samples contain a high percentage of BOD5, the water quality according to BOD5 values was between fair and poor quality.
Calculated values of the SSP, WQI and RSBC show that most of canal water is convenient for irrigation. The water river can’t be used for irrigation purposes, where the water quality is out of the desirable limit in respect of Water Quality Index (WQI), Soluble Sodium Percentage (SSP), Residual Sodium Bi-Carbonate (RSBC), while the water quality is suitable to irrigational and will not create any permeability problem according permeability index (PI). The study shows that the water of study area exhibits high concentration of heavy metals like Cd, Cu. Therefore this study recommended that the River Nile water regularly and constantly should be followed up in future works in order to monitor any change in quality of water and to determine contaminations impacts on the surface water and determining its suitability for irrigation purposes and human uses.
Acknowledgements
The authors are highly grateful Al al-Bayt University and National Oceanography and Fisheries (NOF) in Egypt. Thanks also to our colleague Dr. Reema Salah.