The Influence of Lithostratigraphy on the Type and Quality of Stored Water in Mujib Reservoir-Jordan ()
1. Introduction
Jordan is hurtling toward a future with dwindling water resources and not enough resources to buy all it needs. Providing stable, freshwater supplies in Jordan have become increasingly problematic due to climate change, increased desertification and the population doubles as a result of the added pressures of successive waves of refugees living in Jordan. Jordan is considered by several experts as the second most water-stressed country in the world that increasingly stressed particularly by the influx of Syrian refugees seeking safety across the border that begins from March 2011 [1] .
The Jordan development plans concentrated on dam construction as an available infrastructure solution. Several dams were constructed in the Jordan valley, such as Arab, ziglab, King Talal, Karameh, Shueib, Kafrein, Wala, tannur and Mujib. Mujib dam was constructed in the southern Ghors with a total storage capacity of 31.2 MCM, stored water from Mujib dam is used for domestic, industrial supply and irrigation [2] . Water has two dimensions that are closely linked― quantity and quality. Water quality is commonly defined by its physical, chemical, biological and aesthetic (appearance and smell) characteristics [3] . Monitoring activities on surface water condition focused on providing important information for assessing the condition of water resources. This information is used to assess the current status, potential and actual threats to water quality and to evaluate the effectiveness of management activities taken to address impairments and other threats to water quality [4] .
Reservoir water derives its chemical composition from the feeding waterway system, weathering and geochemical processes operating in the catchment area and anthropogenic sources. Minerals in rocks may react with the slightly acidic rainwater, regulating somehow the chemical composition of reservoir waters. The quality and hydrogeochemistry of the available quantum of water play a significant role in the determination of its utility and in tracing out the hydro- geochemical evaluation [5] .
Lithology is an essential factor in determining river chemistry [6] [7] [8] . When the lithology in a given region is fairly uniform, the distribution of major- element concentrations is relatively homogeneous, when a region is highly heterogeneous with regards to lithology, the river chemistry is much more heterogeneous [9] . Solute concentrations are controlled by the weathering of source rocks, evaporation, and solute losses to minerals and biota [10] . Evaluation of seasonal trends in water quality of Al-Wehda dam over the year 2010 showed strong influences by weathering and leaching of geologic units along with discharge of effluents from the adjacent agricultural lands [11] . During rock weathering, many ions are added to water. The amount of each is dependent on the rock mineralogy. So, it’s useful to use the major ion chemistry of the surface water composition to identify rock mineralogy. The potentiality of rock mineralogy deduction based on water chemistry might take into consideration the chemical composition modification processes such as, mineral precipitation, ion-exchange and evaporation.
The water quality can be modified by the lithology of the catchment area. Hard water is usually defined as water, which contains a high concentration of calcium and magnesium ions. The major sources of hardness are limestone (CaCO3) and dolostone (CaMg(CO3)2). Consequently, it’s probably to expect the lithology as carbonate rocks of any catchment area, if the reservoir water analysis indicated to hard water.
It is necessary to improve our understanding of the geologic units influences that have covered the catchment area of any surface water body of water type and water quality. Therefore, the purpose of this study was to investigate the impact of the lithostratigraphy of the catchment area on the quality and type of stored water in the Mujib Dam Reservoir (MDR), which has not been sufficiently studied in water researches. A graphical representation of the physico-chemical analysis of water samples provides an overall view of the classification and assessment of water type and quality.
2. Methodology and Materials
2.1. Study Area
Mujib Dam (Figure 1) is located in Wadi Mujib, to the east of the Dead Sea, in the southern part of the Jordan valley, south of Madaba and north of Karak city, between latitudes 31˚26'8'' - 31˚26'45''N and longitudes 35˚48'55'' - 35˚49'42''E. The altitude of the dam is about 200 m above sea level. Mujib Dam construction was completed in 2004 of a rolled concrete dam with abutments of clay-core rockfill at the bottom of the wadi with a maximum water storage capacity of 31.2 million cubic meters (MCM) to collect flood water and base flows. The reservoir catchment area is nearly 4380 km². Wadi Mujib catchment is bounded northward by the Wadi Wala catchment, eastward by Azraq basin, southward by Hasa
![]()
Figure 1. Location map of the study area.
and Jafr basins, and westward by the Dead Sea catchment. The reservoir water comes mainly from seven tributaries, e.g., Wadi Al-Salaytah, Wadi Al-Qiyama and Wadi Mkheres through Wadi Mujib and partially from precipitation. The reservoir water is used as drinking water source, also to irrigation in periods of water deficiency. Most of the annual precipitation starts in October and ends in May, and months from June to September can be considered as a dry summer season. The climate of the Wadi Mujib is considered as a Mediterranean in the western catchments to semiarid in the eastern catchments.
During summer months, the eastern part of the Wadi Mujib catchment area experiences to high evaporation rates that render to reduce the relative humidity values, however, many dust storms occur during spring and autumn months. Rainfall intensifies during January, even though the winter months extend from October through May. Annual rainfall decreases from 300 mm near the western edge of the Wadi Mujib to less than 50 mm at the eastern edge [12] .
Mujib drains into the Dead Sea through Wadi Mujib with an annual runoff of 26 million m3/year [13] . The outcropping lithology in the Wadi Mujib catchment area is represented in ascending order by Kurnub, Ajlun, Belqa groups, and Quaternary sediments as shown in Table 1 [14] . Lithostratigraphically, dominated by the upper Cretaceous rocks, that divided into two groups according to [15] ;
Table 1. Lithostratigraphy and hydrogeological classification of rock units in Mujib area.
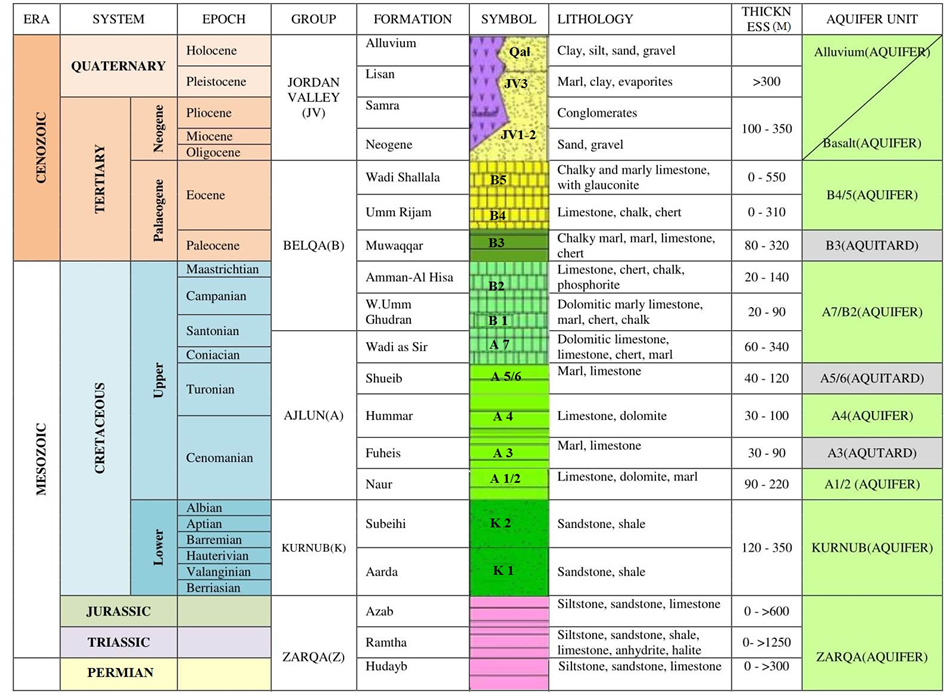
The Ajlun group consists of five formations (Na’ur, Fuheis, Hummar, Shueib and Wadi Es-Sir) and the Belqa group divides stratigraphically into four formations (Ghudran, Amman, Al-Hasa phosphorite and Muwaqar). Na’ur, Fuheis, Hummar, Shueib and Wadi Es-Sir formations are equivalent to the A1/2, A3, A4, A5/6 and A7 of [16] , respectively. Ghudran, Amman, Al-Hasa phosphorite and Muwaqar formations are equivalent to the B1, B2a, B2b, and B3, of [17] , respectively. In other words, chert, gypsum, dolomite, limestone, chalk, basalt, volcanic tuff and aggregates are forming the distinctive and predominantly mineral resources in the catchment. The study area was chosen because of the diversity of rock types that cover the catchment area.
The topography of the Wadi Mujib is characterized by smooth rolling hills, steep slope, and the presence of talus sediments produced by landslides. Elevation in the area is varying from 335 m below sea level in Wadi Mujib, to 1279 m above sea level southwest of the study area (near Al-Mazar) [18] . Highway 35, part of the historic King’s Highway, crosses the crest. The water it impounds is combined with desalinated water piped from brackish wells along the Dead Sea to the west in a reservoir holding 35 million m3 (1 billion US gallons) which primarily supplies Amman, 100 kilometers (62 mi) to the north helping to ease a very stressed national water supply [2] .
2.2. Methodology
To obtain an understanding of the chemical behavior of a water body and to know if it is fit for human use or various ecosystem services, seven ions (four cations and three anions), and ammonium, nitrite, and nitrate ions as well as several physical and microbiological parameters should be taken into consideration. The seven ions are as follows: Major cations (Ca2+, Mg2+, Na+, K+), Major anions ( ,
,  , Cl−) and one un-ionized species (silica, Si(OH)4) represent 95% - 99% of the total dissolved inorganic solutes of natural waters [19] . The data used in this study were provided by the Jordan Valley Authority (JVA), where water samples from a depth of 0 - 35 cm below of water surface. Water samples were collected in clean and dry polyethylene bottles monthly during the period from January 2012 to December 2015 at the Mujib Dam Reservoir (in the year 2016, the data were not available for use). All of the collected water samples were kept in the refrigerator at 4˚C before analyses them. The ionic relationships were calculated to check the origin of the surface water in the study area. These include: Mg/Ca, Cl/HCO3, and the Cationic Exchange Value (CEV) = [Cl ? (Na + K)]/Cl as shown in Table 2. The maximum, minimum and mean values of different selected physico-chemical and calculated parameters of 48 surface water samples of the study area for the 4-year study period was presented in (Tables 3-5). The mean, minimum and maximum values were defined by using Excel functions or formulas; use the “AVERAGE” function in Excel to find the mean of a set of numbers and the Excel “MIN” and “MAX” functions return the smallest and largest value, respectively from a set of numeric values.
Water sampling, preservation, and analyses were carried out according to the
![]()
Table 2. Hydrochemical indices and facies of the surface water in (MDR).
![]()
Table 3. The mean, minimum and maximum values for pH, EC and major ions used in this study, over the 4-year study period.
![]()
Table 4. The mean, minimum and maximum values for TDS, TSS and some nitrogen compounds used in this study, over the 4-year study period.
![]()
Table 5. The mean, minimum and maximum values for calculated irrigation water quality parameters used in this study, over the 4-year study period.
standard procedures of Standard Methods for the Examination of Water, and Wastewater [19] . These water samples were analyzed for their physio-chemical parameters and compared with the prescribed water standards by Jordan’s Ministry of Water and Irrigation and World Health Organization as shown in (Table 6). The major parameters, namely, pH, Electrical Conductivity (EC), Total Dissolved Solids (TDS), Total Suspended Solids (TSS),  ,
, 
 ,
,  ,
,  , Cl−, Ca2+, Mg2+, Na+ and K+ of the water samples were analyzed. The pH, EC, and TDS were estimated using portable pH-meter and EC-meter in the field. The concentrations of Ca2+, Mg2+, K+, Na+,
 ![]() ,
, ![]() , Cl− and
, Cl− and ![]() were determined by Ion Chromatography while those of
were determined by Ion Chromatography while those of ![]() and
and ![]() were determined by Titration and Ammonia Selective Electrode, respectively. In addition to physio-chemical parameters, some calculated parameters have been taken into consideration for each water sample over the study period to identify the irrigational suitability e.g., Sodium Adsorption Ratio (SAR), Residual Sodium Carbonate index (RSC), Soluble Sodium Percentage (SSP), Residual Sodium Bi-carbonate (RSBC), Permeability Index (PI), Magnesium Adsorption Ratio (MAR), Kelly’s Ratio (KR) and Total Hardness (TH) (Table 5 and Table 7). Total hardness (TH) was expressed as CaCO3 as sum of Ca and Mg concentrations according to the equivalent equation (TH = 2.5 [Ca] + 4.1 [Mg]).
were determined by Titration and Ammonia Selective Electrode, respectively. In addition to physio-chemical parameters, some calculated parameters have been taken into consideration for each water sample over the study period to identify the irrigational suitability e.g., Sodium Adsorption Ratio (SAR), Residual Sodium Carbonate index (RSC), Soluble Sodium Percentage (SSP), Residual Sodium Bi-carbonate (RSBC), Permeability Index (PI), Magnesium Adsorption Ratio (MAR), Kelly’s Ratio (KR) and Total Hardness (TH) (Table 5 and Table 7). Total hardness (TH) was expressed as CaCO3 as sum of Ca and Mg concentrations according to the equivalent equation (TH = 2.5 [Ca] + 4.1 [Mg]).
Charts were used for the purposes of clarification and interpretation of the results, the results of the analysis of the twelve samples of each year in the reservoir were annually averaged. This means that one annually representative averages respectively, were used instead of 48 samples over the study period from 2012 to 2015. An assessment of the water quality of the surface water for Mujib reservoir was primarily based on the four main cations (calcium, magnesium, sodium and potassium) and the main anions (bicarbonate, sulfate, and chloride). Piper [20] proposed a trilinear diagram that permits the classification of waters, dividing the waters into seven types. The AquaChem software, version 4.0 from the Waterloo Hydrogeologic was used for plotting this diagram. This study is an attempt to predict the effects of the surface lithology of the catchment area on the
![]()
Table 6. Jordanian Standards (JS 286:2008), (JS 1766:2014) and guidelines for drinking water quality WHO (2011), for physico-chemical parameters used in this study.
quality and type of Mujib Reservoir water. The geology of the catchment area was one of the main reasons that have contributed to fluctuate the average values of all major ion concentrations in Wadi Al-Arab reservoir water [21] [22] .
3. Results and Discussion
3.1. Hydrochemical Indices
The ratios of Mg/Ca, Cl/HCO3, and the Cationic Exchange Value (CEV) = {Cl ? (Na + K)}/Cl) were calculated to identify the origin of the surface water in the study area (Table 2). The value of Mg/Ca given for inland water is less than 2.0, and for seawater is about 5.0 [23] . The Mg/Ca values for surface water in the study area are under 2.0, ranging from 0.28 to 0.42, indicating that the surface water is inland with respect to the origin. The Cl/HCO3 values were all less than 7.0 range from 0.34 to 0.57 and this is in line with the range of values for inland water as given by [24] . Values of CEV specified for inland waters are close to zero, and for seawater are from +1.2 to +1.3 [25] . The CEV values in the study area are generally below 1.0 ranging from 0.1 to 0.3 over the study period, indicating that the reservoir water in the study area appears to be of inland origin with respect to provenance. In other words, the hydrochemical indices indicating that the surface water chemistry is due to the rock weathering minerals with respect to their origin.
The analytical results present the abundance of the ions in the following order: Ca > Na > Mg > K while for the anions is in the order: HCO3 > SO4 > Cl >
![]()
Table 7. Classification of standard water based on standards specified for Water Quality Indices.
NO3 over the period 2013-2015 and SO4 > HCO3 > Cl > NO3 through 2012. Calcium, mostly bicarbonate and sulfate are the dominant ions present in the surface water of the study area. These ions form the major constituents of carbonate rocks (e.g., limestone) and rock gypsum that represents the principal rock types covering the basin’s catchment area.
3.2. Surface-Water Analysis
In the present study, Seven ions (four cations and three anions), ammonium, nitrite, and nitrate ions as well as pH, EC, TDS, TSS, SAR, RSC, SSP, RSBC, PI, MAR, KR, and TH have been taken into consideration. The seven ions that almost represent the total dissolved inorganic solutes of natural waters are as follows: Major cations (Ca2+, Mg2+, Na+, K+) and Major anions (![]() ,
, ![]() , Cl−). The essential sources of these ions are the natural weathering processes and human activities. The data used in this study were provided by the Jordan Valley Authority (JVA) and cover the period from January 2012 to December 2015. A total of 48 samples were analyzed (12 samples for each year on a monthly basis) from 2012 to 2015 using the standard procedures of Standard Methods for the Examination of Water, and Wastewater [19] . The maximum, minimum and mean values of different selected physico-chemical parameters of 48 surface water samples of the study area for the 4-year study period are summarized in (Table 3 and Table 4). The physicochemical parameters used in this study were compared with Jordanian Standards (JS 286:2008) [26] and guidelines for drinking water quality [27] as shown in Table 6.
, Cl−). The essential sources of these ions are the natural weathering processes and human activities. The data used in this study were provided by the Jordan Valley Authority (JVA) and cover the period from January 2012 to December 2015. A total of 48 samples were analyzed (12 samples for each year on a monthly basis) from 2012 to 2015 using the standard procedures of Standard Methods for the Examination of Water, and Wastewater [19] . The maximum, minimum and mean values of different selected physico-chemical parameters of 48 surface water samples of the study area for the 4-year study period are summarized in (Table 3 and Table 4). The physicochemical parameters used in this study were compared with Jordanian Standards (JS 286:2008) [26] and guidelines for drinking water quality [27] as shown in Table 6.
3.3. Water Suitability for Drinking Purpose
3.3.1. Major Ions (Hydrogeochemistry)
1) Bicarbonate
The dissolved CO2 that enters the water through an atmosphere, biological degradation and photosynthesis are considered as the principal source of acidity in water.
Aqueous CO2 (aq) undergoes a number of equilibrium reactions, limestone dissolving and carbonic acid forming:
![]() (1)
(1)
Carbonic acid may lose protons to form bicarbonate, ![]() , and carbonate,
, and carbonate, ![]() , contributing to reduce the pH of the water.
, contributing to reduce the pH of the water.
![]() (2).
(2).
In the present case where the water is slightly alkaline to an alkaline nature (high pH), calcium carbonate and the carbonic acid dissociates to form bicarbonate, calcium and hydrogen ions, due to hydrogen ions being acid forming ions, neutralizing the pH value.
Bicarbonate is the dominant anion, followed by sulfate in the study area. It’s an annual average concentration ranges from 123.17 to 172.45 mg/l (Figure 2(a)). The higher concentration of bicarbonate may be due to the dissolution of
![]()
Figure 2. The annual mean of: (a) Major anions concentrations; (b) Major cations concentrations; (c) pH values (SU); and (d) EC values TDS and TSS concentrations in (MDR).
weathered carbonate rocks. The bicarbonate of the surface water samples is within the permissible limit as specified by [27] and [26] .
2) Chloride
Elevated concentration of chloride in drinking water produces a salty taste. The concentration of chloride ranges from 48.76 to 98.65 mg/l (Figure 2(a)) and is almost low. Its presence could be due to the dissolution of salt deposits, sewage, irrigation drainage, and sea spray and seawater in coastal areas. The chloride of the surface water samples is within the permissible limit as specified by [27] and [26] .
3) Sulfate
Sulfates occur naturally in the environment, commonly originating from mineral deposits, soil, and rocks. Sulfate concentration is varied between 86.79 and 140.14 mg/l (Figure 2(a)). All the samples are within the permissible limit as specified by [27] and [26] . Apart from the natural rock sources, sulfate could be added to soil to change its properties through the application of sulfate soil conditioners. The high concentration of sulfate in drinking water is associated with respiratory problems [28] .
4) Sodium
The sodium concentration in surface water is varied between 34.23 and 61.08 mg/l (Figure 2(b)) and the mean of all samples are within the permissible limit as specified by [27] and [26] . The presence of sodium may be attributed to mineral deposits, sea water spray, sewage effluents. Generally, feldspar of igneous rock is an essential source of sodium when weathered. Also, the agricultural activities may contribute significant quantities of sodium to the water. Most of the soluble sodium salts are leached from the terrestrial environment to surface water and may be found in the atmosphere only in association with particulate matter.
5) Potassium
Generally, the concentrations of potassium in drinking-water are low due to relatively high degree of stability of potassium bearing minerals and do not pose health concerns. The concentration of potassium ranges from 4.97 to 7.70 mg/l (Figure 2(b)) and its occurrence could be due to the agricultural activities, and the average of all samples is within the permissible limit as specified by [27] and [26] .
6) Calcium and Magnesium
The concentrations of Ca2+ and Mg2+ ions in the surface water are influenced primarily by dissolution of calcite or dolomite and the dissolution of gypsum (CaSO4×2H2O) can cause increases in Ca2+ concentrations when the water encounters these minerals along its flow paths. The concentration of Ca2+ varies from 48.16 to 70.71 mg/l (Figure 2(b)) that is due to the rock weathering minerals like calcite, dolomite, and gypsum. The concentration of Mg2+ in the surface water is due to the exchange of minerals in soil and rock by water and ranges from 14.98 to 29.47 mg/l (Figure 2(b)).
3.3.2. pH, EC, TDS and TSS Parameters
The pH of water is a very important factor in controlling the dissolution and precipitation of the carbonate system and good indication of its quality. In the present study, the pH of the surface water of Mujib Reservoir varies from 7.95 to 8.40 as shown in (Figure 2(c)) over the study period, indicating slightly alkaline to an alkaline nature according to the classification of irrigation water of [29] as shown in Table 7. For drinking purposes, all water samples were compliance within the permissible limit as specified by Jordanian Standards [26] and [27] . On the basis of pH value (7.95 to 8.40), all water samples were well within the normal range of irrigation quality and suitable for irrigation according to Jordanian standard (pH: 6.0 to 9.0) [30] .
Electrical conductivity (EC) estimates the amount of total dissolved salts (TDS) or the total amount of dissolved ions in the water. The EC of the surface water samples ranges from 538.36 to 901.08 μS/cm as an annual average over the study period shown in (Figure 2(d)). The EC of the surface water samples is within the permissible limit as specified by [26] and [27] except for the year 2012, the annual average of EC values is higher than the permissible limit as specified by Jordanian Standards (JS 286:2008), this is due to the low precipitation during the wet winter season and to the high evaporation rate during the dry summer season. The salinity of the surface water of this area may be produced mainly by natural processes such as weathering of bedrock formation, and wind and rain depositing salt over many years, as well as land use practices. The Total dissolved solids (TDS) in the study area varies from 319.28 to 535.04 mg/l (Figure 2(d)). Total dissolved salt concentrations outside of a normal range in water can affect drinking water supplies, agriculture, and ecosystem health. Waters containing more than 500 milligrams per liter (mg/l) of dissolved solids should not be used if other less mineralized supplies are available [31] , but according to [32] , total dissolved solids (TDS) values in the water samples were classified under fresh water type as shown in (Table 4 and Table 7). Total suspended solids (TSS) are organic and inorganic materials, mostly small particles larger than 2 microns, regarded as the most visible indicators of water quality. TSS values are varying from 6.85 to 12.73 mg/l (Figure 2(d)).
3.3.3. Nitrogen Compounds
Nitrogen compounds of greatest interest in water quality are those that are biologically available as nutrients to plants or exhibit toxicity to humans or aquatic life [33] . In soil, fertilizers containing inorganic nitrogen and wastes containing organic nitrogen are first decomposed to give ammonia, which is then oxidized to nitrite and nitrate [27] . The nitrate concentration ranges from 1.03 to 1.74 mg/l (Figure 3). The presence of nitrate may be due to the application of fertilizers, decaying plant and animal residues and contamination by the sewage disposal and livestock facilities. Nitrate is present in the study area at relatively very low concentrations. The nitrite concentration ranges from 0.01 to 0.03 mg/l (Figure 3) and the average of nitrate and nitrite concentration are within the permissible limit as specified by [26] and [27] . The term “ammonia” covers both the unionized form (NH3) and the ammonium cation (NH4+) unless stated otherwise [27] . The ammonium cation is less mobile in soil and water than ammonia and is involved in the biological processes of nitrogen fixation, mineralization, and nitrification [34] . The ammonium concentration ranges from 0.30 to 4.75 mg/l (Figure 3) and the mean of all samples exceed the permissible limit as specified by [26] and [27] . Higher natural contents of ammonia are found in strata rich in humic substances. The presence of ammonia at higher than geogenic levels is an important indicator of fecal pollution [35] .
3.4. Water Suitability for Irrigation Purpose
Because, Jordan is one of the arid and semi-arid regions, crop production is dependent on irrigated agriculture. During the hot and dry seasons, the irrigation water that does not contain harmful amounts of soluble salts to the plants or has an undesirable effect on the soil properties is required. The availability of good quality water in sufficient quantities to satisfy the water requirements of all
![]()
Figure 3. Annual mean of nutrients concentrations (mg/l) in (MDR).
the crops grown is rarely. So, the farmers are obliged to use the available irrigation water with high amounts of dissolved salts, that leads to reductions and failure of most crops in addition to the development of saline soils. Salinity, sodicity (alkali), toxicity are three principal hazards that can be associated with the quality of irrigation water used in the agricultural fields. Salinity, sodicity (alkali) hazards would be discussed in the present study and toxicity hazard would be left without discussion due to unavailable data. Salinity hazard is related to the quantity of salts dissolved in the irrigation water and the sodicity (alkali) hazard develops when the concentration of sodium ions is elevated more than divalent calcium and magnesium ions while the total concentration of salts is generally not very high. Classification of irrigation water based mainly on EC and sodium concentration. The salinity in irrigation water can be categorized for the purpose of classification of irrigation water with respect to (Table 7). The electrical conductivity EC ranged between (538.36 to 587.92 µS/cm) over the period 2013-2015 and 901.08 µS/cm through 2012 as shown in Figure 2(d). High EC and sodium concentration in water lead respectively to the formation of saline and alkaline soil.
Some parameters have been calculated for each water sample over the study period to identify the irrigational suitability.
The Sodium Adsorption Ratio (SAR) was calculated by the following equation given by [36] as:
![]() (1).
(1).
The residual sodium carbonate index (RSC) can be calculated by the following equation:
![]() (2).
(2).
Soluble Sodium Percentage (SSP) was calculated by the following equation [37] :
![]() (3).
(3).
The Residual Sodium Bi-carbonate (RSBC) was calculated according to [38] :
![]() (4).
(4).
The Permeability Index (PI) was calculated according to [39] by the following equation:
![]() (5).
(5).
Magnesium Adsorption Ratio (MAR) was calculated by the equation [40] as:
![]() (6).
(6).
The Kelly’s Ratio (KR) was calculated using the equation [41] as:
![]() (7).
(7).
where all the ionic concentrations in the equations above are expressed in meq/L.
1) The Sodium Adsorption Ratio (SAR)
The calculated value of SAR in the study area ranges from 1.5 to 1.83 (Table 5) through the study period. Based on SAR values, all the surface water samples were categorized as normal water for the purpose of classification of irrigation water with respect to [42] as shown in Table 7. The plot of data on the Wilcox salinity diagram (Figure 4), in which the EC is taken as salinity hazard and SAR as alkalinity hazard, shows that all of the surface water samples during the year 2013-2015 fall in the category C2S1 but through the year 2012 the samples fall in the category in C3S1, indicating medium (2013-2015) to high (2012) salinity and low sodium water which can be used if a moderate amount of leaching occurs over the period (2013-2015) but cannot be used on soil with restricted drainage during 2012. Even with adequate drainage, special management for salinity control may be required, and plants with good salt tolerance should be selected. These classifications were based on the use of irrigation waters, according to the U. S. Salinity Laboratory Staff (1954) water quality classification [43] .
2) Residual Sodium Carbonate index (RSC)
If the sum of carbonates and bicarbonates is in excess of the alkaline earth (Ca + Mg), complete precipitation of calcium and magnesium may occur [40] . A high value of RSC in water value leads to an increase in the absorption of sodium on soil [44] . Water having RSC values greater than 2.5 meq/l are not considered suitable for irrigation purpose, while water with RSC values below 1.25 meq/l are considered suitable for irrigation and marginal between 1.25 - 2.5 meq/l (Table 7). All the RSC values of the study area surface water samples were
![]()
Figure 4. Diagram representing Salinity and alkalinity hazard of (MDR) water.
below 1.25 meq/l and varied between (−3.13 to −1.36) meq/l (Table 5) indicating that the stored water in Mujib reservoir is safe for irrigation purpose (Table 7).
3) Residual Sodium Bi-carbonate (RSBC)
The residual sodium bi-carbonate (RSBC) values of the surface water samples were ranging from -0.71 to -0.05 (Table 5). In the present study, all the surface water samples were found to be satisfactory (Table 7) according to [38] .
4) Soluble Sodium Percentage (SSP)
The soluble Sodium Percentage (SSP) values were ranging between 29.5 and 34.0 in the study area (Table 5). As per many countries’ standards, maximum sodium of 60% is recommended for irrigation water [45] . In the present study, all the surface water samples were in the good category (Table 7) for irrigation use.
5) Permeability Index (PI)
The permeability index (PI) values of the surface water samples were varied from 50.3 to 59.41 (Table 5). In the present study, all the PI of the surface water samples was found to be good (Table 7) according to [40] , suggesting that the water showed full satisfaction in using for irrigation and will not create any permeability problem.
6) Magnesium Adsorption Ratio (MAR)
The magnesium adsorption ratio (MAR) values of the surface water samples were varied from 32.2 to 40.7 over the study period (Table 5). High MAR causes a harmful effect on the soil when it exceeds 50 [38] . The results reported herein had not a harmful effect on soils as MAR of all of the surface water samples is within the permissible limit (Table 7).
7) Kelly’s Ratio (KR)
The Kelly’s ratio (KR) values of the surface water samples were varied from 0.39 to 0.47 (Table 5). The ratio should not exceed 1.0 for irrigation water [41] . In the present study, all the surface water samples had KR less than 1.0. So, Kelly’s ratio showed full satisfaction in using for irrigation (Table 7).
8) Total Hardness (TH)
Water hardness is mainly caused by the presence of calcium and magnesium ions and anions such as carbonate, bicarbonate, chloride and sulfate in water. The (TH) was calculated according to the equation of [37] . The hardness of surface water ranges from 185.54 to 297.59 mg/l (Table 5). According to [46] classification for hardness (Table 7), all of the surface water samples fall under the hard class during the study period which may be due to the dissolution of the rocks. Hard water poses health concerns and is unsatisfactory for domestic purpose and hence water softening processes are needed.
3.5. Water Classification Using Piper Diagram
The geochemical evolution of water and a relationship between rock types and water composition can be evaluated by the Piper trilinear diagram [20] . The piper diagram is a graphical representation of the chemistry of a water sample, which consists of two separate ternary plots at the lower left the calcium, magnesium, and sodium plus potassium cations and at the lower right the sulfate, chloride, and carbonate plus hydrogen carbonate anions. The two ternary plots are then projected onto a diamond [47] . The diamond is a matrix transformation of a graph of the anions (sulfate + chloride/ total anions) and cations (sodium + potassium/total cations) [48] . The concentrations average of major ions for each year have been plotted using a Piper trilinear diagram. The plot indicates that most of the reservoir water samples represent one type of water was found in this area, Ca-Na-Mg-SO4-HCO3-Cl through 2012 and Ca-Na-Mg- HCO3-SO4-Cl type of water over the period 2013-2015 (Figure 5), suggesting that alkaline earth (Ca + Mg) exceeds alkalies (Na + K) and strong acids (SO4 + Cl) exceed weak acids (HCO3 + CO3), respectively. So, the total hydrochemistry is dominated by alkaline earth and strong acids. The sources of this one type may come from calcite, dolomite, gypsum, and clay minerals which form the major constituents of the catchment area lithology. It is suggested that carbonate weathering is dominant in the rock?water interaction which may be contributing to increasing the concentration of major ions in the reservoir water.
3.6. Relationship among the Chemical Properties of Surface Water
A bivariate correlation analysis (AKA, Pearson’s r) is applied in the present study to determine the empirical relationship and help in testing simple hypotheses of association between two hydrochemical parameters, denoted as X and Y. A positive r value expresses a positive relationship between the two parame-
![]()
Figure 5. Piper diagram of (MDR) water analyses illustrating water types (Total cations and anions in meq/l are set to equal 100%).
ters (the larger X, the larger Y) while a negative r value indicates a negative relationship (the larger X, the smaller Y). A correlation coefficient of zero indicates no relationship between the parameters at all. It can be said that parameters showing r near (1) indicate a good relationship between two parameters (either positively or negatively correlated), r > 0.7 are considered to be strongly correlated whereas r between 0.5 and 0.7 shows moderate correlation.
In Mujib Reservoir, a positive correlation was observed between EC and TDS with HCO3, SO4, Cl, Ca, Mg, Na and K in the present study (Table 8). It may be owing to the mineral dissolution during rainfall in the basin catchment of the study area which depends primarily on Rock?water interactions. The source of these ions are may be derived from the lithological sources and likely to form from agricultural and anthropogenic activities. TDS and EC showed good correlation with HCO3, SO4, Cl, Ca, Mg, Na and moderate correlation with K (0.64 and 0.65, respectively). The strong correlation between EC and TDS (r = 0.99) indicated that conductivity is a function of TDS. Sodium showed good correlation with Cl (r = 0.97), indicating the anthropogenic input in surface water. Chloride showed good correlation with Ca, Mg ions (0.97 and 0.99 respectively) and moderate correlation with K (r = 0.51) indicating a probable common source of major ions in the reservoir water. Ca and Mg showed a good positive correlation with Na (r = 0.90 and 0.96, respectively) and moderate- low correlation with K (r = 0.30 and 0.53, respectively), indicating the dominance of weathering. The hydrogeochemical study of Mujib reservoir water indicated that the water quality is safe for drinking and agricultural purposes except for a few samples with high salinity. All the samples in the study area were suitable for irrigation based on Cl, EC and TDS content of the samples except few samples with high salinity. The correlation analysis indicated that hydrogeochemistry (i.e., water quality and type) is mainly governed by weathering of the bedrock covering catchment area. However, ion Cl was derived partially from anthropogenic sources. Piper diagram suggested that carbonate weathering is the dominant process controlling
![]()
Table 8. Correlation matrix of chemical composition of surface water.
the chemical composition of reservoir water. Overall the reservoir water was unpolluted with respect to its constituents show partial anthropogenic impact and can be safely used for drinking and irrigation purposes.
3.7. Relationship among Different Calculated Water Quality Parameters
The correlations between different chemical properties of surface water are presented in Table 9.
SAR had high a positive correlation with SSP (r = 0.99), RSBC (r = 0.90), KR (r = 0.99), PI (r = 0.70), moderate correlation with RCS (r = 0.49) and had a negative correlation with TH (r = −0.38), and MAR (r = −0.06). RSC had a strong correlation with RSBC (r = 0.83), PI (r = 0.97) and moderate correlation with SSP and KR (r = 0.60) and had a negative correlation with MAR and TH (r = −0.90, −0.92, respectively). SSP had a strong correlation with RSBC (r = 0.94), PI (r = 0.79) and KR (r = 1.00) and had a negative correlation with MAR (r = −0.18) and TH(r = −0.49). RSBC had a strong correlation with PI and KR (r = 0.95), PI (r = 0.97) and had a negative correlation with MAR and TH (r = −0.50, −0.72, respectively). PI had a strong correlation with KR (r = 0.79) and had a negative correlation with MAR and TH (r = −0.75, −0.87, respectively). MAR had a strong correlation with TH (r = 0.85) and had a negative correlation with MAR (r = −0.19). KR had a negative correlation with TH (r = −0.49).
![]()
Table 9. Correlation matrix of calculated parameters of surface water quality.
4. Conclusions
The results revealed that:
a) The pH value of collecting surface water was slightly alkaline to an alkaline nature and on the basis of EC and TDS values the water samples were graded as “fresh water”.
b) The total anions and cations of water under analysis were within the safe limit for drinking and irrigating purposes and all of the surface water is within the permissible limit as specified by Jordanian Standards (JS 286:2008(, (JS 1766:2014) and WHO (2011).
c) The ionic ratios (Hydrochemical indices); Mg/Ca, Cl/HCO3 and Cation
Exchange Values (CEV) indicated that the surface water in the study area appears to be of low-salt inland origin.
d) On the combined basis of the EC and SAR, all surface water samples were during the year 2013-2015 fall in the category C2S1 but through the year 2012, the samples fall in the category in C3S1, indicating medium (2013-2015) to high (2012) salinity and low sodium water.
e) The reservoir water of Mujib dam can be used for irrigation purposes. The water quality is within the desirable limit in respect of Sodium Adsorption Ratio (SAR), Residual Sodium Carbonate index (RSC), Soluble Sodium Percentage (SSP), Residual Sodium Bi-carbonate (RSBC), Permeability Index (PI), Magnesium Adsorption Ratio (MAR), Kelly’s Ratio (KR) and Total Hardness (TH(.
f) Abundance of cations and anions is in the following order: Ca > Na > Mg > K and HCO3 > SO4 > Cl > NO3 during the period 2013-2015 and SO4 > HCO3 > Cl > NO3 through 2012. Thus, calcium and bicarbonate-sulfate are the dominant ions present in surface water in this basin area. Piper diagram suggested that carbonate and gypsum weathering is the dominant process controlling reservoir water chemistry in the basin area.
g) The quality and type of the surface water can be modified by the lithostratigraphic units in the catchment area.
h) The major sources of the hardness are limestone (CaCO3) and dolostone (CaMg(CO3)2).
i) The concentrations of Ca2+ and Mg2+ ions in the surface water are influenced primarily by dissolution of calcite or dolomite and the dissolution of gypsum (CaSO4. 2H2O) can cause increases in Ca2+ concentrations.
j) The carbonate rocks (e.g., limestone) and rock gypsum represent the principal rock types covering the basin’s catchment area.
k) Based on the major ions of the surface water composition, it’s probable to reveal the lithology (rock types) of any basin’s catchment area.
l) The statistical analysis suggested that the lithology of the catchment basin area played an important role in governing the hydrogeochemistry, quality, and type of the reservoir water of Mujib dam.
Acknowledgements
I would like to thank the Jordan Valley Authority for providing the opportunity to conduct this research, as well as Eng. Fuad Hanna the Head of water Division for his assistance in providing the necessary infrastructure to complete this work. Thanks also to Al al-Bayt University, to my cooperative colleague Dr. Majed Ibrahim from GIS and Remote Sensing Department and to my family for their support throughout the process.