Poisson Process and Its Application to the Storm Water Overflows ()
Received 21 March 2016; accepted 16 April 2016; published 19 April 2016

1. Introduction
The storm drain is designed to divert excess rain and ground water from impervious surfaces. Those impervious surfaces include paved streets, car parks, parking lots, footpaths, and roofs. There are two types of system that diverts storm water: combined sewer system (CSS) and separate storm system. The former has been the system for many municipalities. The CSS was developed to convey both sanitary sewage and storm water in one piping system. When it rains, storm water is collected into the sewer system and is sent to the treatment facility center. One disadvantage of the CSS is that there is an increased volume of sewage to the treatment plant. To address this issue, some municipalities have two independent piping systems, one for sanitary system, and the other is for storm water system. The separate storm water is designed to drain the storm water into rivers or streams.
For both combined and separate piping system, overflows are the common issue that needs to be addressed. Overflows cause damages to surrounding properties and pollute the environment. Usually, the pipe system is designed according to the capacity requirement. In terms of separate storm water system, the piping is designed to convey storm from a specific rainfall intensity, such as a 10 year rainfall. When rains are extremely heavy, overflows will probably occur. In addition, issues such as sediment accumulation, pipe condition deterioration, would cause overflows as well. The arrivals of such events are usually regarded random, which is featured with a constant rate. The failure rate is a great indicator of the systems performance. It is very meaningful to explore the true arrival pattern of the overflows.
In the facility management, pipeline system has been studied in various focuses by using different methods. One popular research topic is the pipe condition deterioration. Modeling has been applied extensively in this research effort. For example, Wirahadikusumah et al. discussed multiple challenging issues in predicting the condition using the Markov chains model [1] . To address certain such issues, Jin and Mukherjee further proposed methods to estimate the condition transition probabilities [2] . They also investigated uncertainty of the Markov chains model with the assistance of simulation in Matlab [3] . Another research topic is the life cycle analysis of the pipeline system. For example, Piratla et al. estimated the life cycle CO2 emissions of a potable water pipeline project [4] . Emissions from multiple phases in the entire life cycle were quantified. Jin explored both the life cycle cost and life cycle assessment of the sewer pipeline system [5] . Methods proposed can be applied in the life cycle analysis of other pipeline system as well. The third research topic could be system’s reliability analysis by focusing on the failure data. For example, Jin and Mukherjee analyzed blockage failures in sewer systems to support maintenance decision making [6] [7] . Pelletier et al. applied the survival analysis on three case studies to evaluate the reliability of the water system [8] . The fourth research topic is the hydraulic evaluation of the pipeline system. For example, Li et al. simulated the mixed flow in storm water [9] . Basically, the hydraulic fundamentals, such as Bernoulli’s equation, are used in evaluate the system’s performance [10] [11] . Other relevant studies can be found in [12] - [15] . All such research efforts are for the purpose of managing the facility systems efficiently [16] .
This research is similar to Jin and Mukherjee’s work [6] . Jin and Mukherjee proposed methods to model the sewer blockage failures in an effort to support the system’s management. By using a set of blockage failure data from a city, they used the stochastic approach to characterize the failure arrivals. Methods to verify the process were presented with preliminary data analysis and hypothesis test. The results show that for the annual data set, the arrivals can be best described with a homogeneous Poisson process, while for the entire data set, the non- homogenous factors start to have significant impacts on the fitting. They further conducted the reliability analysis over the data set. Based on the analysis, they proposed a schematic survival curve from the life cycle perspective. The developed methods were also successfully applied on the failure data set of a water pipeline sys- tem.
This paper focuses on the storm water overflows instead. The aim of this paper is to investigate the underlying arrival pattern of storm water overflows to assist facility management. The data set is obtained from an entire separate storm water system. Very often, those failures are regarded as random arrivals, which are featured with a Poisson process. Such Poisson process has been applied in many areas [17] - [20] . This study explores such arrival pattern of storm water overflows. The results would assist stakeholders in the decision making process.
2. Methodology
In order to verify if Poisson process can be used to characterize the arrival of overflows. The inter-arrival times of the overflows are used. For a Poisson process, the inter-arrival times between two successive events are exponentially distributed.
In theory, a discrete random variable X is said to be a Poisson random variable with parameter λ, the probability mass function of X is given by
 (1)
(1)
The mean of the Poisson distribution is λ, the variance of the distribution is also λ.
In a Poisson process with a constant arrival rate of λ, the inter-arrival times between events are exponentially distributed. The proof of this statement can be found in Ross [21] . Therefore, in order to verify whether the arrival of overflows follows a Poisson process, one direct method is to check the distribution of the inter-arrival times.
Among all the renewal processes, the Poisson process is very unique due to the memoryless property of the exponential distribution. For an exponential, the probability density function is
 (2)
(2)
In terms of memory-less property, a random variable X has the memory-less property if for every x ≥ 0 and t ≥ 0, we have
 (3)
(3)
Equation (3) can be proved using the definition of conditional probability. By combining Equation (2), we have
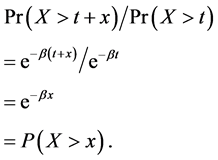
In a time series analysis, X can be interpreted as the waiting time until a given arrival. Equation (3) states that, given that the no arrival occurred by time t, the distribution of the remaining waiting time stays the same. That is, the remaining waiting time has no “memory” of previous waiting. That’s the reason that the inter-arrival times can be used to verify the Poisson process.
When dealing with non-homogenous Poisson process, the arrival rate is not constant but a function of time. A typical non-homogenous Poisson process (NHPP) is the power law process, which is sometimes called a Weibull process [21] . The Weibull distribution is often used to conduct the reliability analysis. As a distribution, it can also be used to fit data set. In this study, if inter-arrival times are not found of exponential distribution, considering the relationship between an exponential and a Weibull, the Weibull distribution can be used, the standard Weibull distribution has the density function
 (4)
(4)
and distribution function
 (5)
(5)
where α is the scale parameter, k is the shape parameter. When k = 1, the Weibull distribution is reduced to an exponential distribution [21] .
In summary, in order to verify the Poisson process, the inter-arrival times are used in the analysis. The Poisson process can be verified if the inter-arrival times follow an exponential distribution. In some cases, when Poisson process cannot be verified, some other more powerful distribution can be used to check the distribution of such inter-arrival data sets. The data used in the study ranges from 2012 to 2014. The inter-arrival times of the annual data sets and the entire data set are analyzed. The Minitab 2016 tool is used for the analysis. The hypothesis test is used to verify the distribution fitting. The null and alternative hypothesis are:
H0: The data set follows a specific distribution.
H1: The data set does not follow the specific distribution.
Significant level: 0.05.
3. Results and Applications
Figures 1-3 show the exponential distribution test of the annual data set. It can be that the P values for each data
![]()
Figure 1. Exponential distribution fitting for 2012 data.
![]()
Figure 2. Exponential distribution fitting for 2013 data.
![]()
Figure 3. Exponential distribution fitting for 2014 data.
set are all greater than 0.05. Therefore, the hypothesis that the data set follows an exponential distribution can be accepted. It also means that the arrivals of such overflows follow a Poisson process. Figure 4 displays the exponential distribution fitting for the entire data set. The fitting also passes the rigid hypothesis test with a P value of 0.323. Therefore, the entire data set also follows an exponential distribution. Table 1 lists the parameters for test results.
Although the exponential distribution is good fit. The Weibull distribution is also used to fit the same data set. As expected, as shown in Figure 5, the Weibull distribution fits the data very well with P value greater than 0.25. Considering that the exponential distribution is a one parameter distribution and Weibull distribution is a more powerful 2-parameter distribution, it is obviously that when an exponential distribution fits the data, the Weibull also fits. Since a simple model does the job well, it is reasonable to accept the fact that the data follows the exponential distribution. For some other data set with more non-homogenous noises, the Weibull distribution could be a good option to test against.
From the entire data set fitting, we can find that the mean value is 16.16 days. The P value is very decent and it is safe to conclude that the inter-arrival times follow an exponential distribution. Therefore, the failure rate is 0.062 per day. In application, those information can be used to address multiple issues. The following example problems can be solved.
![]()
Figure 4. Exponential distribution fitting for the entire data.
![]()
Figure 5. Weibull distribution fitting for the entire data.
![]()
Table 1. Parameters of the exponential fitting for each data set.
Case 1: what is the chance that there are exact 10 failures next year? To address this question, we know that the mean arrival number of overflow per year is 0.062 × 365 = 23, by using Equation (1), we have
P (X = 10) = exp (−23) × 23^10/10! = 0.0012.
Case 2: what are the chances that there are at least 10 failures next year?
The question is actually for the probability when there are  failures in a given year. Therefore, it is the sum of all those individual probabilities.
P (X = 0) = exp (−23) × 23^0/0! = 1.026E−10
P (X = 1) = exp (−23) × 23^1/1! = 2.360E−9
P (X = 2) = exp (−23) × 23^2/2! = 2.714E−8
P (X = 3) = exp (−23) × 23^3/3! = 2.081E−7
P (X = 4) = exp (−23) × 23^4/4! = 1.200E−6
P (X = 5) = exp (−23) × 23^5/5! = 5.504E−6
P (X = 6) = exp (−23) × 23^6/6! = 2.110E−5
P (X = 7) = exp (−23) × 23^7/7! = 6.933E−5
P (X = 8) = exp (−23) × 23^8/8! = 1.993E−4
P (X = 9) = exp (−23) × 23^9/9! = 5.093E−4
P (X = 10) = exp (−23) × 23^10/10! = 1.172E−3
The probability for at least 10 failures in the next year is 0.0020.
Case 3: what is the probability that no overflow was found in a 30 days?
The probability of no overflow can be found using
Pr {k = 0} = exp (−30 × 0.062) = 0.156.
Case 4: what is the expected time for the 20th overflow?
Since it is a Poisson process, the arrival rate is constant. Therefore the expected time for the 20th overflow can be found using 20/0.062 = 323 days.
4. Conclusion
The storm water overflow is an indicator of the pipeline management. The arrivals of such overflows can be regarded as a process. The Poisson process is often used to describe such time series events. This paper explores whether the general homogenous Poisson process can be used to model the arrivals of storm water overflows. In theory, the inter-arrival times of a Poisson process follow an exponential distribution. To verify this, the annual data set and the entire data set are used to fit against an exponential distribution. The results show that for the annual data sets, they fit the exponential distribution very well. Even for the entire data set, the fitting is also decent. Therefore, it can be concluded that for the available storm water overflow data set, the Poisson process can be used to describe the process. Specific examples are shown to demonstrate the applications. It should also be noted that the homogenous Poisson process may not be used for other data sets that are impacted by various non-homogenous factors; the non-homogenous reliability model may be applied on those data sets. Related studies will be conducted in our future research.