Investigation on the Geochemical Distribution of REE and Heavy Metals in Western Part of Jalal-Abad Iron Ore Deposit, Zarand, SE of Iran ()
1. Introduction
The study area is located in Kerman province, 38 Km NE of Zarand town. This area is a part of the central Iranian microplate situated between Kuh-Banan and Davaran faults in east and west, respectively [1] . Metallogenically, the region makes the southeastern part of the Bafq mining district [2] . The Zarand region contains several iron ore deposits sporadically being mined of which the Jalal-Abad iron mine has a reserve of about 200 million tons (Mt) of iron ore. The Jalal-Abad iron ore deposit is, volumetrically, mostly composed of magnetite. The aim of this study is to investigate the geochemical distribution of REE and heavy elements in the western part of the Jalal-Abad iron ore deposit in the Zarand region.
2. Regional Geology
The study area is mostly covered by volcano-sedimentary rocks associated with rhyolitic and rhyodacitic lavas, dykes, pyroclastic rocks, tuffs and ignimbrites [3] . Intercalations of sedimentary rocks, such as dolostone, limestone, sandstone and siltstone are also included (Figure 1). Gray sandstones and sandy shales, with heterogenous composition, along with tillites and conglomeratic fragments of carbonate rocks in a fine grain matrix (diamictite) form the lower part of the stratigraphic units of the region. Spilitized basic and acidic volcanic rocks are found with magnetite and hematite ore rocks. Carbonate rocks, cherty dolomites and dolostones associated with jaspilites are found in the upper parts of this succession. Dolomitic carbanate rocks thoroughly cover the upper part of the series. The host rock for the iron ore deposit is a dolomitized limestone unit (Figure 2) [4] .
In addition, subvolcanic units as dykes and sills (microgabbro and microdiorite) also outcrop in the area. Investigations by Ale-Taha-Kuhbanani (1994) [5] indicate that the basic magmas in the study area belong to alkaline series, whereas the acidic magmas are in the field of calk-alkaline rocks. Geochemical composition of these rocks, in the study area, indicates an intra-continental rift setting for this region. According to Mohseni (2007) [6] , the iron ore deposits of the central Iranian iron ore field are BIF-type iron ore deposits formed in a sedimentary environment dominantly affected by submarine exhalative activities noting the occurrence of distinct keratophyre-jaspilite-diamictite associations and the observation of glacial erratics and dropstones in the enclosing sediments.
3. Mineralization
Mineralization in the Jalal Abad ore deposit is hosted by siltstones, shaly siltstones, acidic volcanic rocks and dolomitic limestones. The Jalal-Abad iron deposit mainly consist of magnetite ore showing a range of primary to post-mineralization textures including, massive, disseminated and cataclastic textures. Hematite is mainly found near the surface levels. Pyrite is widely distributed in the Jalal-Abad ore deposit and hosted much of the sulfur in the ore. Chalcopyrite as the second mineral in abundance after pyrite is the most important copper-bearing mineral mainly observed as irregular veins and open-space filling bodies. Sulfide mineralization can be envisaged as a late-stage phase which occurs as secondary fracture-filling veins and veinlets within the host iron ore minerals [7] . The primary minerals are intensely altered to iron hydroxides and copper carbonates, such as malachite and azurite. Quartz is associated with magnetite, pyrite, hematite, chalcopyrite and calcite which shows higher concentrations in the lower parts and oxidized part of the ore deposit. Carbonate minerals, mainly calcite and dolomite, occur more abundantly around the ore deposit. Calcite and dolomite filled the open spaces and fractures in the oxidized zone and form the matrix of the iron ore in the mineralized parts where it occurs in dolomitic limestones. Dolomite is dominantly replaced by talc and actinolite [8] .
4. Alteration
Alteration as occurs in the haloes around the ore deposit. Chlorite, quartz, calcite, sericite and epidote are the main alteration minerals in the study area (Figure 3) [9] . Chlorite is associated with quartz-chlorite, quartz- chlorite-calcite, and quartz-chlorite-pyrite mineral assemblages. Silicification occurred as veins, veinlets and open-space fillings.
5. Materials and Methods
The study area covering a region of 119 hectars extending 1250 m EW and 950 m SN was chosen for surveying
![]()
Figure 1. 1:5000 geological map of the Jalal-Abad ore deposit area (IMICO Co. 1390).
![]()
![]()
Figure 2. (a) A view of the thick dolomitic limestone unit containing cherty fragments and nodules. (b) View of the layered intermediate to alkaline pyroclastic units (View to the northwest).
![]()
![]()
Figure 3. Chlorite-sericite and carbonate alterations in volcaniclastic rocks in the study area.
the surface geochemical distribution of the certian elements. 44 samples were collected, including 14 samples from drilling holes and 30 samples from the surface materials. The Jalal Abad System was sampled from October 10 to 25 in the year 2013. 30 sampling along the Veins and Altration in Western Part were selected.. Chip samples are taken from veins and alteration. The average volume of the samples was 3 kg. The samples were then analyzed by XRF in the commercial lab of Kansaran Binaloud, Tehran, Iran. The surface samples were collected from three exploration districts. The locations of the collected samples are shown in Figure 4.
6. Discussion
6.1. Geochemical Parameters
32 elements were selected for geochemical analysis. Calculation of important statistical parameters including the lowest and the highest values, average, median, standard deviation, variance, skewness and kurtosis of each element were carried out on the raw data. The assaying results of the samples regarding these elements are given in Table 1 and the frequency graphs for these elements are drawn (Graphs 1-4).
The results of the raw data analysis shows non-normal L-shaped distributions for Cl, Ba, Rb, TiO2, Co and As. U and Th show near-normal distributions and other elements have non-normal distribution function. In normal and near-normal distribution functions, there is usually no separation between two non-normal populations and normal population on the histogram of the distribution function. This border is usually at the end of the background population and at the end of the histogram slope and its careful separation is possible through calculation.
![]()
Figure 4. Locations of the samples in the Jalal-Abad exploration area.
![]()
Table 1. Statistical parameters obtained from raw data of Pb, Ni, Cr, V, Ce, La, TiO2, Cl, Ba, Sr, Cu and Sn (data in ppm).
The elements out of the range could be detected based on the histograms. Accordingly, TiO2, and other elements such as Cl, Ba, Cu, Sn, Pb, Ni, V, Zr, Rb, Co and As have 3, 2, 2, 2, 3, 1, 3, 3, 3, 2, 1 and 4 data values out of the normal range, respectively, and the necessary corrections have been done on the values accordingly.
6.2. Pearson Correlation Coefficient Factor
Pearson correlation coefficient factor (r) calculates the correlation value between two spatial variables that varies between −1 and +1. If the obtained value is zero, there would be no correlation between the two variables. If the value is +1, perfect positive correlation and if the value is −1, perfect negative correlation yields.
The correlation coefficient values of the elements, using Pearson method, for the Jalal-Abad area is given in Table 2 in which the high correlation coefficient values are in green, strong correlation coefficient values are in
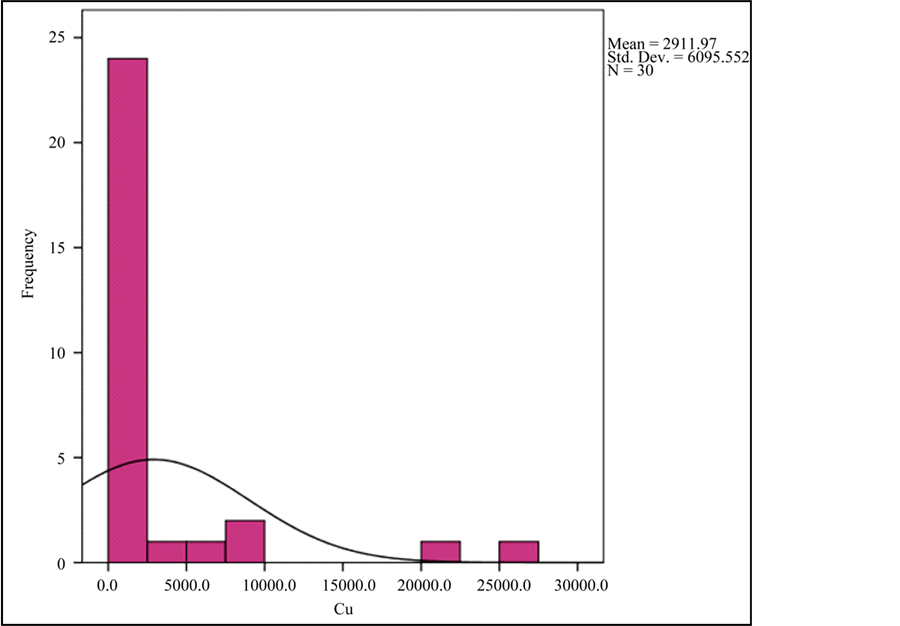

Graph 1. Frequency histogram for Cu and TiO2 abundances.
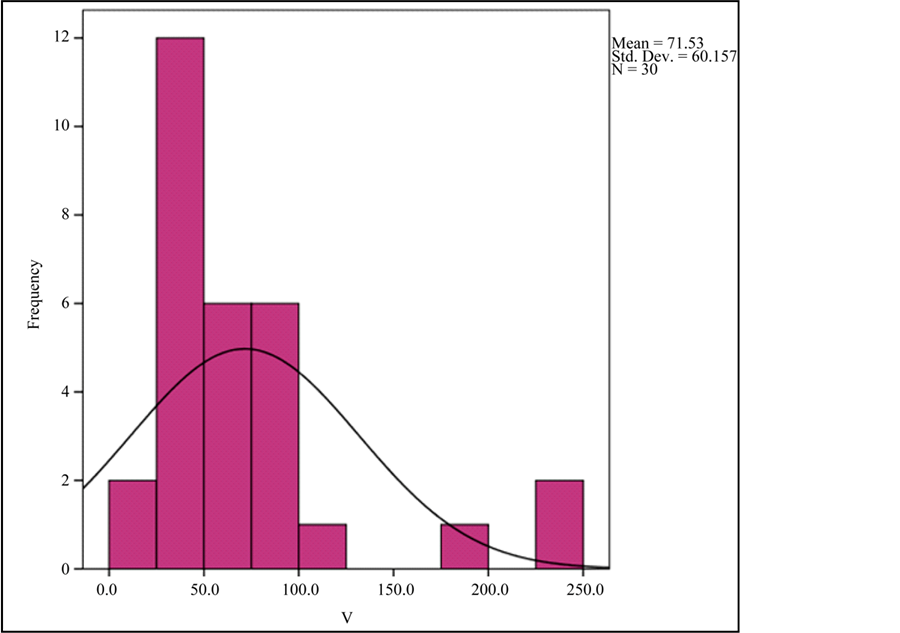

Graph 2. Frequency histogram for V and Ce abundances.

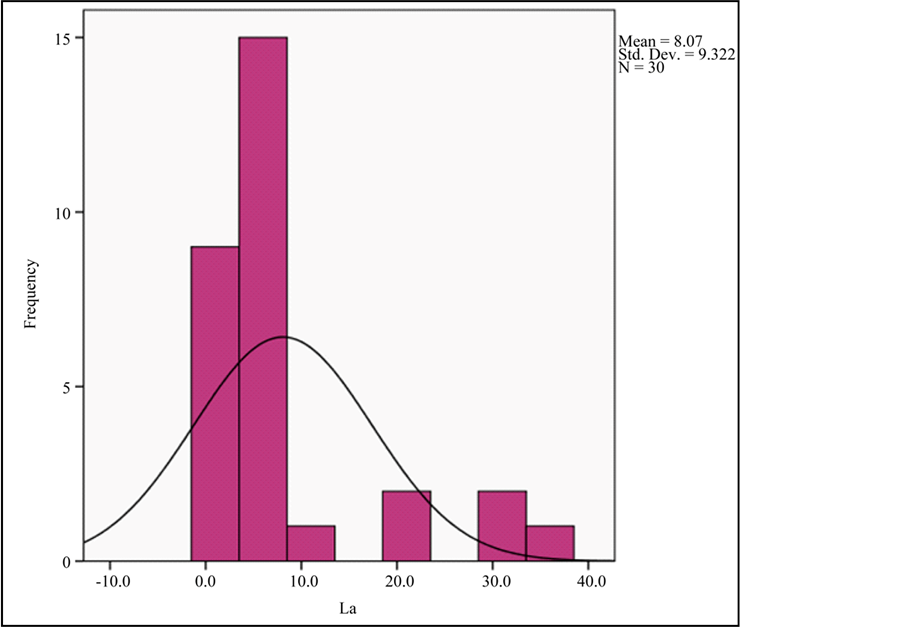
Graph 3. Frequency histogram for Y and La abundances.
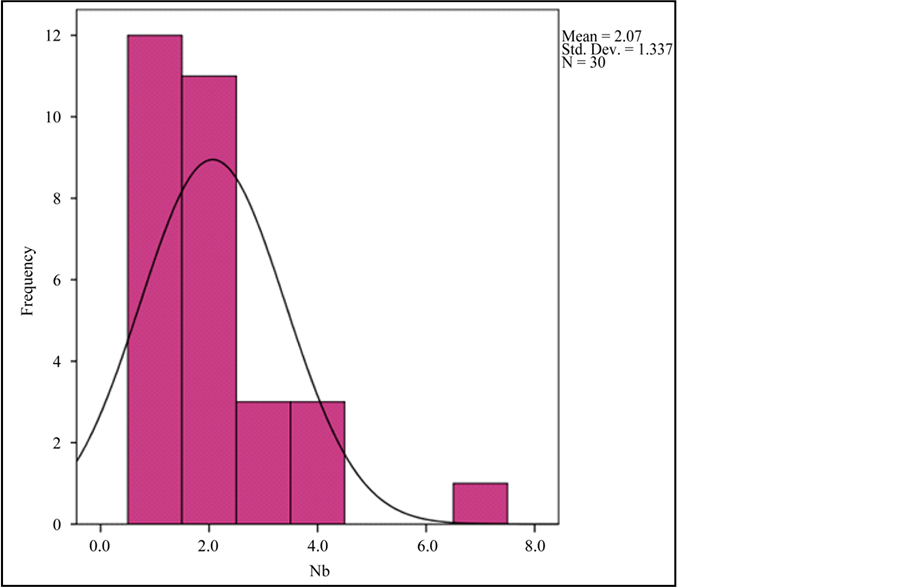
Graph 4. Frequency histogram for Nb abundance.
yellow and very strong correlation coefficient values are in red. Accordingly, there is a strong correlation between Cu and Cl (p < 0.01, r = 0.52). Also, there is a positive and strong correlation between Zn and Pb (p < 0.01, r = 0.68) and Sr and Pb (p < 0.01, r = 0.63) suggesting a common source for these elements. The close association between Cu and Cl with metasomatic host rock indicates a common source. The association of Galena with sphalerite in the mineralizations contained in limestone units is the reason for correlation between the constituent elements. Moreover, there is a strong and positive correlation between Ce and La (p < 0.01, r = 0.95), Ce and Y (p < 0.01, r = 0.64), Ce and Sr (p < 0.01, r = 0.66). Indeed, there is a rather strong correlation between Ba and Pb suggesting a common source for these elements. LREE enrichment in this region resulted in geochemical distribution of these elements in the area and good correlation between these two elements. There is a strong negative correlation between Th and Y, whereas Th shows a rather strong positive correlation with Ti, W and Zn suggesting contrasting origins for these elements (Table 2).
7. Multivariate Statistical Analysis
7.1. Cluster Analysis (Ca)
Cluster Analysis as a technique in multivariate statistical analysis helps in finding the real groups and reduces the data density. This type of analysis was carried out for the normalized data as follows (Figure 5).
There are four important paragenetic groups based on the cluster analyses (dendrograms) of the geochemical data obtained in Jalal-Abad. The first group contains La and Ce associated with minor amounts of Ba, Nb, W, Y and Sr. In this group, there is a strong correlation between La and Ce. These elements show rather weak correlations with Sr, Y, W, Nb and Ba. According to this cluster analysis, the rare earth elements with a common source are in the same group. The second group comprises Zr and TiO2 associated with Cr and V. Within this group, there is a strong correlation between Zr and TiO2 and also between Cr and V. There is a clear close geochemical relationship between these elements in this group. There is a strong correlation between Ga and Rb in the third group. Also there is a weak correlation between U and Mo. The fourth group comprises Th, As, Cu, Cl, Co, Ni, Pb and Zn which have a strong correlation between Cu, Cl, Th and Zn, moreover, has a strong correlation with Pb and a relatively weak correlation with Ni.
![]()
Table 2.Pearson correlation coefficient for the elements analyzed in the study area.
![]()
Figure 5. Cluster analysis of the elements in the Jalal-Abad exploration area.
7.2. Principle Component Analysis
Principle component analysis is usually used as a complementary method to better determine and interpret the relationships between the soil variables. This method is based on the correlation matrix among the variables [10] . It can explain much information about the basic structure of the data, and also, the possible relationships among the data. In other words this statistical method, is used for the determination of the main control variables in a data series Features such as ionic radius, ionic charge, and the relationships between the mobility and behavior of the elements with organic matter and clay minerals, and the identification of the common sources are among the most important factors resulting in elemental distribution within these components. Eigenvalues, percentage of the variance, and cumulative percentage have been calculated in accordance with the factors and then the larger quantities (0.714) are extracted and rotated (Table 3). According to Table 3, the highest eigenvalues (variance) are related to the first and second components with variability percentages of 32.664 and 19.457, respectively. These seven factors account for 82.2% of the variance.
The scree plot in Figure 6 shows the calculated eigenvalues arranged from the largest to the smallest values.
![]()
Table 3. Eigenvalues, percentage of the variance, and cumulative percentage of variance in accordance with the calculated factors for the Jalal-Abad deposit.
![]()
Figure 6. The scree plot in Figure 6 shows the calculated eigenvalues arranged from the largest to the smallest values.
This chart clearly shows that some of the selected factors have the maximum flexibilities. It has a steep slope toward the seventh factor, and then the graph assumes a rather constant gentle slope. Here in, using the Varimax Rotation method has been applied to the coefficient factors. The rotated component matrix is shown in Table 4. Elements scattering in the rotated space are also shown in the factor analysis in Figure 7.
Accordingly, following the factor analysis, six factors were proposed based on the data in Table 4 and the scatter plot of the elements in the rotated space by component analysis: the first factor includes Ce, La, W, Zr, Y, Rb, Nb and Sr; the second factor comprises Co, Mo and As; the third one includes Ba, Zn and Pb and the forth includes Ni, Cu and Cl. The fifth (Cr and V) and sixth (Th and Ga) factors have been also proposed. According to the above analyses, the rare earth elements come in the same group and have a common source. The Cu, Ni and Cl associated with metasomatic host rocks and Pb, Zn and Ba associated with carbonate host rocks all have a lithogenic origin.
![]()
Table 4. The rotated atrix used in the factor analysis.
![]()
Figure 7. The results of the component analysis of elements in the rotated space.
8. The Zoning of the Elements Distribution
The common statistical techniques were used to construct maps based on the frequency distribution of the elements. Since this study was aimed at examining the frequency distribution of the precious metals associated with Fe and REE, the distribution map of the normal data was drawn (Figure 8 & Figure 9). Surfer software was used for drawing the maps and Inverse Distance Squared method was utilized for estimating the data points by multivariate interpolation. The map coloration was based on the frequency percentage values in Table 5. 5 colors including red, orange, yellow, green and blue were used for the elements in Table 5.
Cu and Ti are proposed to be associated with Fe in the Jalal-Abad exploration area. The concentrations of Cu, Ti and REE in the collected samples are low. Geochemical distribution maps of the elements indicate that the distribution of TiO2 in most other areas is at background values and in some areas is lower than the background and only in limited parts (in NW of the area) show anomalous values. Cu distribution in the eastern part of the area is at the background and in the western part is lower than the background. Two smaller parts in the southern part of the area show Cu concentrations near to the threshold values. The combined concentration of Ce, La and Y indicates that in most places they are in the range of background, values whereas in some places they reach threshold amounts. Separation of two groups of rare earth elements (HREE and LREE) function Mineralogy is unaltered stones. The difference Due to the separation of the REE in the capacity of cationic The different environments [11] -[13] .
The results of analysis of 14 samples collected from drilled holes show average TiO2 values of 2227 ppm while the surface samples collected have on average 1420 ppm of TiO2. Moreover, average Cu concentration reaches 135 and 2911 ppm in the drilled holes and in the surface samples, respectively. The average amount of V and REE in the drilled hole samples is slightly more than the average amount of these elements in the surface samples. This evidence suggests that Ti content is higher in depth in comparison with the shallower parts. Moreover, oxidation of the copper sulfide samples resulted in the accumulation of Cu oxides, with higher Cu concentrations, on the surface. The results of the chemical analysis of the iron ore samples in the Jalal-Abad area show low Ti and P contents. Furthermore, low-P iron mineralization occurs in the area. The results of chemical analysis by XRF indicate copper enrichments (up to 2500 ppm) related to malachite and azurite mineralization.
![]()
![]()
Figure 8. Geochemical distribution map of TiO2 and Cu.
![]()
Figure 9. Geochemical distribution map of Ce, La and Y.
![]()
Table 5. Map coloration according to the frequency percentages of the elements.
[6] Has compared the chemical composition of a Jaspilitic iron ore sample with the host rocks of the BIF-type iron deposits showing a similar enrichment for two rock samples in LREE related to the concentration of such elements in OH-bearing minerals like chlorite, talc and sericite which in turn suggest high water/rock ratios during the exhalative hydrothermal water interactions. In a similarly manner, [6] [14] also show that the REE distribution pattern matches that of the oceanic waters. Eu shows negative anomaly in this pattern indicating the effect of hydrothermal processes on acidic rocks containing Ca-rich plagioclase with large amounts of detrital and diamictitic sediments involved in the process.
9. Conclusions
Magnetite is the main ore mineral in Jalal-Abad iron deposit, mainly in deeper parts where the original mineralization escaped the surface weathering processes. Hematite formed as a secondary mineral during the oxidation of magnetite, largely found in shallow levels and enriched in the crashed zones. The ore minerals include magnetite, hematite, pyrite, chalcopyrite, limonite, goethite, malachite and azurite. Cu and Ti are among the associated elements with iron in the ore samples. The geochemical distribution maps of the elements indicate that TiO2 distribution is as much as the background contents; however, in some parts, it is characterized by a negative anomaly. Cu concentration in the eastern part is at the background values, whereas, in the western part it shows a negative anomaly. The combined concentrations of Ce, La and Y show background values for most areas, although in some cases higher, threshold values have been measured. The average TiO2 content in the drilled core and surface samples reaches 2227 and 1420 ppm, respectively. The average copper contents in the drilled core and the surface samples are 135 and 2911 ppm, respectively. The Pearson correlation coefficient values show a good correlation between Cu and Cl. The strong correlation among Pb, Zn and Sr suggests a common source for these elements. Also, there is a strong and positive correlation among La with Ce and Y. A close association between Cu and Cl with metasomatic host rock, and among Pb, Zn and Ba with carbonate host rocks are also indicated.
Four geochemical associations identified by cluster analysis (using dendrograms) in the Jalal-Abad deposit include La and Ce associated with Ba, Nb, W, Y; TiO2 and Zr in association with Cr and V; Ga and Rb associated with Mo and U; and Th, As and Cu associated with Co, Ni, Pb and Zn. In the factor analysis performed, six factors were introduced as followed: the first factor comprises TiO2, Ce, La, W, Zr, Y, Rb, Nb and Sr; The second factor comprises Co, As and Mo; The third factor comprises Pb, Zn and Ba; The forth factor comprises Ni, Cu and Cl; The fifth factor comprises Cr and V; and the sixth factor comprises Ga and Th.
NOTES
*Corresponding author.