1. Introduction
The process by which massive stars form remains uncertain after much study. Generally, two broad models exist. In the first—the core accretion model [1] -[3] —massive stars from through the accretion of turbulently supported gas to form massive proto stars. In the second—the competitive accretion/collision model [4] -[6] —low mass stars form in clusters, and run-away accretion and stellar collisions lead to a buildup of massive stars.
The envelopes of massive star-forming regions have been well-studied both observationally, and theoretically. While the properties of the outer envelope have given some insight into the microphysics of these regions, two observational effects have limited the ability to infer much about the star-formation process. First, the relative infrequency of massive stars leads to the result that many high-mass star-forming regions lie at large distances (> 1 - 2 kpc), and so are not well-resolved. Second, their high opacities during the formation phase, followed by the quick disruption of their natal environment upon “turn-on” makes direct observation of their inner structures difficult at best.
Moving in from the envelope, it is expected that signatures of the star-formation process might well be apparent in the Warm Inner Transition regions (WITs) of these massive star-forming regions. Intuitively, one would expect different distributions of material in these regions. In the collision case, disruption might be expected to either evacuate the disk region and/or produce significant clumping. Indeed, [7] suggests that massive stellar encounters should limit disks to less than 30 AU. Likewise, in the case of core accretion, one might expect disks and large amounts of gas near the protostellar surface. In this vein, [3] predict that massive stars have disks ~100 s - 1000 s AU in size.
In this paper, we study the WIT of NGC 7538 IRS9 using mid-infrared (MIR) absorption lines of C2H2 as observed by TEXES on GEMINI. The MIR lines have three significant advantages in this context. First, the MIR lines are essentially limited in angular resolution only by the size of the warm region against which the absorption occurs, thus more directly probing the WIT. Second, the MIR lines have the potential to probe much higher excitation conditions than low-lying radio line, providing a cut in “excitation conditions” to probe the WIT. Finally, MIR lines provide high data density, so that a large dynamic range of conditions may be probed.
In this paper, the source is discussed in Section 2. The model is then described and the approach to fitting the data is also discussed in Section 3. The models are applied to the data and the results are in Section 4. We discuss the results and their interpretation in Section 5. Finally, Section 6 contains a summary of the results.
2. NGC 7538 IRS9: Observations and Data
Reference [8] used trigonometric parallax to place NGC 7538 at approximately 2.7 kpc. As such, it is a relatively nearby high-mass star-forming region, and thus a good target for studying the chemical and physical structures involved in high-mass star formation. While the precursors to complex molecules have been observed in the exterior of the circumstellar envelope [9] , observations of hot complex molecules are more lacking [10] . As a result, the observations detailed here involve the ro-vibrational absorption lines from C2H2. Due to the combination of consideration of ro-vibrational lines and the effectively small beam size of absorption measurements against a hot central source, it is expected that these observations may more easily concentrate on the warm interior of NGC 7538 IRS9.
The observations considered here were taken with the Texas Echelon Cross (X) Echelle Spectrograph (TEXES; [11] ) on the Gemini North 8m telescope in October 2007, and at the NASA Infrared Telescope Facility (IRTF) in June 2001.The data were originally presented in [12] , and are only briefly described here.
The data were obtained in a 0.5" slit width (4" slit length) on Gemini. The telescope was nodded by ~1" - 5", and the adjacent nod positions were subtracted. Sky calibration was carried out in accord with [11] , and flux calibration followed the approach of [13] .
Acetylene (C2H2) was observed in the ν5 R-branch (J = 5.6) as well as approximately ten lines of ν5 Q-branch. The ν5 R(1) and R(13) lines were observed with IRTF.
Acetylene was chosen as a target molecule due to predictions [14] that it could be produced in the gas phase with abundances of x(C2H2) = n(C2H2)/n(H2) ~ 10−8 for T ~ 400 K, and x(C2H2) ~ 10−6 - 10−7 for T ~ 800 K. As a result, gas-phase production of C2H2 would be a signature of warm gas, expected to arise from the central WIT of NGC 7538 IRS9.
3. Model Description and Fitting Approach
3.1. Model Description
The most exact model that one might construct would involve a non-local treatment including the simultaneous solution of both the equations of statistical equilibrium and radiative transfer. This has been done by many authors (e.g. [15] -[17] ). In this application, we are hampered by two problems. First, due to the fact that these are rovibrational lines, a very large number of lines must be considered. This makes the problem extremely CPU intensive, thus significantly reducing the ability to constrain the source properties. Second, and most importantly, data do not exist for the rovibrational collision rates.
With these two difficulties, we take a separate approach. Given that the lines are seen in absorption, we consider instead absorbing screens between the observer and the background against which the absorption occurs. In this approach, we aim to understand the distribution of material that contributes to the absorption. In particular, we wish to understand 1) how much material does the absorption, 2) how distributed in excitation is the material, and 3) how extended is the material/how much of the emitting background is covered by the absorbing material. Once these gross properties of the absorption are understood, it will be possible to see to what extent these macroscopic effects are (in) consistent with various geometries and excitation/production mechanisms.
Each of the absorbing screens is characterized by four main factors: column density of C2H2 (Ni), filling factor (fi), rotational excitation temperature (Trot,i), and vibrational excitation temperature (Tvib,i). Here the index corresponds to the screen number, so that each screen is allowed to have its own combination of properties. While the radial and turbulent velocities are also parameters for each screen, they are fixed at vr = 0 and vt = 3 km∙s−1 [18] .
Once the screen properties are defined, we are able to define the level populations for the screens. The C2H2 level assignments, energies, transitions, and Einstein A coefficients are taken from the GEISA database [19] . The background source is taken to be a blackbody, though due to the background subtraction, the details of the background do not affect the modeled lines. Given the background and molecular information for the screens, we solve the radiative transfer equation by ray-tracing from the background source, through the screens, to the observer.
3.2. Fitting
The quality of fit between the simulated and actual observations are calculated through a reduced χ2, namely,

In this expression, N is the number of spectral channels being summed over, χi is the uncertainty in the ith datapoint, and yi,obs and and yi,mod are the observed and modeled data for the ith point respectively. Data points that do not lie within a line have the effect of artificially lowering the χ2 value. As a result, we limit our fits to the regions near the lines. We also remove any extraneous points with atmospheric transmittances below 0.25. As these definitions are ad hoc, there is some flexibility in the actual values of the computed χ2. However, these assumptions do not change the qualitative nature of the χ2, nor do they change the location of the minimum (bestfit) in parameter space.
In doing the fitting, we employ two approaches. In the first, we do a global fitting. Starting with an initial guess for each of the parameters, we use the Levenberg-Marquardt algorithm as expressed in DNLS1 of the MINPACK library [20] . In order to consider the possibility that the parameter space maybe topologically complicated, we start the fitting multiple (over ~1000) times. We compare the best fits from each start. We find that almost every start leads to the same result, to within numerical noise. We call the final solution with the lowest χ2 the best fit.
In our second approach to the fitting, we construct a grid of models. Starting from the best fit above, we modify the input parameters in a regular fashion to obtain χ2 values for models in the neighborhood of the best fit. This gridding approach allows us to 1) confirm the validity of the best fit in the local region, and 2) understand the topology of the local parameter space. This second point not only aids in our understanding of the data, but more importantly helps to provide confidence intervals on our results in the next section.
4. Results
4.1. Multiple-Screen Best Fits
In our first approach to fitting, we considered two screens, each having their own column density, and rotational and vibrational excitation temperatures. The results of the four best fits are shown in Table1 In the four best fits (from our initial list of ~1000 different initial conditions), we find a mean ratio of column densities between the two screens of N1/N2 = 292. In these fits, one of the screens is transparent and plays little-to-no role in the absorption. These fits are statistically indistinguishable, having χ2 = 0.91 +/− 0.01. Further supporting this idea is near constancy of the rotational temperature, and consistently low value of the vibrational temperature.
The best fit is shown in Figure 1. As can be seen, those data with the highest signal-to-noise ratio (SNR) are fit quite well. As the SNR decreases, the fits still generally match the depth and position of the observed lines, though the noisiest data (the Q-branch) are quite difficult to consider due to instrumental/baseline effects. To show the effect of various values of χ2 in Figure 2, we plot three different fits. The solid line corresponds to the best fit having χ2bf = 0.91. The long-dashed line corresponds to χ2 = 1.1 χ2bf = 1.0. Finally, the dotted line is for a model with χ2 = 1.5. From this we see that as defined here, a χ2 value of 1.0 provides an adequate fit, but one still observably different from the best fit. By the time χ2 = 1.5, we find generally unacceptable fits. As a result, in the following discussions, we consider χ2 < 1 to be acceptable and χ2 > 1.0 to be not acceptable.
4.2. Two-Screen Grids: Confirming One Screen
To understand the robustness of the result above that one screen dominates the absorption, we have constructed grids of two-screen models based around the best fit properties. In particular, we can consider what happens when the column densities of the two screens are varied.

Figure 1. The observed data (points with error-bars) and best fit model (solid lines) for C2H2 toward NGC 7538 IRS 9.

Table 1. Sample of four best fit two-screen models.

Figure 2. The observed data (points with error bars) and different fits. The best fit (χ2 = 0.91) is the solid line. The long dashed line has χ2 = 1.0, and the dotted line has χ2 = 1.5 for comparison.
Table 2 Best Fit Parameters for Absorbing C2H2 Screen Toward NGC 7538 IRS 9
The results of this approach are shown in Figure 3. As can be seen, the results are degenerate, namely only one total column density is consistent with the data, N(C2H2) = 2.4 +/− 0.6 × 1016 cm−2. It is important to note that in these grids, the column densities were fixed at each point on the grid, while the excitation temperatures were allowed to vary. In these cases, the excitation temperatures were nearly always within a few percent of each other.
The final conclusion is that, as noted previously, the absorption appears to be dominated by a single screen of material.
4.3. One-Screen Grids: Determining Material Properties
With the determination that most of the absorbing material lies in one screen, it is possible to better understand the topology of the parameter space around that best fit. By understanding the topology we can better understand the robustness of the results, and place uncertainty limits on our derived quantities.
To do this, we consider grids of single-screen models around the best-fit result. The results are shown in Figures 4-6. From these figures, it is clear that it is possible to constrain the screen properties with meaningful precision. In particular, we see that the column densities lie in the range 1.8 × 10¹⁶ < N (C2H2) < 3.0 - 1016. The vibrational excitation temperature lies in the range Tvib < 200 K. And finally, the rotational excitation temperature lines in the range 80 < Trot < 140.
We can also see the effect of varying the filling factor. In Figure 7 we plot the model results (along with their uncertainties) as a function of filling factor. Here we assume four filling factors, 0.03, 0.1, 0.3, and 1.0. As can be seen from the top panel, the best fit—signified by the minimum χ2/χ2min occurs at f = 0.1. This is consistent with our previous results.
Interestingly, the vibrational temperature in all cases is low (Tvib < 200 K). Even more importantly, it is always consistent with Tvib = 0 K, when the uncertainties are considered.
Finally, even though the filling factor varies, the “total column density” as measured by N(C2H2) × f is always consistent with N × f ~ 1.5 - 2.5 × 1015 cm−2. In other words, the total number of C2H2 molecules along the line of sight integrated over the background emitting region is independent of the filling factor adopted in the modeling.

Figure 3. Contours of χ2 for two screens, as a function of the column densities of each of the screens. Notice the degeneracy, such that the two screens act as one.

Figure 4. Contours of χ2 for one screen, as a function of the column density and rotational temperature of the screen.

Figure 5. Contours of χ2 for one screen, as a function of the column density and vibrational temperature of the screen.
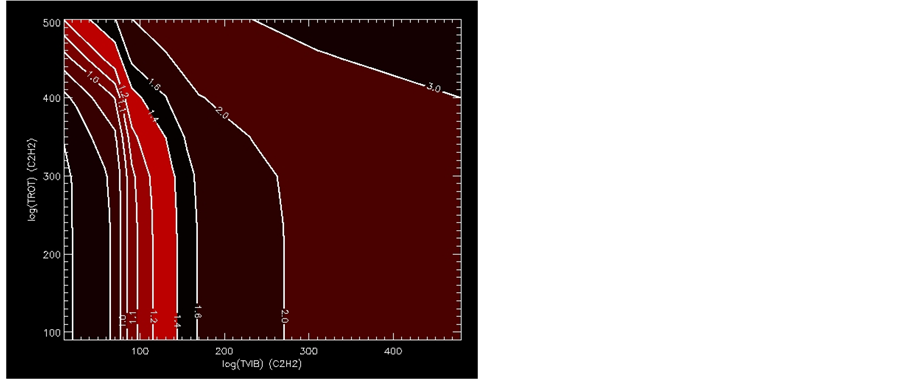
Figure 6. Contours of χ2 for one screen, as a function of the rotational and vibrational temperatures of the screen.

Figure 7. The dependence of various physical parameters on the filling factor. The top panel shows χ2 relative to the minimum value. The second and third panels show the rotational and vibrational excitation temperatures. The bottom panel shows the total amount of C2H2 covering the source, as measured by the column density (in units of cm−2) times the filling factor. The error bars on each point are limits on the uncertainty of the data from the fitting.
5. Discussion
The best-fit parameters for the absorbing screen toward NGC 7538 IRS9 from the previous section are shown in Table2 From these parameters, we seek to infer the origin of the C2H2, as well as understand what constraints it may place on the structure of the WIT contained in NGC7538 IRS9.
5.1. Origin of C2H2
One of the most interesting results of the modeling is the rotational excitation temperature of the C2H2, namely ~100 K (actually 80 - 140 K). The photon reprocessing due to the high optical depths, together with the dust.
modified Wein’s Law from [21] yields a dust temperature emitting in this spectral range of T > 250 K. As a result, the background source appears to be spatial separate from the absorbing material.
While the physical location of the absorbing screen relative to the background source is to be expected, the rotational excitation temperature is something of a surprise since the gas-phase modeling of hot cores by [14] and the recent results of [22] suggest that C2H2 does not reach fractional abundances of 10−7 - 10−8 in the gas-phase until at least 400 - 800 K. At the temperatures of T ~ 100 K here, [22] predicts fractional abundances of < 10−9. This is shown in Figure 8, where we plot fractional abundance contours as a function of the radiation field, specified as G0, the ratio of the UV radiation field relative to the standard interstellar radiation field. At this fractional abundance, an H2 column density of 1026 cm−2 is required to achieve the observed C2H2 column density. This is much larger than the inferred H2 column density of ~5 × 1022 cm−2 [23] [24] .
Taken together, the data above argue significantly against a gas-phase origin for C2H2 in this absorption screen. Given the fact that water ice is observed to sublimate at ~100 K [25] , the excitation temperature of 80 - 140 K suggests a grain-surface origin. Indeed, [26] [27] find that many species are trapped in the water ice in grain mantles, and co-desorb with water near 100 K. The range of temperatures in the 100 - 140 K range is reasonable, and may be due to differences in the type of ice, kinematics if the material is in falling, or reprocessing of the C2H2 at higher temperatures.
From a theoretical perspective, formation of C2H2 is reasonable. As early as [28] , abundances of C2H2 as high as x ~10−7 have been predicted on grain surfaces. Cometary measurements [29] and laboratory work [30] suggest that C2H2 should exist as a component in ices. On the other hand, [31] makes the suggestion that AGB stars form C2H2 as precursors to grains, and that the remaining C2H2 freezes onto the grain surface.
While we cannot say with any certainty what the origin of the C2H2 is in the ices—whether they are formed in the gas phase and adsorbed, or whether they are formed on the ice mantles themselves—it does appear that C2H2 is liberated from the ice mantles toward NGC 7538 IRS9.
This suggestion is perhaps consistent with NGC 7538 IRS1, a separate high-mass YSO in this region. Reference [32] finds that a consistent model for HCN and C2H2 cannot be achieved from gas-phase chemistry alone. They suggested that C2H2 evaporation from icy mantles might explain their observations.
5.2. Pumping of C2H2 by Radiation
It appears that there is little if any radiative pumping or excitation of C2H2 by radiation. This can be seen from the inferred vibrational excitation temperatures. While we find Tvib < 100 K, all results appear to be consistent with Tvib ~ 0 K. This result is probably not a surprise, given the relatively large H2 column density ~5 × 1022 cm−2 toward NGC 7538 IRS9. As a result, the ~100 K C2H2 observed here would see little if any of the ~6 μm radiation that would be necessary to excite the higher vibrational levels and thus populate the upper level probed here.
5.3. Possible Implication for the WIT Geometry
It is interesting to speculate about the implications for the WIT geometry in NGC 7538 IRS9 based upon these results. There are four that we choose to consider here: sphere, clumps, outflow cavity wall, and central disk. In considering these possible geometries, we will take the beam as slightly larger than the diffraction-limited size ~1400 AU at the adopted distance of 2.8 kpc.
The first case to consider is the spherical geometry. Dust emission from NGC 7538 IRS9 was observed and modeled by [33] . They found a central source of L = 3.6 × 10⁴ Lsun, density power law index p = 1.75, and den-

Figure 8. Contours of C2H2 abundance as a function of the radiation field (G0) and temperature.
sity at r = 1000 AU of n1000 = 1.2 × 107 cm−3. Such a spherical model generates a dust temperature of 100 K at r ~2700 AU. As a result, the absorbing screen would fill approximately the entire beam—a result inconsistent with the inferred beam-filling factor f = 0.1.
If the general star-forming region is somewhat regular on large scales, but not on all scales as shown above, it is possible that the WIT is clumpy due to fragmentation or outflows. In this case, the C2H2 could be scattered through the WIT in clumps. If we assume that clumps should be no larger than about one-tenth the size of the beam, this would yield rclump < 1015 cm. If we allow a clump to have a number density of nclump = 107 cm−3, we find that the relative C2H2 abundance necessary to achieve the inferred column density of 2.5 × 1016 cm−2 is x (C2H2) > 2.5 × 10⁻⁶ (N/2.5 × 1016) (107/nlump) (1015/rclump). This is a lower limit to the C2H2 fractional abundance, and is approximately 25 - 100 times greater than that found either in the gas-phase [14] [22] or solid-phase predictions [28] .
A third possibility, raised by results for the high-mass source AFGL 2591 [34] -[36] , is an out flow cavity wall subject to irradiation from the central source. Reference [37] suggests that the source is nearly pole-on, as observed by bipolar, extremely high velocity out flows. Since the outflow walls will presumably extend to the edge of the envelope, the cavity will fill a significant portion of the beam, and more probably fill it completely. This is much greater than the inferred filling factor, and thus rules out the outflow cavity wall scenario.
It is also possible that the C2H2 ice may be transported via in falling filaments observed toward massive star-forming regions [38] [39] . These regions show evidence of complex molecules and in fall on spatial scales down to approximately 5000 - 10,000 AU. Unfortunately, the temperatures observed toward these regions may be somewhat high (up to 200 K [39] ) compared to the C2H2 temperatures inferred here.
The final case which we may consider is a massive disk. To be clear, this is speculative since disk around massive YSOs have not been directly observed. However, simulations (e.g. [40] ) suggest that disk-like structures may be formed, and observations (e.g. [41] ) have found disk candidates around high-mass YSOs. Disks around high-mass stars may be expected to be approximately r ~ 400AU (e.g. [42] ). If we take a distance l = 100 AU over which C2H2 exists, we find a required C2H2 fractional abundance of x(C2H2) = 10−9 (1.5 × 10¹⁵/l). This would be reasonable, with sufficient range to allow for different production conditions/mechanisms.
The second issue to consider with disks is the beam-filling factor. Taking the beam-filling factor to be the area of the beam filled by C2H2 divided by the total area of the beam, this can be easily calculated. A beam size of 700 AU would suggest a C2H2 region of size 200 AU to achieve f = 0.1. For comparison, in Figure 9 we plot the temperature distribution for a high-mass disk using the Pro Dimo code [43] . Note that the region including T ~ 100 K extends out to r ~ 200 AU, and has a vertical thickness of approximately Δz ~ 100 AU. While such highmass disks are not certain, it is interesting to note that such a disk would be consistent with the observations. This possibility, and the potential role of filaments, will be the subject of a following paper.

Figure 9. The temperature distribution in a sample high-mass disk as calculated using the ProDimo code. Note the region of T ~ 100 K extends to approximately 200 AU.
6. Conclusions
In this paper we have described the observation, modeling, and interpretation of ro-vibrational absorption lines of C2H2 toward the high-mass star-forming region NGC 7538 IRS9. The goal is to understand the conditions of the warm, inner, transition (WIT) that exists between the relatively regular envelope and the protostar. We have performed fits on the data where we vary the rotational and vibrational excitation temperatures, the filling factor, and the C2H2 column density. We followed these fits up with local grids to understand the topology of the surrounding parameter space, as well as the robustness of the inferred source parameters. The resulting interpretation can be concluded as follows:
1) Even when multiple components are allowed, the data are degenerately best fit by a single screen, suggesting that the gas-phase C2H2 has primary dominant origin (Section 4.1).
2) The best fit model properties include: a column density N(C2H2) = 2.4 +/− 0.6 × 1016 cm−2, a rotational excitation temperature of 80 < Trot < 140 K, avibrational temperature is Tvib < 200 K (and consistent with Tvib = 0), and a filling factor is f = 0.1 (Sections 4.2 & 4.3).
3) The column density, and excitation temperature are both in consistent with a gas-phase origin for C2H2 (Section 5.1).
4) While it is unclear if the C2H2 is formed on the grain surfaces or freezes out there from the gas phase at some earlier time, the ~100 K rotational temperature is interpreted as due to grain-surface evaporation of C2H2 (Section 5.1).
5) The low vibrational temperature is consistent with effectively no infrared radiative pumping of higher lying vibrational lines (Section 5.2).
6) The data are not consistent with a spherical, clumping, or outflow cavity wall for the WIT. However, a high-mass disk is consistent with the observations (Section 5.3).
Acknowledgements
This work was supported by NASA Grant NNX08AH28G (SDD) and by a research release (SLD).