Forest Transition and Changes in the Socio-Economic Structure of a Developed Country: A Long-Term Analysis ()
1. Introduction
Worldwide forest dynamics, in recent years formalized with the term forest transition (FT) when linked to a set of changes involving forests and societal change (Mather [1] ; Mather [2] ; Mather and Needle [3] ; Rudel [4] ), showed divergent trends (from decline to expansion of country forest areas and vice versa) depending on the local socio-environmental conditions. Forest expansion was found correlated with the level and the long-term sustainability of the socio-economic development (Redo et al. [5] ; Mather [6] ; Mather [7] ; Gutiérrez Rodríguez [8] ). The assessment of changes from net deforestation to net reforestation has been linked to macro-economic factors such as the level of industrialization, population dynamics (i.e. rural abandonment and urbanization), agricultural dynamics (i.e. agricultural intensification), establishment of tree plantations, learning and education level, knowledge transfer, quality of policies and governance, increased environmental awareness, as well as the factors that influence forest rehabilitation outcomes (de Jong W. [9] ; Mater and Needle [3] ; Mather [6] ); Barbier et al. [10] ; Pagnutti [11] ). This theoretical approach has been demonstrated a useful tool for understanding contemporary land-use changes, the evolution of land vulnerability to degradation and to prescribe policies that promote a more effective and sustainable land management (Ferrara et al. [12] ; Salvati et al. [13] ; Salvati et al. [14] ; Bajocco et al. [15] ; Mancino et al. [16] ). As underlined by Rudel [4] , the global knowledge of forest dynamics may benefited from approaches integrating environmental and socio-economic variables developed on a country scale. As a matter of fact, forest transition theory was largely based on results from case studies at regional, national and sovra-national scales (He [17] ; Yackulic et al. [18] ; DeFries and Pandey [19] ; Meyfroidt et al. [20] ; Klooster [21] ; Hecht et al. [22] ; Bray and Klepis [23] ; Rudel et al. [24] )
Based on these premises, the present study contributes to the in-depth knowledge of ecological factors and socio-economic processes dealing with the forest transition in developed countries (Rudel [4] ). Our paper analyzes the historical trends (1861-2011) of selected indicators of the socio-economic structure of Italy and the latent relationship with forest expansion with the aim to identify the most prominent socio-economic factors affecting the FT in Italy. The paper finally discusses on the political, economic and social forces driving FT at a wider scale in the northern Mediterranean basin.
2. Methods
2.1. Study Area
The area examined in this study includes the entire Italy covering nearly 301,330 km2 of which the 23% are flat, the 42% are hilly and the 35% are mountainous. Italy is cha racterized by a traditional north-south divide in both environmental (climate regimes, landscape, vegetation, soils and cropping systems) and socio-economic variables (income and wealth, labor market and demography). Italian land is actually administered by twenty regional authorities and more than 8000 local municipalities. The national administrative asset remained quite stable during the entire investigated time interval encompassing 150 years between 1861 to 2001 (Istat, 2006).
2.2. Statistical Indicators
The present study was based on 12 indicators derived from elementary, homogeneous data variables made available at the country scale by the Italian National Institute of Statistics (ISTAT) along the entire investigated time window (1861-2011). Indicators include 3 population and human settlement variables, 3 demographic variables describing population structure, 3 socio-economic variables describing changes in the economic structure and the productive base and 3 environmental variables illustrating changes in forest land cover and protected areas (Table 1) made available for the first year of each decade starting from 1861. Due to contingent reasons, 1891 and 1941 data were not available; however, 1941 data were replaced with 1936 data. Variables derived from different official data sources including the national census of population and buildings, population register, forest and environmental statistics. Although providing a partial illustration of the changing socio-economic changes in Italy at a detailed temporal scale, the selected indicators are considered as reliable and homogeneous over time. Restricted data availability and high heterogeneity over the investigated period prevented us to consider a wider indicators’ set.
2.3. Data Analysis
The twelve indicators described in Section 2.2 and made available approximately for each decade between 1861

Table 1 . List of variables investigated in the present study.
and 2011 were analyzed through an exploratory data analysis framework incorporating pair-wise Spearman non-parametric rank Correlation analysis (SC), a Principal Component Analysis (PCA) and a Hierarchical Clustering (HC). The derived SC matrix was used to compare the distribution over time of the twelve statistical indicators in Italy testing for (linear and non-linear) correlations at p < 0.05 after Bonferroni’s correction for multiple comparisons. The PCA was run to identify correlations among the studied indicators and their evolution over time in the 15 decades considered. Components with eigenvalues > 1 were extracted and two separate plots for component loadings (statistical indicators) and scores (years) were produced. Finally, a HC (based on Euclidean distance with Ward’s agglomeration algorithm) was developed to identify similarities in the temporal distribution of the 12 statistical indicators and to classify the examined decades into homogeneous groups.
3. Results
Figure 1 illustrates two time-series dealing with forest transition in Italy: the percentage of forest land and the amount of forest land per inhabitant. The two variables follow different trends with a substantial increase in forest land observed since the 1940s (dotted line) preceded by a moderate decrease. This may indicate the turning point between net forest area loss and net forest expansion in Italy and represents the basic point for the application of the FT theory. By contrast, per capita forest land showed a continuous decrease which is mainly due to the increase of population density observed in Italy between 1861 and 2011 (from nearly 100 to 200 inhabitants/km2). However, the variable declines less rapidly in the period after the 1940s indirectly confirming the turning point identified above.
Based on the observed trends, forest expansion was correlated to the socio-economic indicators collected for the same decades using Spearman non-parametric rank correlation analysis (Table 2). Forest land (FO%) correlated positively with the land surface under protection measures while per capita forest land (FOP) correlated negatively with masculinity ratio (SEX), elderly index (ELD) and population density (DEN). It is clear that forest dynamics are associated with both the higher degree of land protection (rapidly increasing in Italy since the early 1980s) and the (changing) demographic structure in turn associated to the depopulation of inland, rural areas traditionally inhabited by farmers and shepherds that proved to drive colonization of the abandoned land
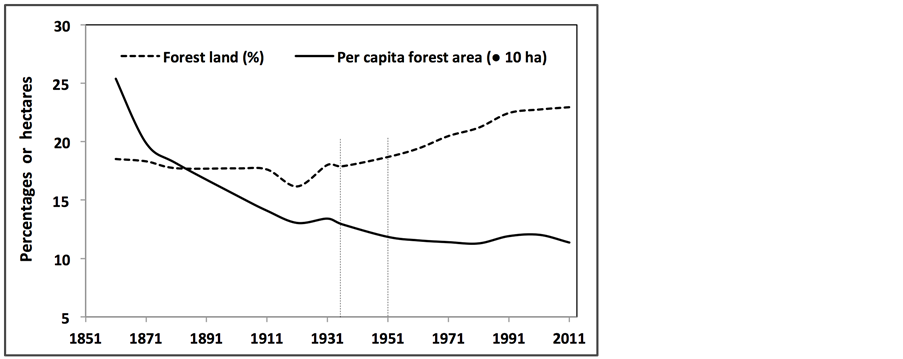
Figure 1. Forest indicators trends in Italy (1861-2011).
Table 2. Non-parametric Spearman rank correlation coefficients between environmental and socio-economic variables in Italy (bold indicates significant correlations at p < 0.05 after Bonferroni’s correction for multiple comparisons).
(cropland, pastures) by forests.
A Principal Component Analysis was used to derive latent trends in the 12 indicators available by decade in Italy since 1861. The PCA extracted two components with cumulated variance higher than 88%. Component 1 (explaining 76% of total variance) identifies a gradient associated to changes in the demographic structure (DEN, ELD, SEX) and in human settlements (SET) together with forest expansion (Figure 2, left) and the higher proportion of land under environmental protection (all variables positively correlated with Component 1). The percentage of workers in the primary sector (AGR) and dependency index (DEP) correlated negatively with the component complementing the picture. Component 1 definitely identifies a gradient indicating the most relevant structural changes occurring with homogeneous and continuous trends along the investigated time interval (Figure 2, right). Component 2 (explaining 13% of the total variance) was associated to variables showing a non-linear, heterogeneous pattern (Figure 2, left) with a turning point between 1951 and 1971.
Population growth rate (GRO), per capita forest land (FOP), the percentage of workers in the secondary sector (IND) as well as the participation rate to the job market (PAP) are the variables most associated with this component. Hierarchical clustering was finally used to assess similarity patterns among years with the final aim to verify the supposed 1936 turning point in the forest-socioeconomic system in Italy. Dendrograms reported in Figure 3(a) classified years and variables in two homogeneous groups using a 70% similarity threshold. Years
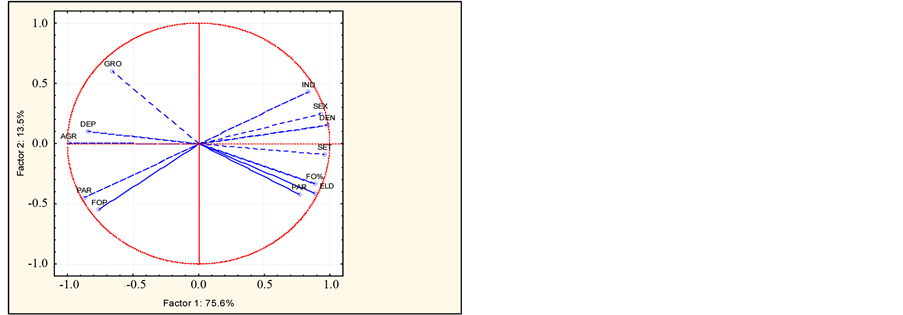
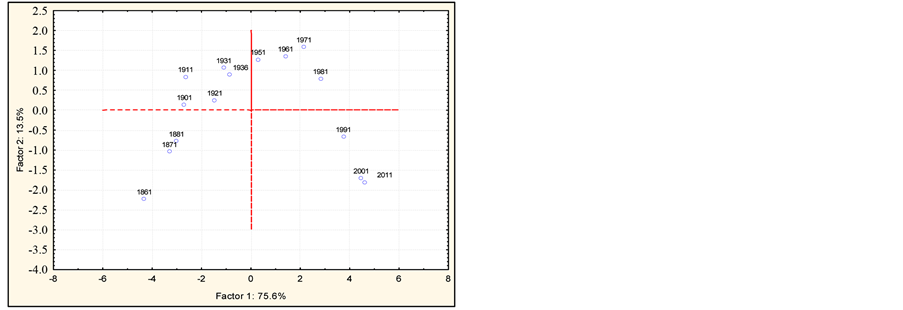
Figure 2. Principal components analysis results (left: component loadings, right: component scores).
 (a)
(a)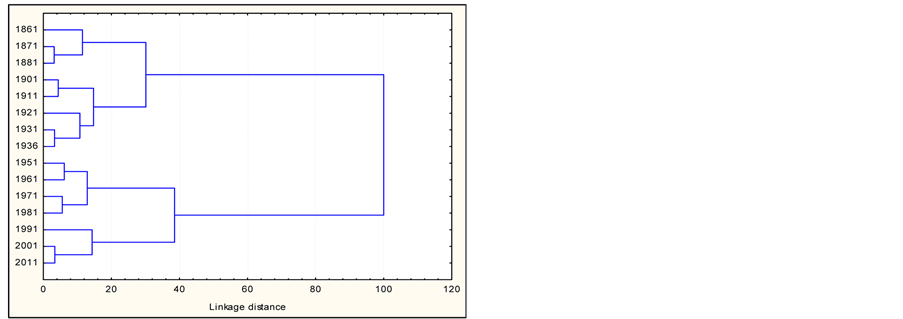 (b)
(b)
Figure 3. Non-hierarchical cluster analysis (Euclidean distances, Ward’s agglomeration rule) evaluating similarity in among the investigated years (a) and variables (b) in Italy.
between 1861 and 1936 clustered together with sub-clusters formed by 1861-1881 and 1901-1936 years. Years between 1951 and 2011 clustered together with sub-clusters formed by 1951-1981 and 1991-2011 years. This classification, together with the results derived from the analysis above described candidates the time interval between 1936 and 1951 as the most probable turning point in the forest-socioeconomic system in Italy. By adopting a 80% similarity threshold, the indicators used to describe the system over time were separated in two homogeneous groups (Figure 3(b)). Interestingly, forest expansion clustered together with variables indicating continuous changes with a linear trend (SET, ELD, PAR, IND, DEN and SEX) while per-capita forest land was associated to variables (GRO, DEP, AGR and PAP) showing a more complex pattern over time with contrasting trends before and after the identified turning point.
4. Discussion and Conclusions
Previous studies have pointed out that the FTT is an effective tool in the analysis of the impact that changes in selected socio-economic aspects of society have, or have had, on the forests and the natural environment at large. The decrease in forest area has been mainly associated with the processes related to the industrialization of society, their increased requirements in terms of rural and industrial areas and urbanization (Meyfroidt and Lambin [25] ). In this regard, while globally the total forest system is still at the stage of “net forest area loss”, with a global forest loss (2.3 million square kilometers) greater than forest gain (0.8 million square kilometers) between 2000 and 2012 (Hansen et al. [26] ), highly variable patterns, processes and causes of change in forest cover were observed at the national scale. In particular, the most developed countries show turning points towards the recovery of forest land and this is possibly due to increased awareness in the adoption of sustainable development and to the achievement of socio-economic thresholds beyond which these models are no longer viable (Bray and Klepis [23] ; Rudel et al. [24] ; Klooster [21] ).
The present study confirms the interpretative framework of the FTT by illustrating the intimate relationship between the historical trends (1861-2011) in the socio-economic structure in Italy and the long-term forest expansion. This approach allowed evaluating how changes in the socio-economic context have influenced Forest Transition (FT) at the country scale. The exploratory data analysis framework identifies the 1936-1951 time window as the most probable turning point in the forest-socioeconomic system in Italy indicating also two groups of variables according to the diverging (linear vs. non-linear) observed time trends.
The temporal linkage between the increase in protected areas with FT in Italy indicates awareness of environmental concerns and, at the same time, the reduced pressure on forest ecosystems due to social change related to the depopulation of entire areas, the decline of the agriculture, a rationalization of the industrial structure and a shift towards the service sector and tourism. These changes positively influence the FT in Italy which is strongly based on the processes of natural expansion of forests in inland areas (Mancino et al. [16] ), which add to the increase of protected areas—mainly woodlands—ensuring a much improved outlook in terms of growth, stability and quality of forest stands.
Acknowledgements
The financial support of “Sapienza” University of Rome (“Desert” project) and Corpo Forestale dello Stato is kindly acknowledged.
NOTES
*Corresponding author.